
Abstract
In this article, the experiments of two-oscillating grid turbulence with viscoelastic fluids were carried out using particle image velocimetry. Two classical drag-reducing additives with viscoelastic characteristics were chosen: polymer (polyacrylamide) and cationic surfactant (cetyltrimethyl ammonium chloride). In order to investigate the viscoelastic effect on coherent structures, proper orthogonal decomposition was performed to identify coherent structures based on particle image velocimetry data. The results show that the minimum number for eigenmodes required for capturing coherent structures, which contains 90% of total turbulent kinetic energy, is 127, 19, and 117 for the Newtonian fluid case, 25 ppm polyacrylamide solution case, and 25 ppm cetyltrimethyl ammonium chloride solution case at grid oscillating frequency f = 7.5 Hz, respectively. It means that coherent structures can be inhibited due to the addition of polyacrylamide additives but not remarkable in 25 ppm cetyltrimethyl ammonium chloride solution case, in other words, the decrease in flow complexity in 25 ppm polyacrylamide solution case. This phenomenon also appears at grid oscillating frequency f = 5 Hz. However, as cetyltrimethyl ammonium chloride solution concentration increases up to 50 ppm, the cetyltrimethyl ammonium chloride solution case shows similar trends as those in 50 ppm polyacrylamide solution case (the number for eigenmodes required for capturing coherent structures is approximate). Therefore, compared with a channel flow with cetyltrimethyl ammonium chloride solution, there exists the larger critical concentration in two-oscillating grid turbulence to show turbulence suppression effect.
Keywords
Introduction
When adding a minute amount of drag-reducing polymer or surfactant additives into turbulent flows, it may cause a remarkable reduction in frictional drag. This phenomenon is called as Toms’ effect or turbulent drag reduction (DR). 1 Since Toms’ effect, many studies have been focused on the turbulent characteristics and physical mechanism of DR with additives in wall-bounded flows, such as channel flow, pipe flow, and so on2–8 due to the wall-bounded nature of those flow geometries. For example, the experimental studies of Li et al. 6 showed that the strength and frequency of turbulent bursting events near the wall are reduced in channel flow with surfactant additives. Through direct numerical simulation, Sureshkumar et al. 7 found that polymer additives induce several changes for turbulent flow characteristics, which are consistent with the available experimental results.
Despite the abundant investigation on turbulent DR with additives in wall-bounded flows, the DR mechanism is still not clear. This is not surprising because it contains two poorly understood problems: turbulence and additive dynamics. Meanwhile, the inhomogeneous nature of wall-bounded flow makes it difficult for studying the interaction between turbulent structures and microstructures of drag-reducing additives, due to the multitude of competing effect. Compared with wall-bounded turbulence, homogeneous isotropic turbulence (HIT) with the period boundary does not consider the inhomogeneity emerging from the wall, so it is easier to study the energy flux from large scales to small scales. Therefore, the study on HIT with drag-reducing additives is extremely important for understanding the viscoelastic effect on turbulent structures and flow characteristics.
Until now, DR is also found to be occurred in flows away from the wall, such as grid turbulence9–14 or bulk turbulence,15,16 where the flow is considered as isotropic turbulence. Fabula 9 first found that comparison with water case, the spectra exhibits higher energy at large wave numbers in polymer solution case based on energy spectra of the streamwise velocity in a grid-generated flow by towing a grid. The results in Barnard and Sellin 10 showed that a qualitative reduction in turbulent small-scale structures and the reduced turbulence intensity compared to that in water case based on the injection of polyethylene oxide (PEO) solutions into a grid-generated flow. Friehe and Schwarz 11 found that polymers cannot alter the energy spectra but significantly change the energy budget. From the study of McComb et al., 12 it was evident that polymers can change the distribution of turbulent kinetic energy among scales. The results in Van Doorn et al. 13 clearly showed that in drag-reducing solution case, a smaller dissipation rate is found, and the suppression of small scales may result from an elastic absorption of energy on those scales. Vonlanthen and Monkewitz 14 found that due to the addition of polymers, the energy spectrum changes abruptly from Kolmogorov κ−5/3 inertial range to a κ−3 elastic range at time-dependent Lumley scale. Crawford et al. 15 and Ouellette et al. 16 used two counter-rotating coaxial baffled disks to realize bulk turbulence and found that the suppression of viscous dissipation modifies turbulent energy cascade.
Experimental setup and particle image velocimetry
Two-oscillating grid system
We performed all experiments in a 28 × 28 × 75-cm plexiglass tank, as shown in Figure 1, filled with the fluid. In order to realize approximate isotropic turbulence, the two oscillating grids should be kept synchronous and driven to oscillate in opposite directions using eccentric gear. The oscillating grid has a square mesh size M = 3 cm, the characteristic scale for grid d = 6 mm, and solidity σ=d/M(2 − d/M) = 0.36. The distance (Z1) between top grid and free surface is 15 cm (Z1/M > 2.5); the distance (Z0) between bottom grid and bottom wall is 35 cm (Z0/M > 2.5); at Z1/M > 2.5 and Z0/M > 2.5, there are essentially no secondary flows generated from the top/bottom of the tank during grid oscillation; the distance (H) between top grid and bottom grid is 16–18 cm (H/M > 3.0). We chose two classical drag-reducing additives with viscoelastic characteristics: polymer (polyacrylamide (PAM) with molecular weight of 1.8 × 10⁷ g/mol, produced by Shanghai Huiye ChemE Tech. Ltd, China) and cationic surfactant (cetyltrimethyl ammonium chloride (CTAC) with molecular weight of 320 g/mol, produced by Aladdin, China). In order to form the steady shear-induced structures (SISs) in CTAC solution, sodium salicylate (NaSal, with molecular weight of 160.1 g/mol) was added to the solution with the same weight concentration as that of CTAC for providing counterions. The distilled water was used as the solvent. For simplicity, hereinafter, the surfactant solution is only designed as CTAC concentration, though the same weight concentration of NaSal was always included in the CTAC solution case. The concentrations of PAM solution and CTAC solution were chosen as 25 and 50 ppm, which were always used in turbulent drag-reducing flows.6,14 The fluid temperature is 21°C ± 1°C. The oscillating amplitude is S = 2 cm, and the grid oscillating frequencies are f = 5 and 7.5 Hz in our experiments. Reynolds number was defined as ReM = 2πfSM/ν, here ν is the solvent kinematic viscosity. The viscosities for all cases are measured by a stress-controlled rotational rheometer (Kinexus Pro; Malvern Instruments, UK), as shown in Table 1. It is found that for 25 ppm CTAC solution, the viscosity is very close to that of distilled water, and for 50 ppm CTAC solution, the viscosity does not increase much, which is similar to that in Kawaguchi et al. 17 For 25 ppm PAM solution also, the viscosity does not increase much compared with that of distilled water, but for 50 ppm PAM solution, the viscosity increases much remarkably. In order to make comparison among these three cases, the viscosity of drag-reducing solution was still chosen as that of distilled water. So, in our experiments, Reynolds numbers are 1.8 × 10⁴ and 2.8 × 10⁴.
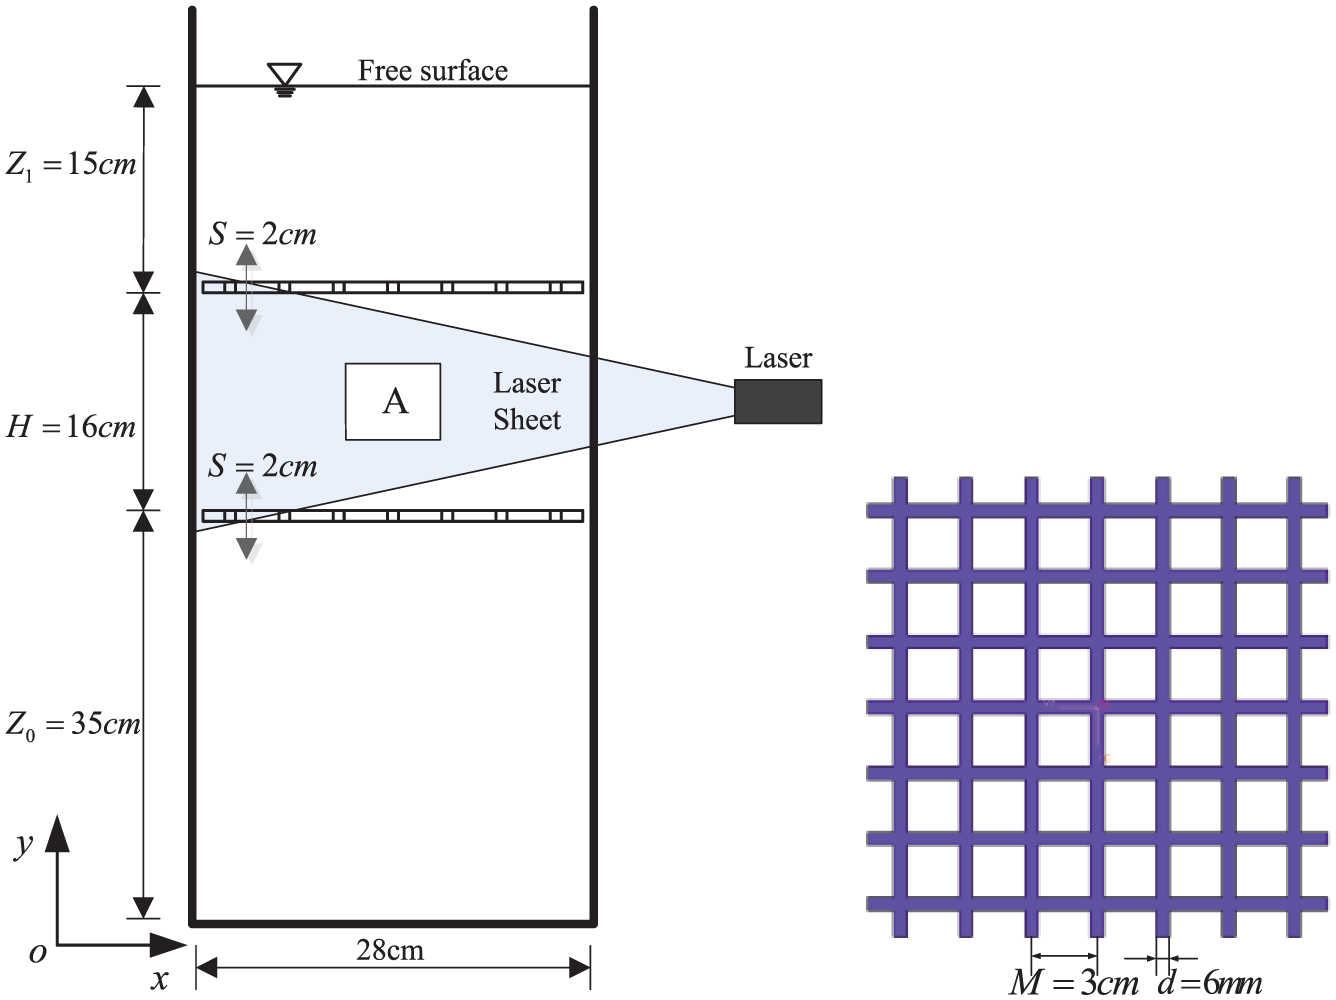
The schematic diagram of two-oscillating grid system and oscillating grid.
The averaged shear viscosity for different cases at shear rate changed from 1 to 10 s−1 and temperature 21°C.

PAM: polyacrylamide; CTAC: cetyltrimethyl ammonium chloride.
Particle image velocimetry system
All experiments were carried out based on particle image velocimetry (PIV). A standard two-dimensional (2D) two-component PIV system, including a double-pulsed laser, laser sheet optics, charge-coupled device (CCD) camera, timing circuit, image-sampling computer, and image processing software Dynamic Studio (version 3.20), was utilized to measure the velocity field in grid turbulence. Parameters of the key components of this PIV system were as follows: the double-pulsed Nd-yttrium aluminum garnet (Nd-YAG) lasers had an output of 200 mJ/pulse and maximum repetition rate of 15 Hz; the CCD camera (FlowSense 4M EO Model81C92) had a resolution of 2048 × 2048 pixels; the seeding particles were hollow glass spheres with typical diameter of the order ≤20 µm. The sufficient seeding particles were added to ensure an adequate particle image density (about 10 per interrogation volume) for a successful PIV interrogation. The PIV image covered an area of about x × y=6.6 × 6.6 cm2. The interrogation area was set to be 32 × 32 pixels (with 50% overlap in each direction) for velocity vector analyses. The spacing between adjacent vectors in each direction was around
Validation of experimental setup
First, it needs to check the reliability of experimental system. For two-oscillating grid turbulence, there exists the isotropic turbulence characteristic, which is simply defined by the flow isotropic based on
Flow isotropic for two-oscillating grid turbulence for all cases: u and v represent the velocities of x and y, respectively.

PAM: polyacrylamide; CTAC: cetyltrimethyl ammonium chloride.
Proper orthogonal decomposition
As is known, turbulent flows possess coherent structures, which are of great importance because they provide the mechanism for transportation, production, and dissipation of turbulence. Therefore, many methods are proposed to identify coherent structures for deeply studying the flow characteristics and turbulent mechanism. Actually, to accurately examine coherent structures from the multidimensional datasets, it requires the method with objective, unbiased, and statistical. The studies show that proper orthogonal decomposition (POD) is a powerful analysis tool to examine coherent structures. Now, it has been extensively used in different turbulent flows.17–20 In this section, we simply introduce the basic principle of POD. It is first proposed by Lumley
21
to define coherent structures with functions containing the spatial variables (having the maximum energy content) of flow field. In other words, from mathematical view, coherent structures can be seemed as the linear combinations of

where
By the calculation of variation, a necessary condition for

with the kernel

Actually, the solution for equation (2) is theoretically a series of eigenvalues and eigenmodes. Some prominent properties possessed are the flow
Equation (2) has a finite set of eigenmodes

where
Any member of the ensemble
The coefficients


Besides,

where E is twice the average turbulent kinetic energy. And the magnitude of the nth eigenvalue

Besides, it is easy to build the low-order model of random field by reconstruction based on the first dominant eigenmodes (usually the eigenvalues and eigenmodes are sorted in the ascending order

Results and discussion
First, we approximate the POD eigenmodes using 100, 200, 300, and 400 snapshots of fluctuating velocity (u, v) for two-oscillating grid turbulence with the Newtonian fluid at Re = 1.8 × 10⁴. Figure 2 shows the relative contribution of single POD eigenmode under different eigenmodes. The results show that (1) the first eigenmodes contain turbulent kinetic energy much more owing to represent large-scale structures, for example, the first eigenmode captures around 30% turbulent kinetic energy; (2) high-order eigenmodes represent small-scale structures, and the distribution of turbulent kinetic energy on these structures is little and uniform, for example, the 10th eigenmode only captures around 1% turbulent kinetic energy. If fewer snapshots (100 or 200 snapshots) are chosen, it will result in the unreasonable distribution of turbulent kinetic energy on the first eigenmodes (such as the first 10 eigenmodes) so that it is difficult to reflect the original flow characteristics based on these eigenmodes. However, when 300 or 400 snapshots are chosen, the distribution of turbulent kinetic energy is proximal in both two cases for the first eigenmodes. Therefore, in order to accurately represent the original flow, it is reasonable to use 400 snapshots (i.e. 400 POD eigenmodes) for analyzing the characteristics of coherent structures in this article.

Relative contribution of the single POD eigenmode for the first 10 eigenmodes for the Newtonian fluid case at Re = 1.8 × 10⁴.
POD energy spectrum and eigenvalues
We investigate the POD energy spectrum as shown in Figure 3, which means the cumulative contribution of POD eigenmodes. It can be clearly seen that for 25 ppm CTAC solution case, the main energy is distributed onto a large number of eigenmodes, which is similar to that for the Newtonian fluid case, but for 25 ppm PAM solution case, the main energy is only distributed onto the first eigenmodes. It is suggested that the flow between 25 ppm PAM solution case and 25 ppm CTAC solution case should be different. However, as CTAC solution concentration increases up to 50 ppm, the CTAC solution case needs less POD eigenmodes to capture the main energy, which is similar to 50 ppm PAM solution case. POD energy spectrum can be used to represent the flow complexity, that is, the broad POD energy spectrum means that the flow field cannot be well described by only a few spatially distributed structures. Therefore, the broad POD energy spectrum of the Newtonian fluid flow means the flow is more complex than that in PAM solution flow; in 25 ppm CTAC solution case, the flow is more complex than that in 25 ppm PAM solution case, but the flow in 50 ppm CTAC solution case shows similar trend to that in 50 ppm PAM solution case. This phenomenon can be also clearly seen from Figure 4.

Accumulative contribution versus numbers of POD eigenmodes for the Newtonian fluid case, PAM solution case, and CTAC solution case at Re = 2.8 × 10⁴.

Instantaneous velocity vector field for (a) the Newtonian fluid case, (b) 25 ppm PAM solution case, (c) 50 ppm PAM solution case, (d) 25 ppm CTAC solution case, and (e) 50 ppm CTAC solution case at Re = 2.8 × 10⁴.
Based on POD principle, the average amount of turbulent kinetic energy onto the projection of
The accumulative POD energy of different POD eigenmodes for the Newtonian fluid case, PAM solution case, and CTAC solution case at Re = 1.8 × 10⁴ and 2.8 × 10⁴.

POD: proper orthogonal decomposition; PAM: polyacrylamide; CTAC: cetyltrimethyl ammonium chloride.
In total, 90% of total energy for all cases are shown in boldface.
In order to investigate the viscoelastic effect more deeply, the turbulent kinetic energy (

Statistical results of turbulent kinetic energy at three different grid oscillating frequencies for all cases: (a) the Newtonian fluid case versus PAM solution case and (b) the Newtonian fluid case versus CTAC solution case.
POD eigenmodes
In POD, the fluctuation field will be decomposed onto many basic spatial structures depicted by eigenmodes which are unchanged over time. Therefore, these POD structures are very important for POD analysis; furthermore, it is easier to study eigenmodes instead of studying the whole velocity field to obtain turbulent characteristics. Figures 6–10 show the basic spatial structures depicted by the first eigenmodes and the high-order eigenmode for the Newtonian fluid case, PAM solution case, and CTAC solution case at Re = 2.8 × 10⁴, respectively.
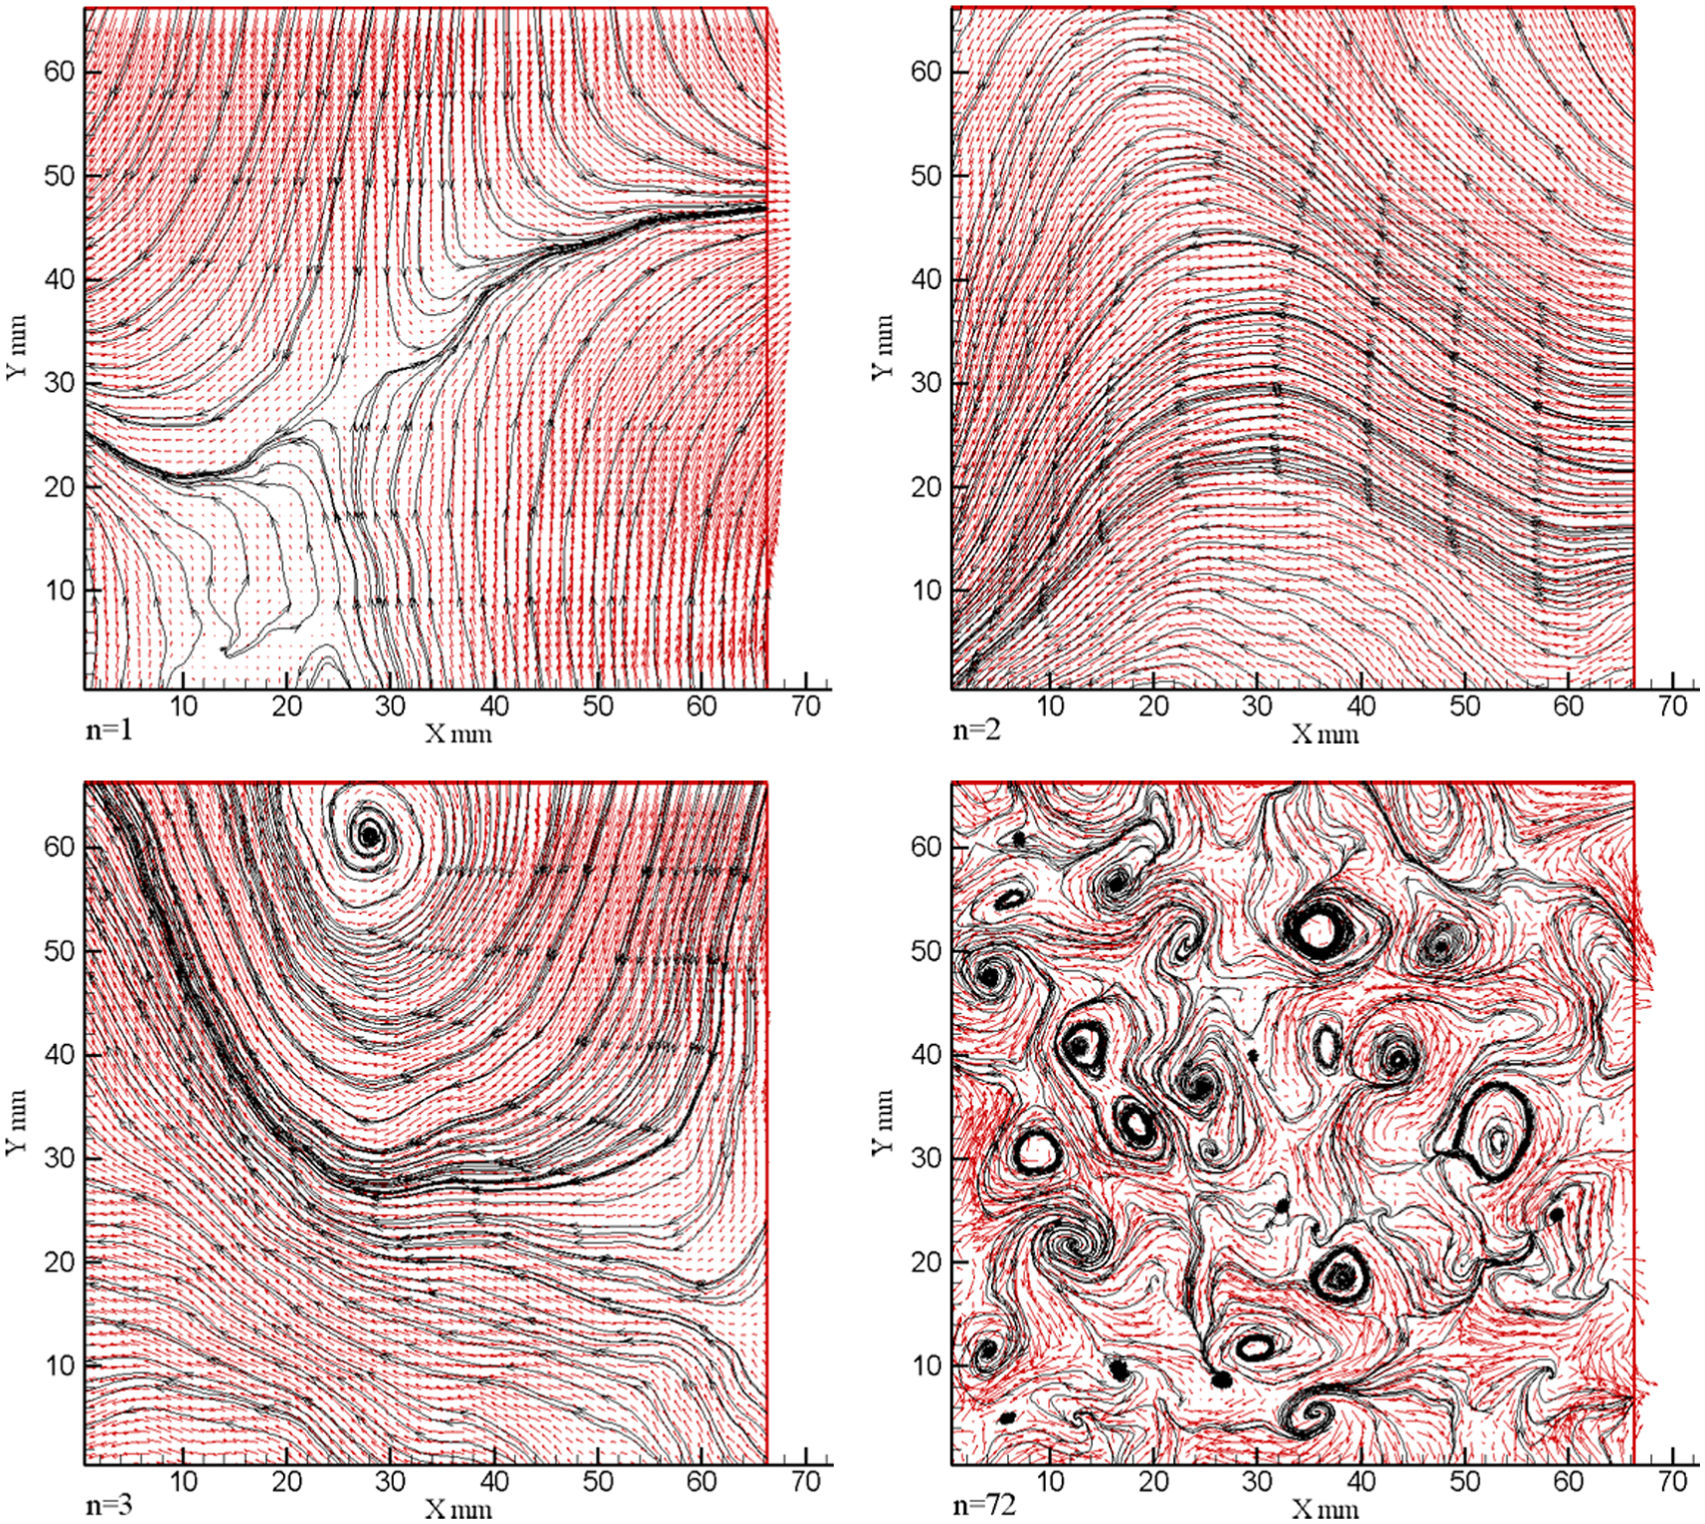
The single POD eigenmode in the Newtonian fluid case at Re = 2.8 × 10⁴.

The single POD eigenmode in 25 ppm PAM solution flow at Re = 2.8 × 10⁴.

The single POD eigenmode in 50 ppm PAM solution flow at Re = 2.8 × 10⁴.

The single POD eigenmode in 25 ppm CTAC solution flow at Re = 2.8 × 10⁴.

The single POD eigenmode in 50 ppm CTAC solution flow at Re = 2.8 × 10⁴.
From Figure 6, it is evident that the dominant energy containing structures are represented by the first leading eigenmodes (such as the first three eigenmodes). Meanwhile, the spatial structures behave in an increasingly complex way and their spatial scale decreases for the posterior eigenmodes (such as the 72nd eigenmode). Also, the first eigenmodes capture large-scale structures in 25 ppm PAM solution case, as shown in Figure 7 and the high-order eigenmodes capture small-scale structures, which are larger than those in the Newtonian fluid case. It is suggested that small-scale structures are inhibited in 25 ppm PAM solution case. Also, this phenomenon appears in 50 ppm PAM solution case, as shown in Figure 8. But for 25 ppm CTAC solution case, the results in Figure 9 are similar to those for the Newtonian fluid case and are different from those for 25 ppm PAM solution case especially at the high-order eigenmode representing small-scale structures. However, when CTAC solution concentration is 50 ppm, the flow behavior (as shown in Figure 10) is quite different from that in 25 ppm CTAC solution case. To capture the same amount (0.2%) of turbulent kinetic energy, the 72nd, 28th, 27th, 66th, and 29th eigenmodes are needed for the Newtonian fluid case, 25 ppm and 50 ppm PAM solution cases, and 25 ppm and 50 ppm CTAC solution cases, respectively. This suggests again that the distribution of turbulent kinetic energy is broader in 25 ppm CTAC solution case, that is to say, the flow behavior is quite different between PAM solution case and CTAC solution case, as shown in Figure 4.
Therefore, from the above analysis, it is suggested that there exists the critical concentration to show viscoelastic effect for CTAC solution case. This phenomenon is different from that in channel flow with 25 ppm CTAC solution, 6 where there exists the remarkable drag-reducing effect. This is due to the fact that it is difficult to form SIS in so low-concentration case without wall effect. However, for PAM solution case, it is much easier to damp small-scale vortex structures through the stretching of long-chain molecular structures. That is to say, the interaction mechanism between PAM/CTAC additives and turbulent structures is different. Finally, it should be pointed out that due to the addition of viscoelastic additives, the solution viscosity should be increased (as shown in Table 1), especially for large concentration solution cases, such as 50 ppm PAM solution case. The above phenomenon about the inhibition effect of coherent structures caused by drag-reducing additives is the result of the combined effect of viscosity and elasticity.
Conclusion
In this article, we investigate the viscoelastic effect on two-oscillating grid turbulence without wall effect based on PIV data combining POD method. The contents mainly focus on POD energy spectrum, eigenvalues, and eigenmodes. Some important conclusions are drawn as follows:
Through the comparison of POD energy spectrum, for 25 ppm CTAC solution case, it has broader spectrum than that in 25 ppm PAM solution case. It suggests that the flow in 25 ppm CTAC solution case is more complex. For 50 ppm CTAC solution case, it has the similar POD spectrum to that in 50 ppm PAM solution case.
The number of eigenmodes required to coherent structures for 25 ppm PAM solution case is far less than that for 25 ppm CTAC solution case. This reflects that PAM additives can result in turbulence suppression effect but not remarkably caused by CTAC additives. However, as CTAC solution concentration increases up to 50 ppm, the CTAC solution case shows similar trend to that for PAM solution case in this study.
Through the above analysis of POD, instantaneous velocity field, and turbulent kinetic energy, it is found that there exists the critical concentration for CTAC solution to show turbulent suppression effect and the mechanism between PAM solution case and CTAC solution case are different.
Footnotes
Acknowledgements
The authors are very grateful to the enthusiastic help of all members of Complex Flow and Heat Transfer Laboratory of Harbin Institute of Technology.
Academic Editor: Pietro Scandura
Declaration of conflicting interests
The author(s) declared no potential conflicts of interest with respect to the research, authorship, and/or publication of this article.
Funding
The author(s) disclosed receipt of the following financial support for the research, authorship, and/or publication of this article: This work was supported by the National Natural Science Foundation of China (grant nos 51206033 and 51576051).