
Abstract
Fatigue assessment of fixed offshore platforms is essentially important to ensure their structural safety. Because of the small-scale leg diameter, these structures are often drag dominated, and linearized wave force is often utilized for the fatigue estimation. To evaluate the influence of nonlinear effect on fatigue damage, the nonlinear drag force is directly incorporated into the computation of the wave force spectrum based on autocorrelation function. The features and the contributions of nonlinear wave force are first investigated in the frequency domain. Then, structural fatigue damage associated with the linear and nonlinear wave forces is compared using a time-domain fatigue assessment method. Investigation indicates that the influence of nonlinear drag force is closely related to the characteristic diameter of the structure. The nonlinear drag force can contribute up to 10% of the total wave force and lead to about 10% structural fatigue life reduction when the characteristic diameter is small.
Introduction
The offshore structures are designed to resist continual wave loading which may lead to significant fatigue damage on individual structural member, even though those applied loading may be below the structure resistance capacity.1,2 The fatigue damage has become a major cause of damages occurred on the offshore structures. Therefore, it is of vital importance to conduct fatigue assessment study for offshore structures.
To estimate the structural fatigue damage, there are two approaches available. One of them is the fracture mechanics approach based on Paris crack propagation criterion, which is usually applied to predict the propagation life from initial crack or defect. 3 Another one is the traditional fatigue curve (S–N curve) method on the basis of Palmgren–Miner (P-M) linear damage hypothesis (the method used in this article) which is intended for application at the design stage. Due to the difference in the theoretical basis, the latter approach can be divided into three categories, namely, deterministic method, frequency-domain method (spectra based method), and time-domain method, respectively. 4 For the deterministic method, the random wave process is represented by the regular wave with a deterministic wave height and period and neglects the stochastic characteristic of the sea waves. 5 Therefore, the structural fatigue damage may be underestimated in a large extent with this method which is not appreciated in offshore engineering.
For the frequency-domain method, the stress or strain response is assumed to be a narrow band stationary Gaussian stochastic process which is described in the frequency domain in terms of its power spectral density (PSD), 6 and the structural fatigue damage can theoretically be predicted by Rayleigh stress range distribution which seems quicker and easier to apply even at the design stage. 7 However, the stress response of offshore structure is broadband spectrum in practice due to the different dynamic loading characteristics and may be a non-Gaussian random process in some cases. 8 In the case of broadband response, the structural fatigue damage would be overestimated if the Rayleigh distribution assumption is still adopted. 9 To predict fatigue damage of broadband spectrum by both theoretical and empirical approaches, a series of fatigue damage models have been developed. A correction factor between narrow band spectrum and broadband spectrum was introduced in Wirsching and Light 10 model and Benasciutti and Tovo 11 model to reduce the conservatism due to the narrow band assumption. The approximate rain-flow counting distribution was developed by Dirlik, 12 Zhao and Baker, 13 and Park and Song 7 for broadband spectrum, respectively. Several other models were also proposed to deal with the bimodal broadband spectrum.14–17 Furthermore, some bimodal spectrum models were expanded to the trimodal spectrum models by Gao and Moan 9 and Low, 18 respectively. However, there are still many limitations for the multimodal spectrum model to accurately estimate the fatigue damage.
Certainly, if accuracy is all that is desired, one may always resort to time-domain simulation, followed by rain-flow counting method. 19 For time-domain fatigue assessment method, the coupled dynamic analysis is conducted to obtain the structural stress response. Therefore, this method is able to consider the effect of nonlinearity adequately in the procedure of fatigue assessment. The accuracy of this approach usually makes it as a benchmark against other fatigue assessment methods. 4 However, the procedure of coupled analysis is rather complicated, and it must be repeated many times to make sure every sea state in the wave scatter diagram is included. Therefore, it is very time-consuming. To improve the efficiency of the time-domain method, a common practice, as recommended by design code, is lumping of sea states into blocks. 20 Many research papers have proved that wave parameters of the equivalent sea state can be determined based on the averaging of wave frequency/period principle21,22 or the formula of the wave height and fatigue curve parameter1,23,24 or the fatigue damage equivalent principle, 25 and sometimes, the equivalent sea state is just one sea state in the lumping block which can contribute larger fatigue damage than the original sea states in the lumping block.20,26
The jacket offshore platform, which is commonly used in shallow water for oil and gas production, is fabricated from tubular steel members. An important factor influencing the structural fatigue assessment is the random wave load. For the small-scale structure, Morison equation, composed of inertial and drag components, is often adopted to calculate the wave force. Especially, in the case that the wavelength is much larger than the characteristic diameter of structure, the in-line wave forces are dominated by the nonlinear drag forces. For simplicity, the Morison equation is often linearized to calculate the linearized wave force or PSD in the procedure of dynamic analysis and fatigue assessment. Sigbjörnsson and Mörch 27 were the first one who introduced the nonlinear drag force into the wave force PSD. Their research showed that the wave force PSD was a bimodal spectrum after taking the nonlinear drag force into consideration, and the nonlinear drag force contributed a large proportion to total wave force when drag force was dominated. However, the influence of nonlinear drag force on small-scale structural fatigue damage was not investigated in the research paper, and this will be the main objective of this article. Jia 1 investigated the influence of hydrodynamic coefficient from different versions of the Norsok Standard on the structural fatigue damage of a jacket platform. In addition, the influence of the bottom support conditions of the jacket structure on the fatigue life was also investigated.
From the literature review, there are few publications on the influence of nonlinear drag force on the fatigue assessment, to the author’s knowledge. The objective of this article is to investigate the influence of nonlinear drag force on the fatigue damage of small-scale structures. The nonlinear drag force is directly incorporated into the computation of the wave force spectrum based on the autocorrelation function. Then, the linear and nonlinear wave force spectra are transformed into wave force time series to conduct dynamic analysis, and the structural fatigue damage under the linear and nonlinear wave forces is investigated and compared using the time-domain fatigue assessment method. In this article, to have a good understanding of the influence of nonlinear drag force, the parameters related to wave force contribution ratio and fatigue life difference are introduced to quantify the contribution of nonlinear drag force on the total wave force and the total fatigue damage. To the end, this article is arranged as follows: in section “Theoretical background of time-domain fatigue assessment,” theoretical background of time-domain fatigue assessment is introduced briefly. In section “Derivation of the nonlinear wave force,” the linear and nonlinear wave force spectra are derived based on wave force autocorrelation function. In section “Numerical study,” the mono-pile platform is demonstrated in the numerical example. The contribution and the influence of nonlinear drag force on total wave force and structural fatigue damage are investigated and compared, respectively. Finally, the conclusions drawn from this work are presented in section “Conclusion.” The nomenclature used in this article is listed in Table 1.
The nomenclature.
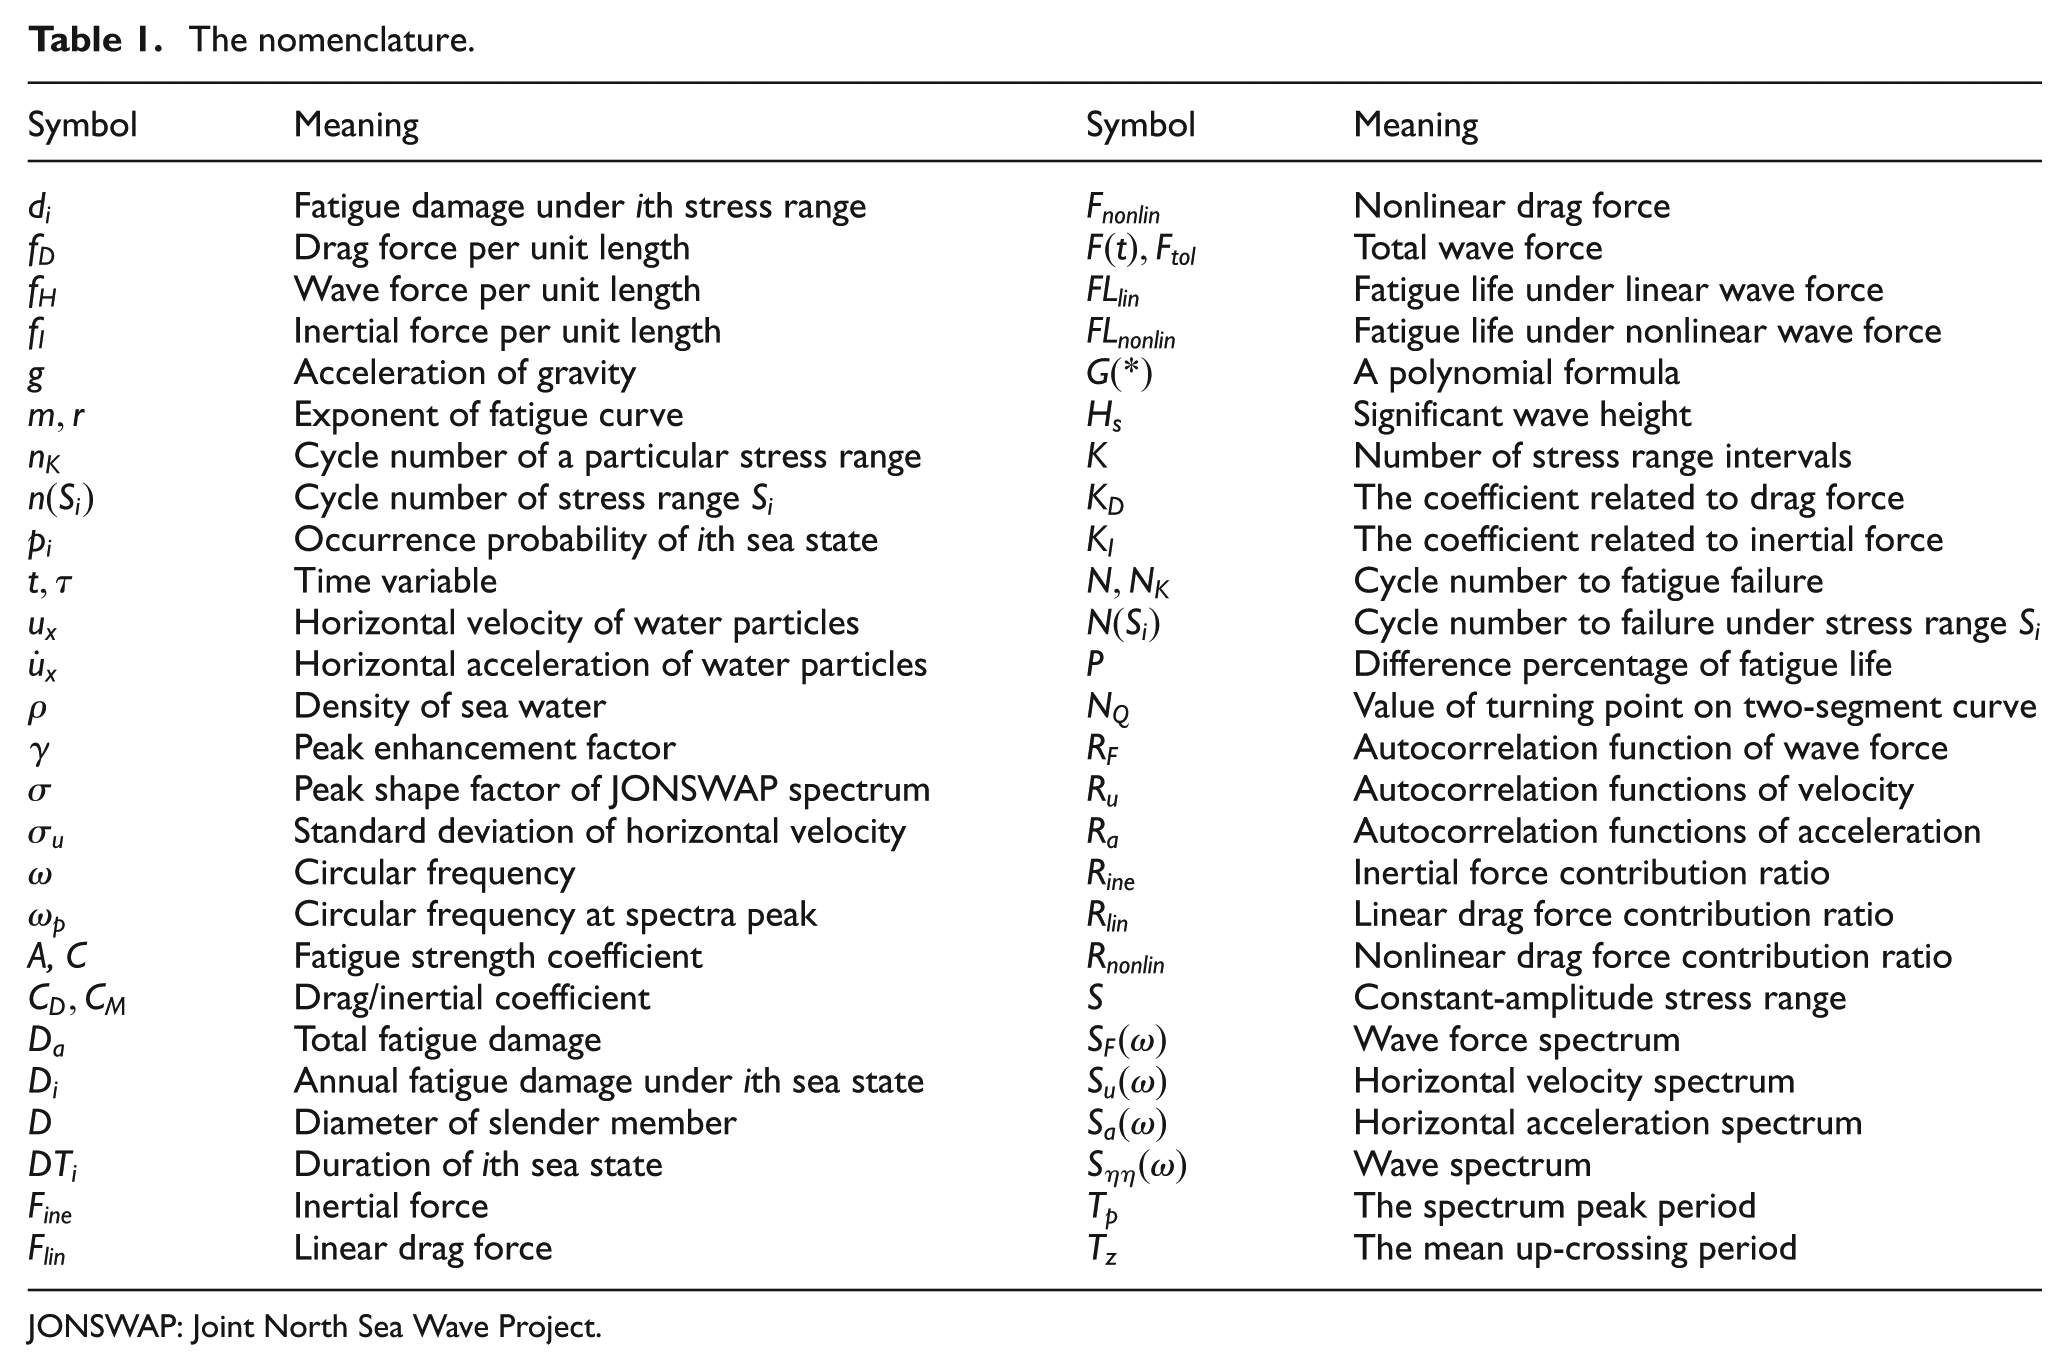
JONSWAP: Joint North Sea Wave Project.
Theoretical background of time-domain fatigue assessment
In this section, the preliminaries used in the time-domain fatigue assessment are summarized briefly.
S–N curve
The S–N curve is the relationship between the constant-amplitude stress range S and the number of cycles to failure N, which is the foundation of fatigue assessment methods. It can be represented as

where A and m are the fatigue strength coefficient and exponent, respectively, which can be determined from fatigue tests. The value of these parameters may be different in different design codes. In the following study, a two-segment S–N curve recommended by American Bureau of Shipping (ABS) code
28
is adopted. When the number of cycles to failure, N, is less than

where C and r are again determined from the fatigue test.
P-M linear damage hypothesis
Having defined the relation between stress range and number of stress cycles to failure as presented above, a damage accumulation rule must be adopted to predict the cumulative damage under different stress ranges. For this purpose, the P-M rule is commonly used in practice. This rule assumes a linear fatigue damage accumulation for different stress ranges. It is stated for a number of constant-amplitude stress blocks as written by

where K is the number of considered stress range intervals,
Rain-flow counting method
In order to calculate the fatigue damage based on the P-M rule, the stress range and cycle number should be first obtained. Some of the cycle counting methods in use today for fatigue analysis are peak, level crossing, range, range mean, range pair, and rain-flow counting method.
Rain-flow counting method was initially proposed by Matsuishi and Endo 19 to count the cycles or the half cycles of strain–time signals. A new equivalent definition was given by Rychlik 29 which is more convenient for statistical analysis. The rain-flow cycle counting technique was carried out on the basis of the stress–strain behavior of the material and was found to be the best method for fatigue damage estimation.
Time-domain procedure for fatigue assessment
To investigate the influence of nonlinear drag force on structural fatigue damage, a calculation procedure incorporating the nonlinear wave force acted on offshore structures is designed and illustrated based on the time-domain fatigue assessment method. For simplicity, only the contribution of wave is considered, and the influence from wind and current is not included in this study. 30 As shown in Figure 1, the nonlinear wave force PSD is first computed and then transformed from frequency domain to time domain for calculating the random wave force. After the random nonlinear wave force is obtained, the stress responses could be directly calculated by conducting the structural dynamic analysis. Rain-flow counting algorithm is adopted to count the stress ranges and the corresponding cycle numbers. The structural fatigue damage is estimated based on the definition of the P-M rule and the applicable S–N curve.

Flowchart of time-domain fatigue assessment method.
The annual fatigue damage

where

Derivation of the nonlinear wave force
For small-scale structure, Morison equation 31 is often used to compute the wave force. Morison equation is the sum of two force components: an inertial force in phase with the local flow acceleration and a drag force proportional to the square of the instantaneous flow velocity

where
As can be seen from equation (6), the drag force component in Morison equation has the quadratic component of velocity, which is a nonlinear form. For traditional fatigue assessment, a linearized wave force spectrum is commonly used for spectral method, which neglects the higher nonlinear effect of drag force component. In order to investigate the influence of nonlinear effects, the nonlinear wave force spectrum is derived and incorporated in the fatigue assessment.
For the clarity of the following formulation, equation (6) is rewritten as

where

If the random wave elevation is regarded as a normal process, the horizontal velocity

where
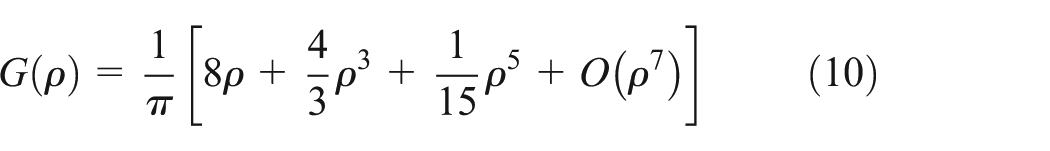
If only the first term in equation (10) on the right-hand side is selected, equation (9) can be simplified into the following equation

This is a kind of equivalently linearized processing. Conducting Fourier transform on equation (11), the PSD function of the random wave force can be acquired, which is a linearized wave force spectrum equation

where

Similarly, conducting the Fourier transform on equation (13), the nonlinear expression of PSD function of the random wave force can be expressed as

In the above equation, “*” means convolution.
Numerical study
To investigate the influence of nonlinear effect of wave force on the fatigue assessment, a fixed mono-pile platform structure is demonstrated in the numerical example. This type of structure is usually utilized as production platform in the marginal oil field or as supporting structure of offshore wind turbine at moderate water depth, which presents significant advantages with respect to costs and safety. In addition, the wave force calculation and dynamic structural analysis can be conducted easily, and the new method can be verified reliably, for example, Du et al. 4 took advantage of the mono-pile platform to verify the effectiveness of the novel hybrid frequency–time-domain method.
Finite element model
The prototype mono-pile platform adopted in this study is a typical jacket structure located in Bohai Bay. The structure comprises both the topside and the jacket with a single leg as shown in Figure 2. The height of the jacket is 30 m with a water depth of 20 m. For simplicity, 36 equal Euler–Bernoulli beam elements are used to simulate both the jacket and the pile. A concentrated mass is modeled on the topside to represent the weight of the equipment and other nonstructural installation, and the structure is fully fixed at a location six times the diameter of the pile, which is 6 m beneath the mudline. 33 The structure is modeled with steel as the material with Young’s modulus of 210 GPa, Poisson ratio of 0.3, and the density of 7850 kg/m3. In general, the most important contribution to the fatigue damage comes from small-to-moderate sea states. For these sea states, one assumes that the characteristic of the material is in a linear range. The finite element model of the mono-pile platform is illustrated in Figure 2, and structural fatigue damage occurred at the mudline is studied with this model.
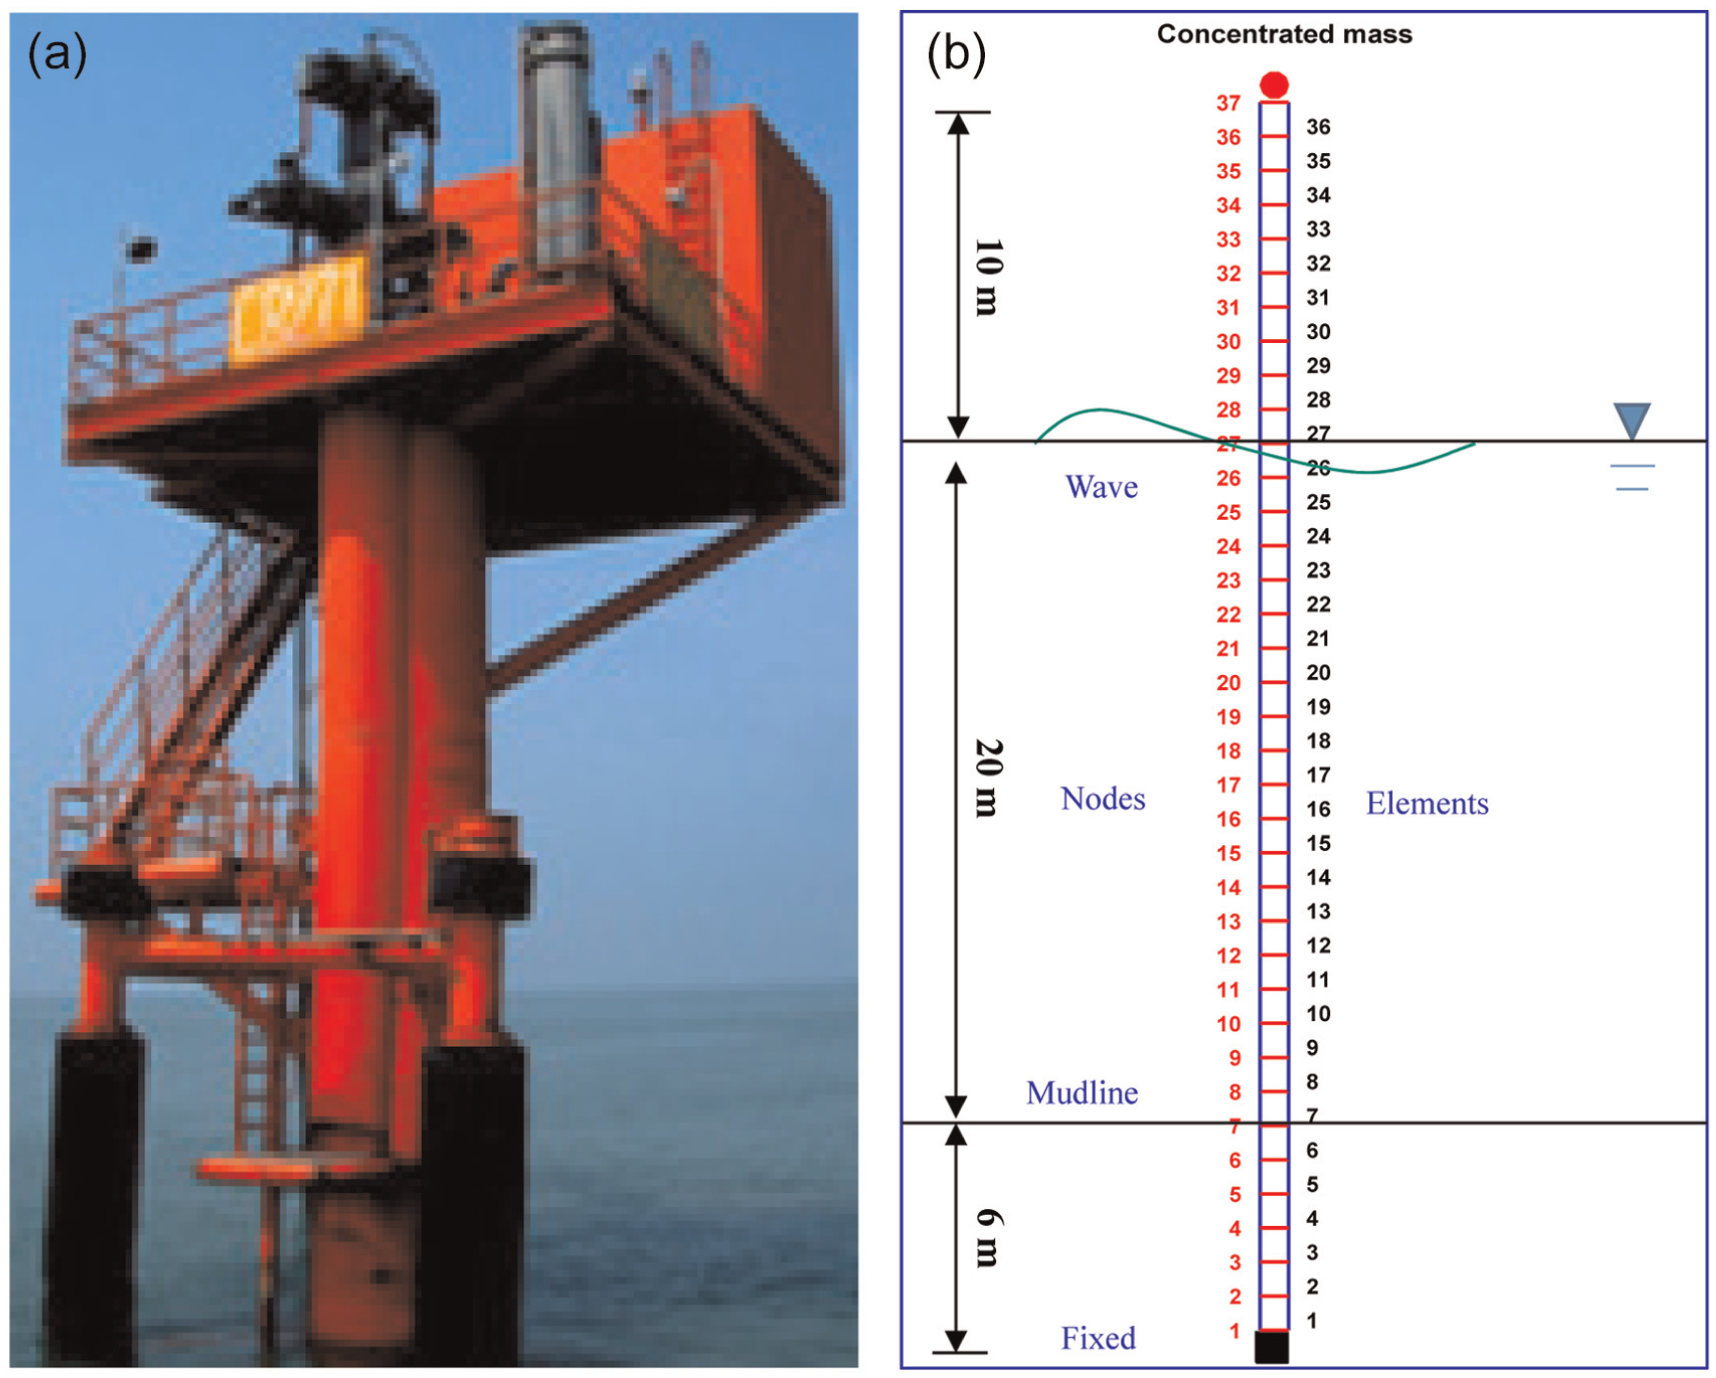
View of (a) the mono-pile platform and (b) its finite element model.
To investigate the contribution of nonlinear drag force on total wave force, and further study the influence of nonlinear drag force on fatigue damage, a series of mono-pile platforms with different diameters are adopted in the following numerical simulation. To ensure the fundamental frequencies are similar among those mono-pile platforms, different thicknesses together with the concentration mass are selected, as listed in Table 2.
The parameters of mono-pile platforms.

Sea states
In this study, a wave scatter diagram is adopted to represent the long-term wave condition in the structure working sea, and the joint occurrence probability of significant wave height Hs and mean up-crossing period Tz are illustrated in Table 3.
Sea states of the Bohai Bay (%).

Every short-term sea states in the diagram is assumed as a stationary Gaussian stochastic process, and its energy distribution can be characterized by wave spectrum

where


The relationship between the peak period

Study of nonlinear wave force effect
The contribution of the nonlinear drag force is first investigated in terms of PSD using a series of mono-piles (Table 2). To visualize and quantify the significance of the nonlinear drag forces represented by the threefold convolution (see equation (14)), an extreme sea state (Hs = 6.75 m, Tz = 9.0 s) in the scatter diagram is selected. The corresponding wave spectrum which owns the spectrum peak frequency of 0.51 rad/s is illustrated in Figure 3.

Wave spectrum with Hs = 6.75 m and Tz = 9.0 s.
Based on equations (12) and (14), the linear and nonlinear wave force PSDs are calculated for platforms with different diameters. Two extreme cases, that is, D = 1.0 m and D = 3.0 m, are selected for demonstration. In the first case, whose diameter is 1.0 m, the wave force PSDs at various water depths are shown in Figure 4. From this figure, one can see that the nonlinear wave force PSD is a bimodal spectrum, and the primary spectrum peak frequency is about 0.51 rad/s which is equal to the input wave spectrum. While the secondary spectrum peak frequency is 1.57 rad/s which is about three times of the first one, therefore, we deduce that the secondary spectrum peak is caused by threefold convolutions of the nonlinear drag force. In addition, there are two features worthy of attention in this figure. First, it is notable that the nonlinear wave force PSD does not approach zero when the frequency approaches zeros as does the linear wave force PSD. This is because that the threefold convolution of velocity PSD can produce another two velocity PSDs around the original one, and these three PSDs are superimposed together to form a new PSD which owns one primary peak and two secondary peaks. In Figure 4, only two spectrum peaks are found. The first one is the primary peak with a frequency of 0.51 rad/s, and another one is the secondary peak located at the right side of the primary one with a frequency of 1.57 rad/s. There should be another secondary peak located at the left side of the primary peak with a frequency of −1.06 rad/s, but this part of velocity PSD is truncated by the ordinate axis, and the intercept is a nonzero value. Second, it is seen that the amplitude of secondary peak is closely related to the depth, and secondary peak is almost not visible close to the free water surface due to the fact that the linear contribution of the drag forces overshadows the convolution contribution. In this article, the depth is measured positive downward from the still water level.

PSD of wave force acting on a platform with D = 1.0 m.
For the second case, whose diameter is equal to 3.0 m, the PSDs of wave force at various water depths are shown in Figure 5.

PSD of wave force acting on a platform with D = 3.0 m.
As can be seen from Figure 5, the wave PSDs also have a secondary peak, and as the depth increases, the secondary peak becomes more obvious, similar to Figure 4. When the frequency approaches zero, the nonlinear wave force PSDs do not approach zeros, and the first peak occurs at the 0.51 rad/s, and the secondary peak occurs at 1.57 rad/s, which is identical to Figure 4. However, after a careful comparison between Figures 4 and 5, one can find the differences. First of all, the amplitudes of the wave force PSDs acting on the cylinder with 3.0 m diameter are much larger than those of 1.0 m. Next, the secondary peak becomes invisible at 6 m depth when the diameter increases from 1.0 to 3.0 m. In other words, the nonlinear effect caused by threefold convolution becomes smaller as the diameter increases. Finally, the differences between the linear wave force PSDs and nonlinear wave force PSDs are gradually disappeared when the diameter becomes larger. Taking the location which is located 6 m below the still water level, for example, when the diameter is equal to 1.0 m, the difference between the linear and nonlinear wave force PSDs is obvious among the frequency range from 1.4 to 2.0 rad/s. However, the difference is smaller between them at the same frequency range when the diameter increases to 3.0 m.
To fully understand the contribution of the nonlinear drag force, the total wave force is divided into three components according to equation (14), namely, the inertial force, linear drag force, and nonlinear drag force, respectively. The three parameters are introduced to represent the contribution ratios of inertial force and linear and nonlinear drag forces to the total wave force and defined as follows


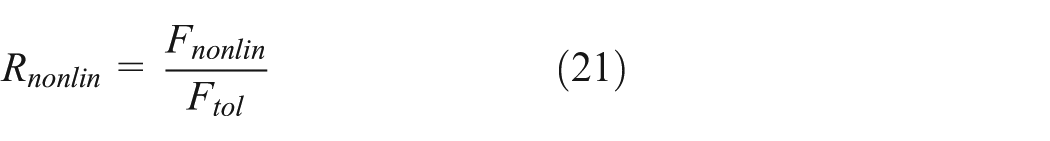
where

Contribution ratios of (a) inertial force and (b) linear and (c) nonlinear drag forces.
In Figure 6, the top, middle, and bottom panels are the inertial contribution ratio, linear drag force contribution ratio, and the nonlinear drag force contribution ratio, respectively. From this figure, one can see that the contribution ratios of different wave force components are effected by wave height, wave period, and diameter of platform. On one hand, as the wave height/period increases, the contribution ratio of the inertial force decreases, while the contribution ratios of the linear and nonlinear drag forces increase. Unlike the linear drag force which is only sensitive to wave height, the nonlinear drag force is not only sensitive to wave height but also sensitive to wave period. On the other hand, the contribution ratios of inertial force increase quickly as platform’s diameter increases, and the contribution ratios of linear and nonlinear drag forces have a complete reverse trend. At the same time, the difference caused by the wave height or wave period becomes gradually negligible as the cylinder’s diameter increases. This is because the wave force components have relationship with the ratio of cylinder’s diameter to wavelength. When the diameter is small, such as D = 1.0 m, this figure shows that the nonlinear contribution due to the threefold convolution in equation (14) is clearly significant. Under such condition, the inertial forces contribute approximately 59% to the total horizontal wave force, while the linear and nonlinear drag forces yield 30% and 11%, respectively. When the cylinder diameter becomes large, such as D = 3.0 m, it is seen that both the linear and nonlinear drag forces are of barely significant. Under this case, the inertial forces contribute approximately 94.4% to the total horizontal wave force, while the linear and nonlinear drag forces yield only 5.4% and 0.2%, respectively, which can be ignored. Therefore, one can conclude that the nonlinear drag force is closely related to the characteristic diameter of the structure, and its contribution is significant when the structural diameter is small.
Fatigue assessment
In this subsection, nine mono-pile platforms with different diameters are selected to investigate the influence of the nonlinear drag force on the fatigue damages, as listed in Table 2.
The time-domain method is adopted to calculate structural fatigue damage. The linear and nonlinear wave force PSDs can be transformed into time histories by means of the fast Fourier transformation technique. 4 The duration of the random wave force in this simulation is equal to 3 h for each sea state. A typical segment of the linear and nonlinear wave forces associated with the linear and nonlinear wave force PSDs are shown in Figure 7.

A segment of linear and nonlinear time histories of wave force.
From this figure, one can see that the difference between the linear and nonlinear wave forces is not significant when the wave force crosses the zero level. However, there exist obvious difference between the linear and nonlinear wave forces at the crests and troughs, and the wave force amplitude associated with nonlinear wave force PSD is larger than the linear one. Furthermore, some secondary peaks appear near the crests and troughs which may make a difference in structural stress response between the linear and nonlinear wave forces.
To investigate the effect of nonlinear drag force on the fatigue assessment, the structural dynamic response analysis is conducted by means of Newmark-beta method to obtain the stress time history. Figure 8 shows a typical segment of the stress response time history associated with the linear and nonlinear wave forces.

A segment of stress time history associated with linear and nonlinear wave forces.
From Figure 8, one can find that the major differences of the stress response associated with linear and nonlinear wave forces also occurred at the crests and troughs. Furthermore, the stress amplitude associated with nonlinear wave force PSD is larger than the linear counterpart. When rain-flow counting method is used to process these stress responses, those differences may produce extra stress ranges and cycles and, in turn, cause larger fatigue damage. Therefore, the fatigue life will decrease when nonlinear drag force is taken into consideration.
Mono-pile platforms’ fatigue lives are calculated based on the definition of the P-M cumulative damage rule and the applicable S–N curve. The fatigue lives for different platforms under linear and nonlinear wave forces and their corresponding discrepancies in percentage are illustrated in Figure 9.
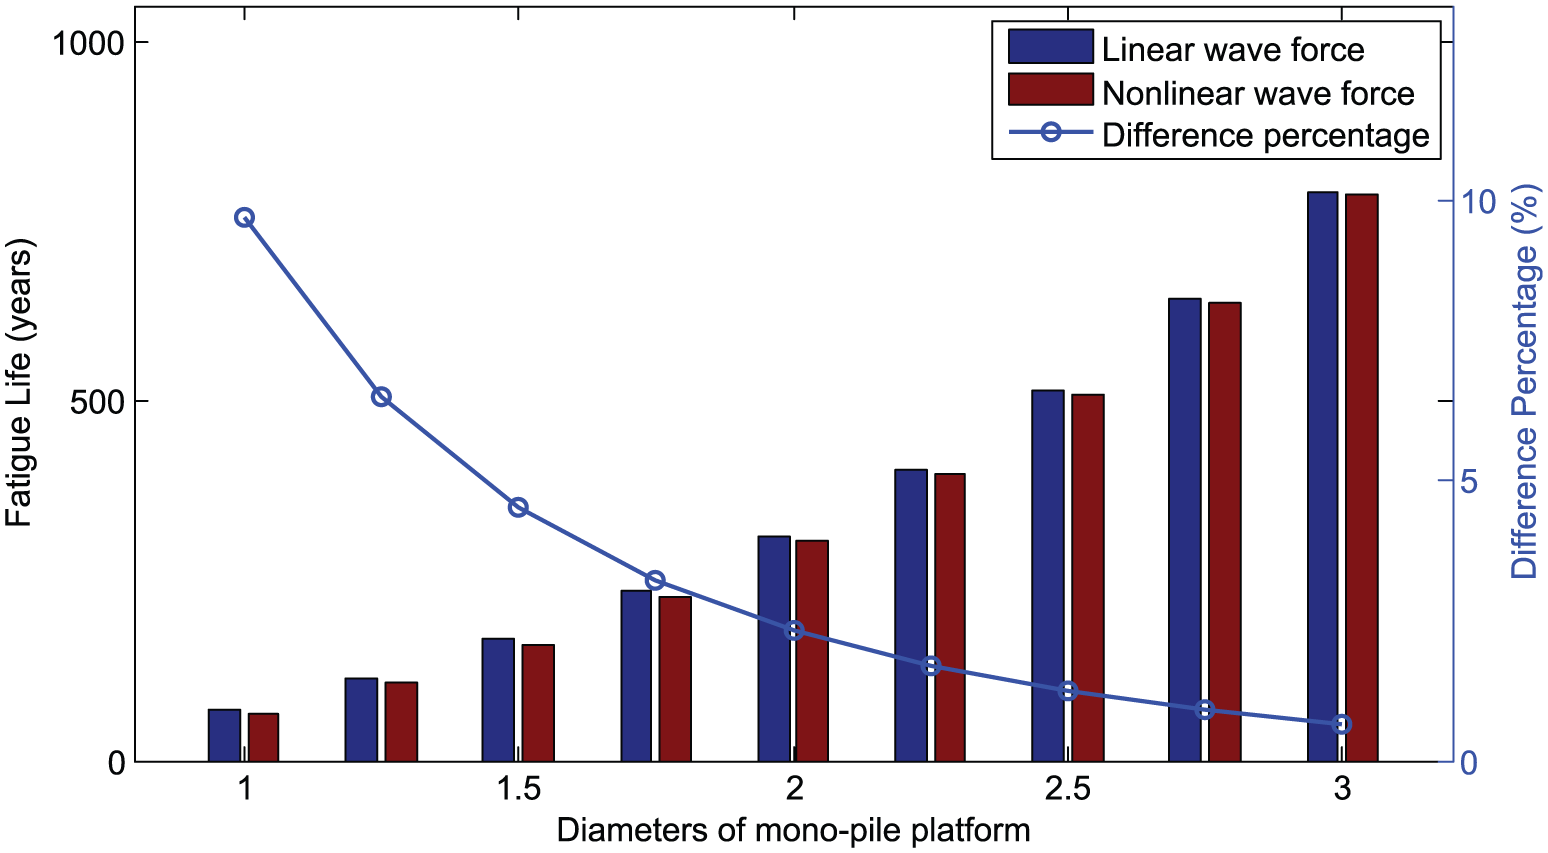
Fatigue lives of mono-pile platforms based on the linear and nonlinear wave forces.
In Figure 9, the blue bar represents the fatigue lives induced by the linear wave force, and the red bar is the fatigue lives resulted from nonlinear wave force. The difference in fatigue lives in percentage between the linear and nonlinear wave forces is denoted by a blue line, and it has the following definition
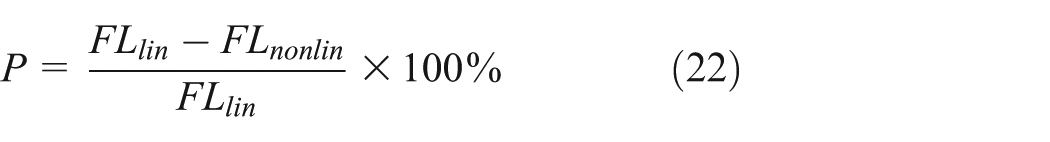
where P is the difference percentage of fatigue life,
As can be seen from this figure, the fatigue life of mono-pile platform increases as structure’s diameter increases. If the nonlinear drag force component is involved in the computation, structural fatigue lives will reduce in different levels. When the diameter is small, such as D = 1.0 m, the structural fatigue life will decrease from 71 to 64 years after considering the effect of nonlinear drag force, and it contributes about 10% reduction to the total fatigue life. As the diameter increases to 2.0 m, the structural fatigue damage will decrease from 313 to 305 years with a 2.4% difference percentage. For the extreme case, such as D = 3.0 m, the fatigue life associated with linear drag force is 792 years, and the fatigue life associated with nonlinear drag force is 786 years. The difference percentage is no more than 1% and can be ignored. Therefore, one can conclude that the influence of nonlinear drag force on structural fatigue damage is closely related to the structural characteristic diameter, and the contribution of nonlinear drag force is significant when the structural diameter is small enough. Hence, for a small-scale structure, such as riser, mooring line, and tether whose diameter is usually smaller than 0.5 m, the effect of nonlinear drag force should be considered in the fatigue assessment.
Conclusion
In this article, structural fatigue assessment considering the nonlinear drag force is investigated using a series of mono-pile platforms with different diameters. Based on the wave force autocorrelation function, the effect of nonlinear drag force is directly incorporated into the wave force PSD computation. To quantify the influence of the nonlinear drag force, contribution ratios of wave force components are defined and compared. By adopting the time-domain fatigue assessment method, the structural fatigue damage associated with linear and nonlinear wave forces is estimated, and the difference between them is compared. Some main conclusions in this research are summarized as follows:
The wave force PSD is a bimodal spectrum when the nonlinear drag force effect is incorporated. The contribution ratio of the nonlinear drag force to the total wave force is closely related to the wave height, wave period, and the structural diameter. Furthermore, the contribution of nonlinear drag force will increase as structure diameter decreases, and it contributes about 11% to total wave force when structural diameter is equal to 1.0 m.
Discrepancies of stress response arising from linear and nonlinear wave force PSDs are significantly at the crests and troughs, which definitely influence the fatigue damage of the offshore structures. The numerical results indicate that the nonlinear drag force causes about 10% reduction in the fatigue life when structure’s diameter is equal to 1.0 m, and the percentage will decrease as the diameter increases. Therefore, much more attention should be paid on the nonlinear drag force when estimating the small-scale structural fatigue damage.
Footnotes
Academic Editor: Jun Li
Declaration of conflicting interests
The author(s) declared no potential conflicts of interest with respect to the research, authorship, and/or publication of this article.
Funding
The author(s) disclosed receipt of the following financial support for the research, authorship, and/or publication of this article: This work was supported by the National Basic Research Program of China (2011CB013704), the National Science Fund for Distinguished Young Scholars (51625902), the Taishan Scholars Program of Shandong Province, the Major Program of the National Natural Science Foundation of China (51490675), and the National Natural Science Foundation of China (51379196).