
Abstract
The low head pump is widely used in many important water conservation projects for drainage and irrigation purposes. A new type of low head pump, the bidirectional shaft tubular pump, consists of an S-shaped impeller, a straight-guide vane, an inlet section, and an outlet section. As known from the practical project, the distance between the impeller and guide vane of the bidirectional shaft tubular pump greatly affects a pump’s performance; however, because of its unique impeller and guide vane structure, the distance between the two cannot be easily determined by general empirical formulas. Therefore, in this research, three-dimensional unsteady numerical simulations were performed for six guide vane positions under positive and negative rotation conditions, and the accuracy of the results was experimentally verified. The entropy production method based on numerical results was used to evaluate the effect of the distance on the internal flow-loss distribution and overall power loss, and as a result, a better understanding of the hydraulic loss mechanisms was obtained. The results show that the distance between the impeller and guide vane of a bidirectional shaft tubular pump can affect the pump’s efficiency under a positive rotation condition, and turbulence dissipation is the dominant loss. This study can provide theoretical guidance to improve the hydraulic efficiency of low head pumps.
Introduction
As an important part of water conservancy projects, low head pumps play a critical role in the field of inter basin water transfer, urban water supply and drainage. A low head pump includes an inlet section, an axial flow pump and an outlet section. The axial flow pump, as the core direct energy-consumption component, has a strong impact on hydraulic performance. In recent times, computational fluid dynamics has become an important tool for studying the internal flow in pumps and turbines.1–7 In axial flow pump research, many researchers have combined experiments with simulations. Z Wang et al. 8 calculated the hydraulic thrust in a large slanted axial flow pump and analysed the zero-head pump. J Feng et al. 9 studied the effect of tip clearance on pressure fluctuation and introduced a new method to identify pressure fluctuation in the axial flow pump. T Shigemitsu et al. 10 measured the internal flow between the front and rear rotors by laser Doppler velocimetry (LDV) and analysed the flow behaviours. D Zhang et al. 11 simulated the three-dimensional (3D) unsteady turbulent flow in an axial flow pump to study pressure fluctuation. Y Li and F Wang 12 investigated the effect of relative circumferential angle between the inducer-blade trailing edge and the impeller-blade leading edge and the effect of axial distance between the inducer and impeller on flow characteristics and performance of an axial flow pump. D Kaya 13 experimentally investigated two different axial flow pump impellers with and without guide vanes and found that the use of a guide vane could enhance the regaining tangential velocity energy and improve pump efficiency. Z Qian et al. 14 simulated an axial flow pump with a fixed guide vane and adjustable guide vane, and the results demonstrated that the effect of the attack angle and flow separation on the vortex was important. However, little research has been conducted regarding the detailed analysis of hydraulic loss production in axial flow pumps. F Kock and H Herwig15–18 introduced an entropy production method to reveal four different mechanisms of entropy production and provided a detailed determination of local entropy production. Böhle et al., 19 D Li et al. 20 and R Gong et al. 21 successfully applied entropy production to detect the location of losses and evaluate the size of losses in hydraulic machinery.
Bidirectional shaft tubular pumps consist of anS-shaped impeller, a straight diffuser, an inlet section and an outlet section. However, because of its unique structure, the distance between the impeller and guide vane cannot be determined by general methods. In this study, a 3D unsteady numerical simulation was performed on six guide vane positions under positive and negative rotation conditions. The accuracy of the numerical results was verified by a comparison with experimental data. The entropy production method was used to evaluate the spatial internal flow-loss distributions and overall power losses.
Entropy production method
The inner fluid of hydraulic machinery is commonly regarded to be incompressible, and the heat transfer is negligible. Therefore, the internal flow losses by dissipation in pump machinery mainly derive from two types: viscous dissipation and turbulence dissipation. In this study, the flow losses were evaluated with the help of an entropy production method 22 from a thermodynamic point of view.
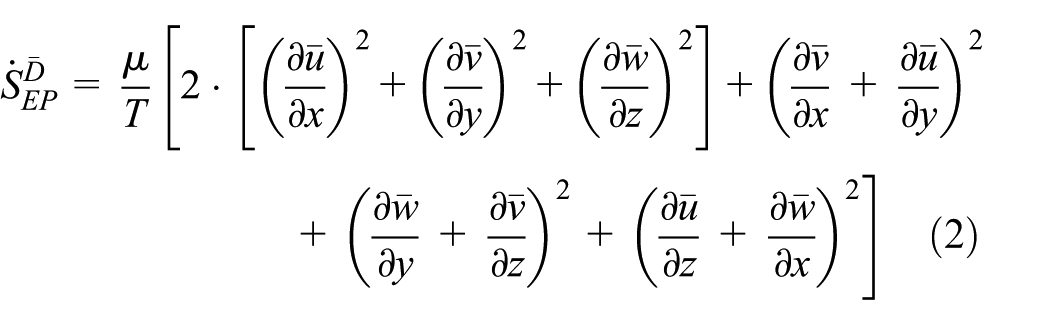
The entropy production rate caused by dissipation can be written as

where
where

where

where
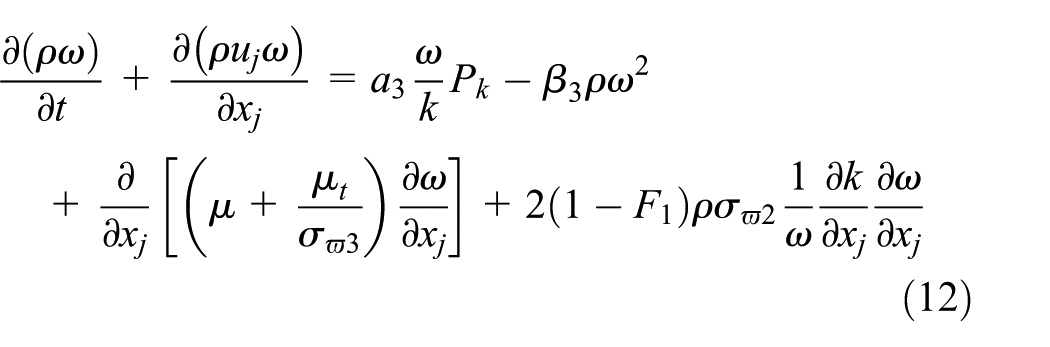
Therefore, the relations between entropy production rates and dissipation rates caused by viscous and turbulent effects can be written as


Finally, the corresponding power losses by the viscous and turbulent effects can be calculated by integrating the dissipation rates over the volume of interest as


Numerical modelling
Calculation domain and grids
Figure 1 shows the 3D model of a bidirectional shaft tubular pump. The outer diameters of the impeller and hub were 300 and 98 mm, respectively. The tip clearance of the impeller was 0.5 mm, and the directions of positive and negative rotations are shown in Figure 2. The impeller blade and the guide vane blade numbers were 3, and the rotation speed n was 1450 r/min. Figure 2 shows six guide vane positions; the range of distance between the impeller and guide vane was 10–160 mm with an interval of 30 mm.

The 3D model of bidirectional shaft tubular pump (under positive impeller rotation condition).
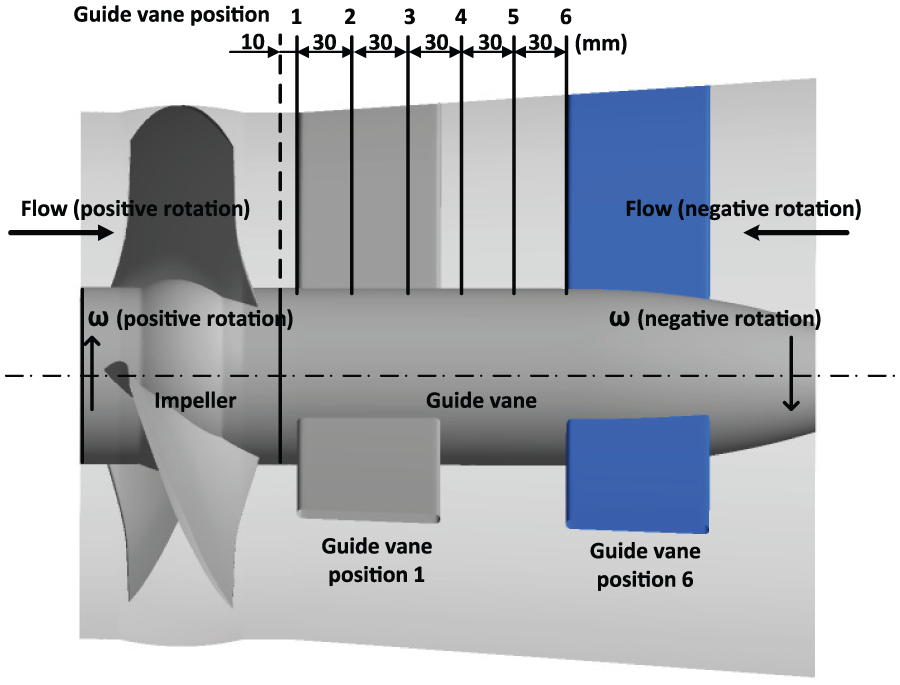
Guide vane position of bidirectional shaft tubular pump.
The flow was considered as a 3D, viscous, and unsteady turbulent flow; therefore, the 3D RANS equations were used. The mass conservation and momentum conservation equations for incompressible fluid are shown in equations (9) and (10). Since all the variables are mean flow quantities, it is customary to drop the time symbols


where µ is the dynamic viscosity, Fi is the source item, and
The shear stress transport (SST) turbulence model was chosen to enclose the equations. The SST model is a modified


ICEM-CFD 14.5 was applied to generate structured grids for all components. Figure 3(a) shows the grids of all domains including the inlet section, impeller, guide vane, and outlet section. A total of 20 grid nodes were set up in the tip gap with a size of 0.5 mm as shown in Figure 3(b). Figure 3(c) shows the grids of six guide vane positions. As many cases were calculated in this article, the total number of pump grids was approximately 6.34 × 10⁶, which was determined by grid independence analysis as shown in Figure 3(d).

Mesh of CFD model: (a) grids of all domains, (b) grids near tip, (c) grid of different guide vane positions, and (d) grid independence analysis.
Numerical scheme and boundary conditions
The 3D unsteady numerical simulations of six guide vane positions under positive and negative rotation conditions were performed using commercial code ANSYS CFX 14.5. The mass flow rate and total pressure were set at the inlet and outlet, respectively. In addition, a smooth-wall condition was used for the wall function. To capture the transient rotor–stator interaction in the flow, the interface between the inlet section and impeller and between the impeller and guide vane was set to ‘transient rotor-stator’. The relative position between the inlet section and impeller and between the impeller and guide vane changed for each time step. The time step chosen for the transient simulation was 1.15 × 10⁻⁴ s for nominal rotating speed, which corresponds to a changed angle of Δφ = 1°. Within each time step, the iteration stopped when the maximum residual was <10−4, and the convergence criterion for the transient problem was when the result had reached its stable periodicity. The total time was 0.414 s.
Experimental validation
As shown in Figure 4, a closed-loop test bench was adopted consisting of a pressure tank, an electric valve, a butterfly valve, an electromagnetic flowmeter, a pressure transmitter, and a torque meter. The intelligent electromagnetic flowmeter measurement uncertainty was ±0.2%. The head was measured with a WT2000DP5S intelligent pressure sensor, and measurement uncertainty was ±0.1%. The torque was measured with a ZJYW1/ZJ 200-N m torque meter, and measurement uncertainty was ±0.14%. The measurement uncertainty of the test bench system was ±0.26%, which complied with national standards.

Photograph of test bed with bidirectional shaft tubular pump model.
To verify the accuracy of the numerical results, experimental results were compared to the simulated results under positive and negative rotation conditions, and the results are shown in Figure 5(a) and (b), respectively. In both positive and negative rotation conditions, the highest efficiency point appeared at the design condition. Good agreements between simulated and experimental results were obtained, and the simulated head result was slightly higher than that of the experimental result, except under 0.8QBEP. However, the maximum relative error was <5%, which indicates that the simulation was reasonable and could be used to perform detailed analysis.

Performance curves of pump: (a) under positive rotation and (b) under negative rotation.
Results and discussion
Performance analysis
Figure 6 shows the pump performances for guide vane positions under positive rotation. As shown in Figure 6(a), the distance between the impeller and the guide vane has little effect on the head, which decreases with increasing flow rate. As shown in Figure 6(b), the efficiency declines for a flow rate of 0.8QBEP and increases for a flow rate of 1.1QBEP as the distance between the impeller and guide vane increases. However, under 1.0QBEP the efficiency first increases in the guide vane position range of 1 to 4 and then stabilises in the range of 4 to 6. The maximum efficiency under the 0.8QBEP condition is 61.6%, which is attained at guide vane position 2. The maximum efficiencies under 1.0 QBEP and 1.1 QBEP flow rates are 68.2% and 65%, respectively, which are attained at guide vane position 6. Figure 7 shows the pump performance for different guide vane positions under a negative rotation condition. The effect of distance between the impeller and guide vane on the head and the efficiency under a negative rotation condition was unclear as shown in Figure 7(a) and (b). Therefore, the primary aim of the following section is to analyse the power loss under a positive rotation condition.

Pump performance under positive rotation: (a) head and (b) efficiency.

Pump device performance under negative rotation condition: (a) head and (b) efficiency.
Analysis of power dissipation
Figure 8 shows the power loss by viscous dissipation for different operating conditions. It shows that power loss by viscous dissipation was very small (<3 W), and the effect of flow rate on dissipation power was not evident. Figure 9 shows the power loss by turbulence dissipation for different operating conditions. The maximum loss, >800 W, occurred in the outlet section. The flow rate had a significant effect on power loss by turbulence dissipation in every section except for the inlet section, where dissipation power was minimal. The power loss by turbulence dissipation inside the impeller and guide vane decreased as the flow rate increased, and the turbulence dissipation power loss in the outlet section first decreased and then stabilised as the flow rate increased. Therefore, the power losses by viscous and turbulence dissipation in the inlet section were neglected in this study.

Power loss by viscous dissipation for different operating conditions under guide vane position 4.
Power loss by turbulence dissipation for different operating conditions under guide vane position 4.
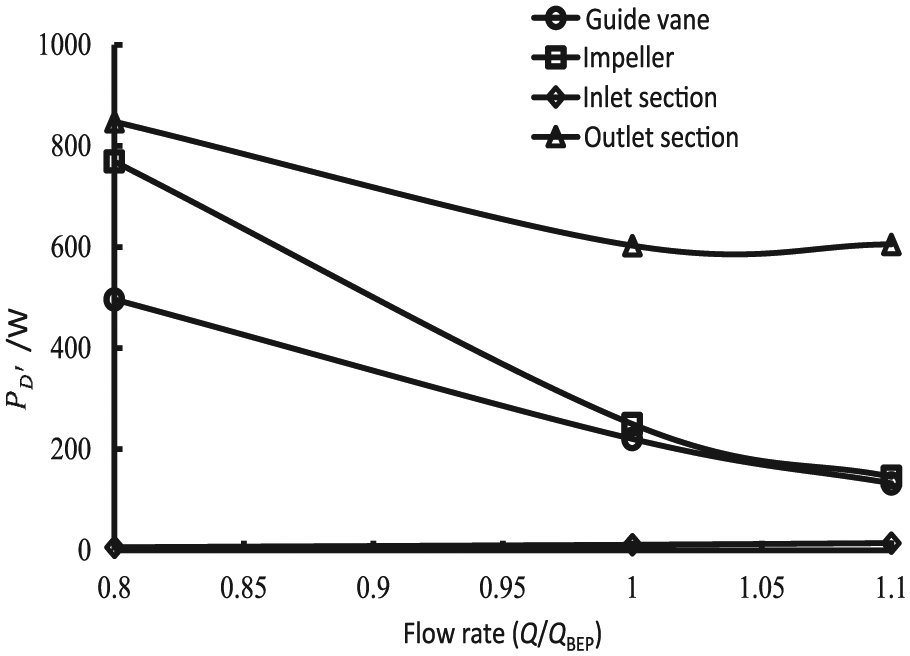
Figure 10 shows the power loss by turbulence dissipation inside the impeller for different guide vane positions; the distance between the impeller and guide vane had very little effect on power loss. Figure 11 shows the power loss by turbulence dissipation in the guide vane passage for different guide vane positions. The dissipation power decreased as the distance between the impeller and guide vane increased at 0.8QBEP, and the maximum value was >600 W. Figure 12 shows the power loss by turbulence dissipation in the outlet section for different guide vane positions. At 0.8QBEP, the dissipation power first remained stable and then increased rapidly as the distance increased, and the maximum value exceeded 1200 W. At 1.1QBEP, the dissipation power decreased as the distance increased. At 1.0QBEP, from position 1 to position 4, the losses decreased as the distance increased, and a local peak value at position 5 was observed. At 1.0QBEP, the maximum dissipation power exceeded 1200 W, and at 1.1QBEP, it was <1000 W.

Impeller power loss by turbulence dissipation.

Guide vane power loss by turbulence dissipation.

Outlet section power loss by turbulence dissipation.
Analysis of loss distributions
To identify and localise the flow features responsible for large amounts of dissipation, the contour and isosurface for turbulence dissipation were analysed.
As shown in Figure 10, the distance between the impeller and guide vane had little effect on the impeller power loss by turbulence dissipation; thus, visualisation of the loss spatial distribution inside the impeller of guide vane position 4 only was studied. Figure 13 shows the contour of turbulence dissipation at the impeller blade at 0.8QBEP. The flow loss by turbulence dissipation at the suction side was higher than that at the pressure side, and a large loss region was observed near the leading edge. Figure 14 shows the isosurface inside the impeller passage with

Contour of turbulence dissipation at impeller blade at 0.8QBEP .

Impeller passage isosurface with
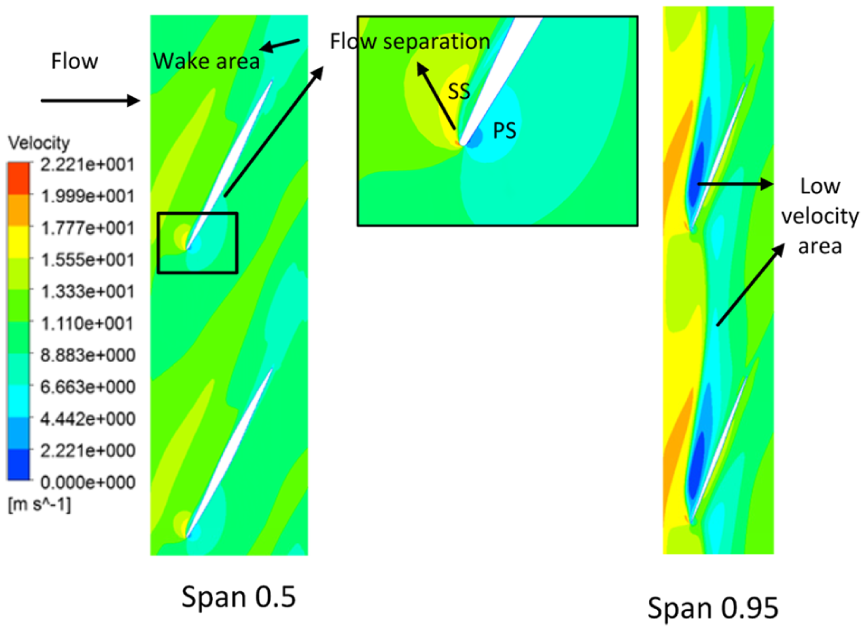
Impeller blade-to-blade view of velocity at 0.8QBEP.
As shown in Figure 11, at 0.8QBEP, the effect of distance between the impeller and guide vane on power loss is evident, and guide vane positions 1, 4, and 6 are representative; therefore, visualisation of loss spatial distribution inside the guide vane was studied for these guide vane positions at 0.8QBEP. Figure 16 shows the isosurface of turbulence dissipation with
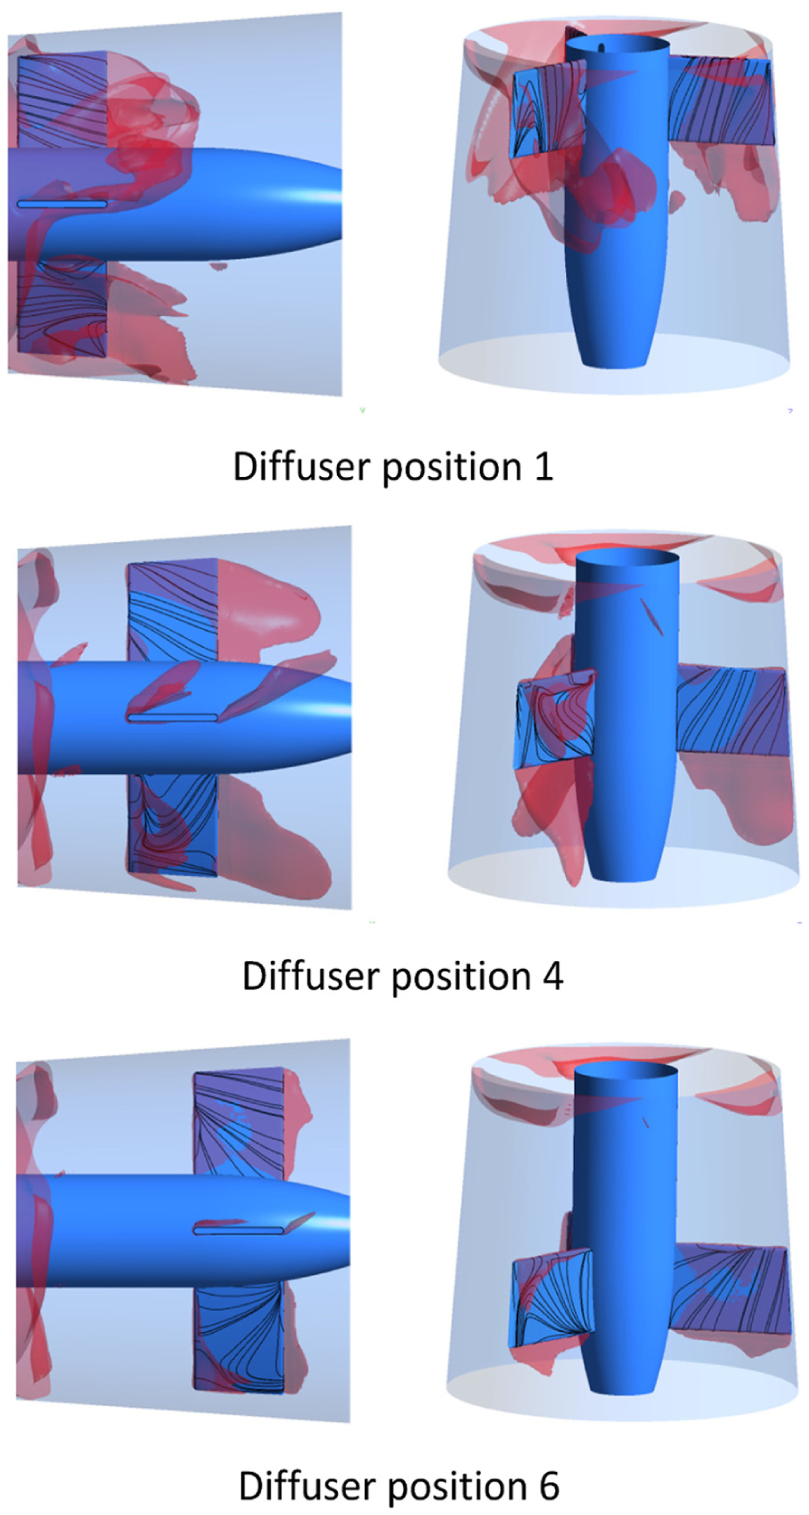
Isosurface with

Contour of turbulence dissipation at guide vane at 0.8QBEP.
Conclusion
The entropy production analysis of flow loss in a bidirectional shaft tubular pump was carried out based on numerical simulation, and the accuracy of the numerical results was verified by the experimental data. Under negative rotation, the distance between the impeller and guide vane had little effect on the head and efficiency of the pump, while under positive rotation, the effect of distance on the efficiency was evident. Therefore, the effect of distance on loss under positive rotation was studied in detail. The following conclusions can be drawn:
The viscous dissipation loss is far smaller than that of the turbulence dissipation loss in a pump; therefore, the viscous dissipation loss can be neglected. Furthermore, the turbulence dissipation loss in the inlet section is much smaller than that in other components.
The effect of the distance between the impeller and guide vane on turbulence dissipation loss in the impeller is not obvious. The maximum loss by turbulence dissipation can be found near the leading edge.
The turbulence dissipation loss is affected by the distance between the impeller and guide vane in the diffuser. In particular, at 0.8QBEP, loss declines as the distance increases. Furthermore, the maximum loss can be found near the leading edge.
In the outlet section, the effect of the distance on turbulence dissipation depends on the flow rate. At 0.8QBEP, the loss decreases as the distance increases, but at 1.0QBEP and 1.1QBEP, the loss rises as the distance increases.
This study can provide theoretical guidance to improve the hydraulic efficiency of low head pumps.
Footnotes
Appendix 1
Academic Editor: Jose Ramon Serrano
Declaration of conflicting interests
The author(s) declared no potential conflicts of interest with respect to the research, authorship, and/or publication of this article.
Funding
The author(s) disclosed receipt of the following financial support for the research, authorship, and/or publication of this article: This study was supported by National Science and Technology Pillar Programme of China (2015BAD20B01), National Natural Science Foundation of China (grant no. 51409123), Natural Science Foundation of Jiangsu Province (grant no. BK20140554), and Training Project for Young Core Teacher of Jiangsu University.