
Abstract
In this article, a new fatigue life analysis method based on six sigma robust optimization is proposed, which considers the random effects of material properties, external loads, and dimensions on the fatigue life of a pantograph collector head support. Some main random factors are identified through fatigue reliability sensitivity analysis, which are used as input variables during fatigue life analysis. The six sigma optimization model is derived using the second-order response surface method. The response surface is fitted by the Monte Carlo method, the samples are obtained by the Latin hypercube sampling technique, and the proposed model is optimized using the interior point algorithm. Through the optimization, the collector head support weight is reduced, the mean and the standard deviation of fatigue life have been decreased, and the effect of design parameter variation on the fatigue life is reduced greatly. The robustness of fatigue life prediction of collector head support is improved. The proposed method may be extended to fatigue life analysis of other components of electric multiple units.
Introduction
The pantograph is one of the most important electric equipments in the electric multiple units (EMU), which collects the electric power from catenary for the EMU. The pantograph is mainly composed of collector head support (CHS) and carbon slipper, which is subjected to shock loads between carbon slipper and contact wire. 1 The working conditions of pantograph are becoming worse and worse with the increasing speed of the EMU.
The pantograph has been subjected to variable loadings due to the uneven track, the impact force of pantograph and catenary, and the air flow force, which may cause fatigue damage of the pantograph, shorten its service life, and affect the safety and reliability during EMU operation.2,3 When the pantograph worked for a period, some cracks were found in the pantograph CHS and the vane where fatigue failure may occur. To ensure the normal usage of pantograph and reduce accident occurrences, it is necessary to investigate the fatigue life and reliability of the pantograph CHS.
Fatigue reliability analysis, which combines the fatigue life analysis and reliability-based design, is an effective method to improve the reliability of engineering components. 4 In this method, the dispersion problem of affecting the component fatigue life is fully considered. Comparing the conventional fatigue analysis, however, a large number of random factors make the fatigue reliability analysis much more complex. Moreover, fatigue reliability analysis is also related to probability distribution of fatigue life. 5 Generally, the probability distribution needs to be statistically analyzed based on a large number of experimental data, and these experiments are often time consuming and costly. Thus, the development of the investigation on structural fatigue reliability is relatively slow. In recent years, many researchers have made some achievements on structural fatigue reliability analysis.6–8 The key to solve the issue of fatigue reliability analysis is to establish an effective fatigue reliability model, which should be consistent with fatigue failure mechanism and also reflect the dispersion of various factors during fatigue failure.9–18 At present, the established models for fatigue reliability analysis mainly include residual strength model, 9 cumulative damage model, 10 strain energy model,11,12 ductility exhaustion model, 13 damage-strengthening model, 14 and probabilistic life prediction models.15,16 However, the robust optimization is rarely considered during fatigue reliability analysis of pantograph CHS. In recent years, the six sigma robust optimization has been widely applied to engineering practice.18–22
In this article, fatigue life analysis based on six sigma robust optimization for pantograph CHS is proposed, where the fatigue reliability analysis is conducted to find the uncertain factors which affected the fatigue life of structure, and six sigma robust optimization analysis is conducted to decrease the effects of uncertain factors on fatigue life.
From the engineering application prospect, the combination of six sigma and robust optimization in railway industry can improve the robustness of mechanical components and reduce the impact of random factors on the component performance. Meanwhile, this method lightens the component weight and contributes to the light weight design.
Through the fatigue reliability analysis of CHS, its fatigue reliability can be predicted considering many factors, such as surface quality, stress concentration, external loads, and plate thickness, and the main factors and secondary factors that cause its fatigue failure can be obtained. The dispersion problems of fatigue life are analyzed using six sigma robust optimization design. Accordingly, the random factors affecting the sensitivity of fatigue life are reduced greatly.
This article is organized as follows: section “Six sigma robust optimization design method” provides six sigma robust optimization design method. The static strength analysis of CHS based on finite element analysis is given in section “Static strength analysis of CHS based on finite element method.” Section “Fatigue reliability analysis of CHS” conducts fatigue reliability analysis of CHS. Section “Fatigue life analysis based on six sigma robust optimization for CHS” carries out fatigue life analysis based on six sigma robust optimization for CHS. A brief discussion and conclusion closes the article.
Six sigma robust optimization design method
Robust optimization design 18 is an effective method to reduce the effects of various uncertain factors on the target response value. Namely, the mean square value of the target response can be reduced. It can also achieve the goal of lower sensitivity value for target response under the random plenty of uncertainty factors. Six sigma robust optimization19,20 is an advanced design method with combination of six sigma quality management theory and robust optimization. It minimizes the objective response value to meet the reliability design requirement.
Considering the complex nonlinear relationship between target response values and design parameters, the Monte Carlo method is used for numerical calculation in this article. The used sampling method is Latin hypercube in the ANSYS probabilistic design system (PDS) module. The six sigma robust optimization model is built through the response surface method. Finally, the six sigma robust optimization design of CHS is accomplished using the optimization toolbox of MATLAB 2010b.
Static strength analysis of CHS based on finite element method
Structural analysis of CHS
In order to obtain an accurate simulation result, the integrated model of the pantograph was established including CHS and the contact strip. The CHS stress was calculated by analyzing the strength of the integrated model. The geometry of the CHS is shown in Figure 1.

Geometry of the CHS.
Finite element model of CHS
To improve the model calculation accuracy, a finite element model of CHS is meshed by hexahedral element. The loads and constraints of CHS are defined based on the force and boundary conditions of contact strip and CHS. Figure 2 shows the integrated finite element model of contact strip and CHS. In Figure 2, the grid size of contact strip and CHS finite element model is 5 mm, and the total grid numbers are 92,646.
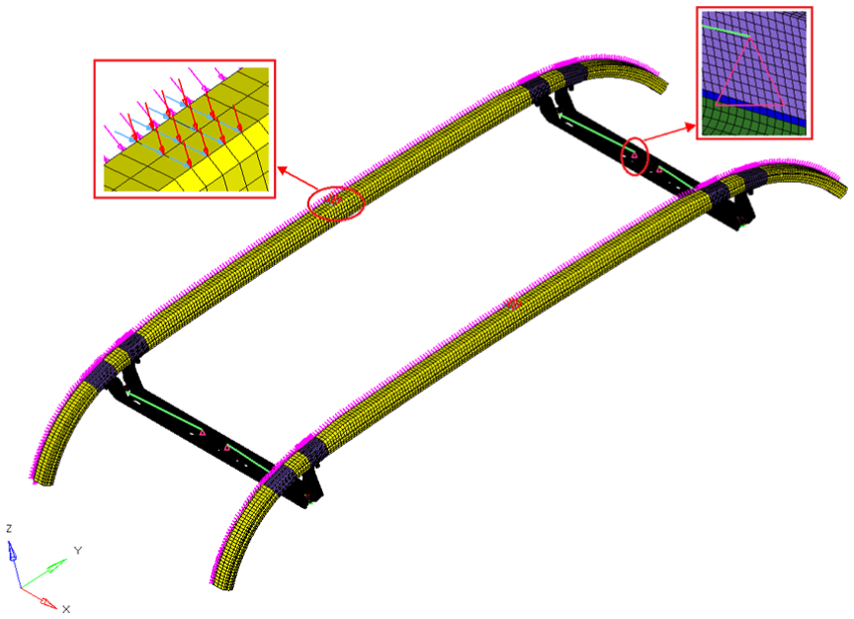
The integrated finite element model of contact strip and CHS.
According to the actual loading conditions of CHS, the force in the pantograph can be simplified as follows. First, the friction between pantograph and contact wire can be simplified as the longitudinal force FX. The load caused by the car body vibration and the impact of the pantograph-catenary is simplified as the vertical force FZ. Then, the air pressure can be simplified as aerodynamic load PRES. The values of the above-mentioned simplified forces are 450 N, 350 N, and 6000 Pa, respectively. The material of model for the CHS and carbon slipper is the aluminum alloy, and its yield strength is 435 MPa.
Static strength check of CHS
The load condition of static strength calculation includes longitudinal force FX, vertical force FZ, and aerodynamic load PRES. 22 This analysis is conducted in the ANSYS 14.0. When the calculation is completed, the maximum Von Mises stress results are obtained. Figure 3 shows the maximum Von Mises stress results of the CHS and the carbon slipper. The Von Mises stress distribution of the CHS can be obtained as shown in Figure 4.

Von Mises stress results of the CHS and the carbon slipper.

Von Mises stress of the CHS.
From Figure 4, it can be seen that the maximum value is 93 MPa, which is smaller than the material yield strength 435 MPa. Therefore, the static strength of the CHS meets the design requirements.
The static strength calculation for the CHS and the carbon slipper indicates the position of the maximum Von Mises stress located in the installing hole of the CHS. The simulation result is consistent with that of actual test conditions. Thus, the simulation results provide a certain reference value for the primary design work. It can also shorten the product development cycle and reduce the cost to a certain extent.
Fatigue reliability analysis of CHS
Fatigue life assessment of CHS
Fatigue life of CHS under variable loading is evaluated according to the P-S-N curve of material and the load spectrum of CHS.23–26 However, the test data of variable load spectrum are difficult to be obtained due to the limitation of experimental conditions. In this study, a simplified fatigue load spectrum according to the actual situation is applied to calculate the CHS fatigue life together with the material P-S-N curve.
The parameter of P-S-N curve
For the CHS, the P-S-N curve of the material is often used to calculate its fatigue life, and the formula can be expressed as follows

where
Mean stress correction
During the operation of the EMU, the pantograph will generate vibrations, which makes the stress of the CHS fluctuant around a certain average stress. Often such cyclic loadings with mean stress considerably influence the component damage accumulation process. The stress spectrum can be expressed by average stress and stress amplitude. The average stress is zero according to the material P-S-N curve. Therefore, the simplified stress spectrum equation is modified based on Goodman diagram 26 as follows

where
The fatigue life of CHS can be calculated by equation (1), where the equivalent stress
Fatigue reliability calculation of CHS
The calculation of fatigue reliability life is completed using the ANSYS PDS module and HyperMesh 11.0 software. A parametric model of CHS is built using the APDL language. 27
The parameters of variable loads, structural dimensions, and materials are defined as random inputs, and the distribution characteristics and values of each parameter are listed in Table 1. A limit state equation can be expressed as the difference between the calculated life and the designed life 28

where
Distribution characteristics and numerical values of each random variable parameter.

Reliability calculation of CHS
The Monte Carlo method is used to calculate the structural fatigue reliability.21,28 In this article, the fatigue probability analysis for CHS is completed using ANSYS PDS module. The sample points of 500, which are obtained using Latin hypercube sampling technique, are introduced to calculate the structural state function of G. Figure 5 represents the variation trend of the sample mean values. The vertical coordinate is the difference between the calculated life and the designed life, and the horizontal coordinate is the number of sample points. The middle line represents the mean value, and the other two lines are the upper and lower bounds of the structural state function. From Figure 5, it can be seen that the variations of mean value of structural state function G tends to be stable, which indicates the reliability agrees well with the design requirement and the reliability is 99.60%.

The variation trend of the mean value of structural state function samples.
Sensitivity analysis of fatigue reliability
Through the sensitivity analysis, the main factors that affect CHS fatigue reliability can be obtained. Figure 6 shows the sensitivity of reliability results, in which the size of areas represents the important degree of different influencing factors. The positive input parameters mean that the parameters are positively correlated with the output, while the negative input parameters mean that the parameters are negatively correlated with the output. From Figure 6, note that the main factors are the longitudinal force FX and the structure size T1 and T2 of CHS. The other factors have little impact on the fatigue reliability of the CHS.

The sensitivity of fatigue reliability results.
Fatigue life analysis based on six sigma robust optimization for CHS
Establishment of approximate response surface model
The longitudinal force accuracy is difficult to control since such force is determined by many factors, such as the CHS structure, air flow impact, and vibrations. This article focuses on the influence of the size of CHS structure on its fatigue reliability.
However, the relationship between fatigue life and structural dimensions is the implicit nonlinear, it is difficult to be formulated in the analytic expression. The response surface method may describe accurately implicit nonlinear relationship of the fatigue life and structural dimensions. The robust optimization model of six sigma is built using the response surface method to improve the analysis accuracy.
In this research, a response surface–based model is built considering the parameters of the plate thickness and fatigue life values. In engineering application, the second-order response surface model is used widely, and the basic formula is

where
The Monte Carlo method is used to simulate and fit an accurate response surface model of CHS. The response value of the CHS fatigue life is obtained by 500 times Latin hypercube sampling technique. The distribution types and the design variables are shown in Table 2.
Upper and lower bounds of variables and the distribution types.
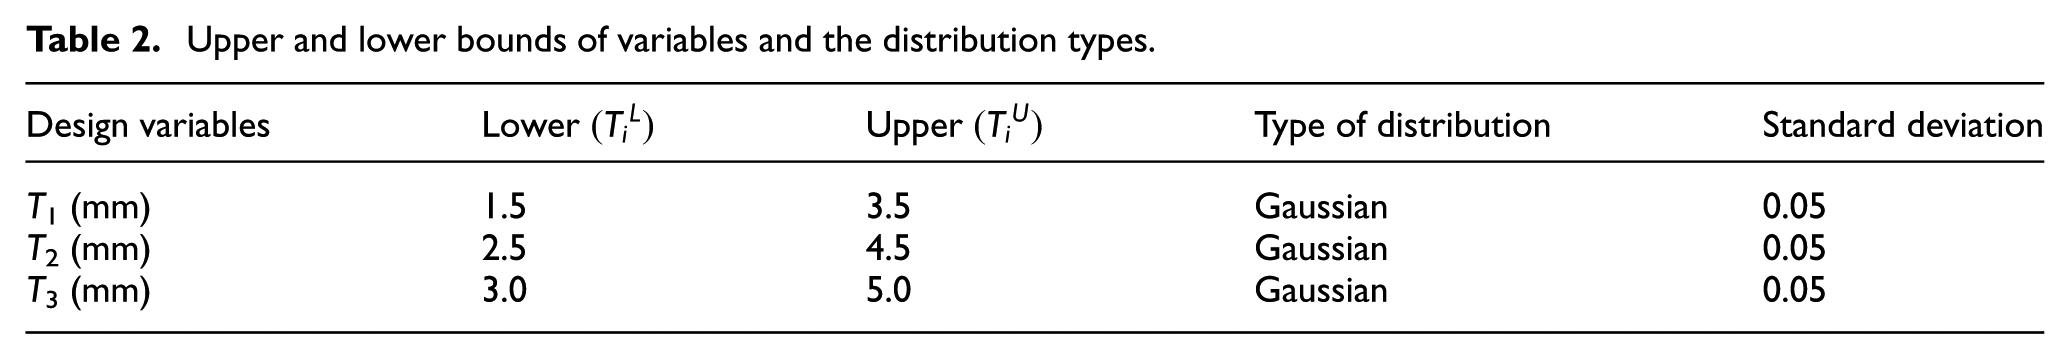
Figure 7 shows the variation trend of the mean value of fatigue life samples. The vertical coordinate is the fatigue life of the CHS, and the horizontal coordinate is the number of sample points. From Figure 7, the mean values of fatigue life samples have stabilized by 500 times simulation to the CHS. Thus, the predicted fatigue life is reasonable.

The variation trend of the mean value of fatigue life samples.
Figure 8 shows the sensitivity analysis for the CHS fatigue life, in which the area size represents the important degree of influencing factor. From Figure 8, it can be seen that the effect degrees of the analyzed design variables on the fatigue life are ranked as T1 > T2 > T3.

The sensitivity of fatigue life.
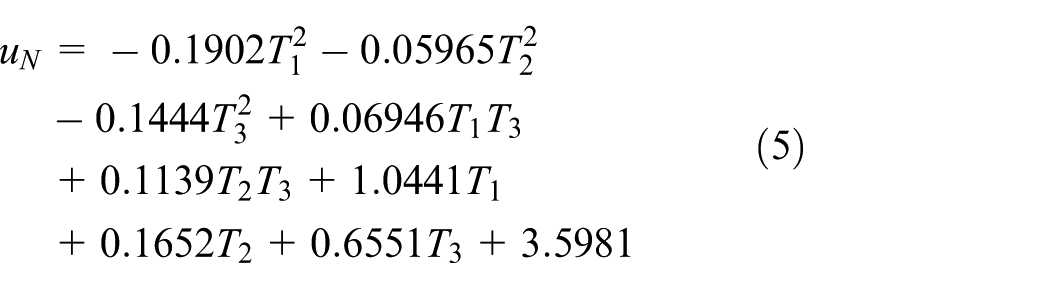
Based on the sensitivity analysis, the design variables on the fatigue life, T1, T2, and T3, are used to fit the response surface.
The response surface of the mean value of CHS fatigue life is as follows
The response surface for standard deviation value of fatigue life for CHS is as follows
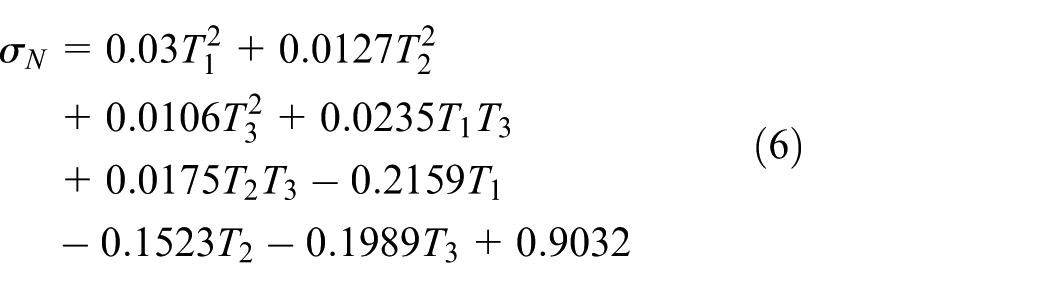
where
Evaluation of response surface model error
The fitting precision of response surface model is evaluated by the determination coefficient. The calculation method of the determination coefficient, 29 R2, is as follows
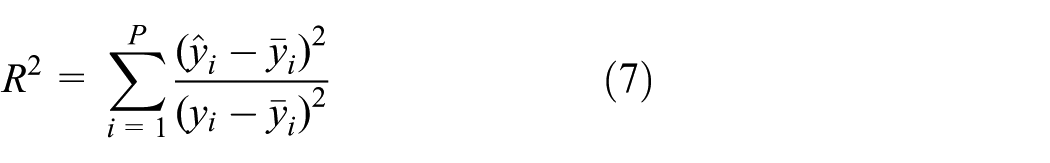
where
Six sigma robust optimization design of fatigue life
The fatigue life of CHS is calculated using its parametric model considering the first principal stress. Then, the response surface models of the fatigue life mean and standard deviation are obtained using the Monte Carlo method. Finally, the optimal solution is obtained using the interior point algorithm method. The specific flow is shown in Figure 9.

Process of fatigue life analysis based on six sigma robust optimization design.
Fatigue life analysis based on six sigma robust optimization model is as follows

where
Result analysis
The interior point algorithm is performed by MATLAB 2010b software. The results of pre-optimization and post-optimization are shown in Table 3.
Six sigma robust optimization results of fatigue life.
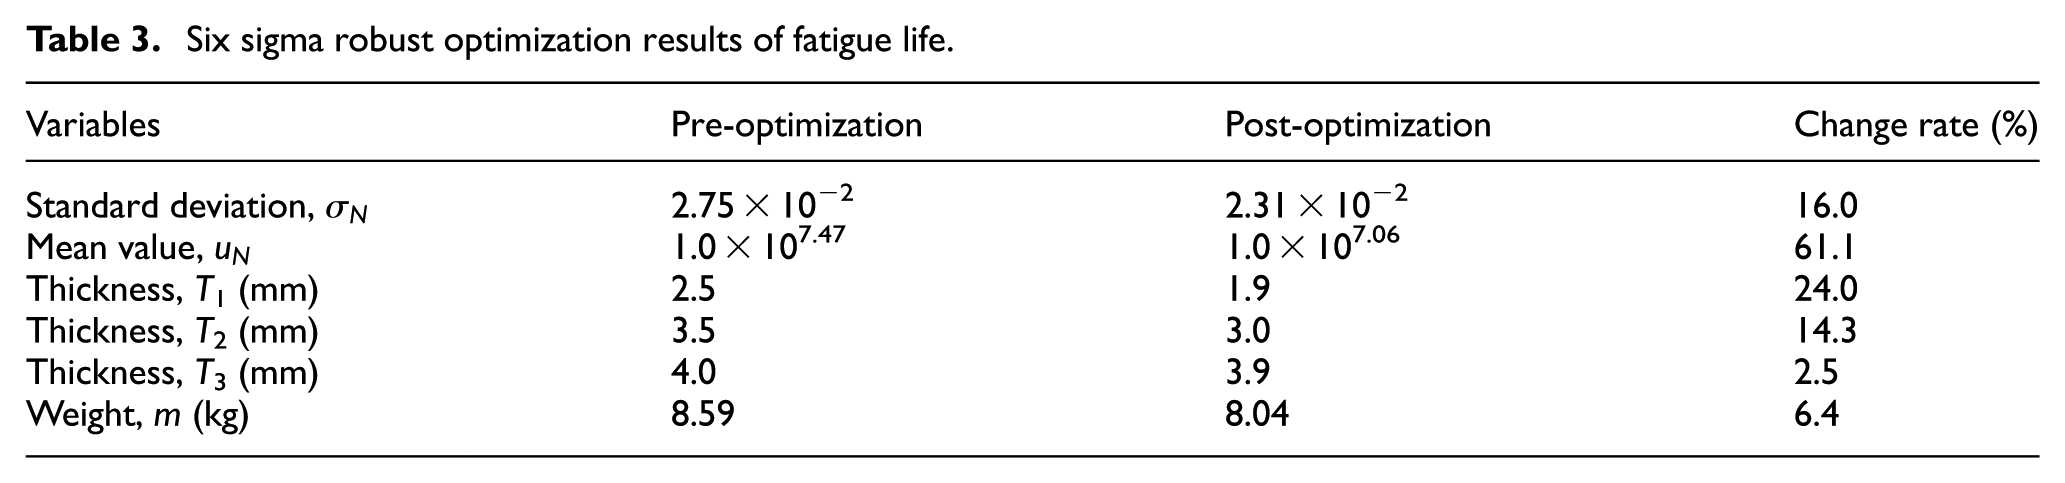
From Table 3, it can be concluded that the fatigue life value of post-optimization is more close to designed life value N0. The CHS weight is reduced with the decrease in the sizes of design variables. Considering the engineering practice, the optimized thickness values of T1, T2, and T3 are round to 2.0, 3.0, and 4.0 mm, respectively. Meantime, the mean and standard deviation of fatigue life have been decreased by 16%, which indicates that the effects of parameter variation on fatigue life are reduced greatly. Therefore, the robustness of CHS design is improved.
Conclusion
This article analyzed the fatigue life based on six sigma robust optimization method for pantograph CHS. A new six sigma optimization model is built by the second-order response surface. The response surface is fitted by Monte Carlo method and the samples are obtained by the Latin hypercube sampling technique. The design parameters are optimized and the robustness of fatigue life of CHS is improved. Some conclusions are as follows:
Through the sensitivity analysis of the CHS fatigue life, the effects of its main design variables affecting on the fatigue life are identified, which are thickness of carbon slipper mount T1, thickness of U shape mount T2, and thickness of spring mount T3.
The sensitive design parameters of T1, T2, and T3 are optimized by the six sigma robust optimization method. Through the optimization, the CHS weight is reduced with the decrease in the sizes of design variables, the mean and standard deviation of fatigue life have been decreased by 16%, and the effect of parameter variation on fatigue life is greatly reduced. Six sigma robust optimization for pantograph CHS is realized. The proposed method may be extended for application on the other components of EMU.
Footnotes
Academic Editor: Yongming Liu
Declaration of conflicting interests
The author(s) declared no potential conflicts of interest with respect to the research, authorship, and/or publication of this article.
Funding
The author(s) disclosed receipt of the following financial support for the research, authorship, and/or publication of this article: The authors would like to acknowledge the partial supports provided by the program of Educational Commission of Liaoning Province under contract number JDL2016001, the program of National Natural Science Foundation of Liaoning Province under contract number 2014028020, and the program of the Dalian Science and Technology Project under contract number 2015A11GX026.