
Abstract
Bus travel speed is the fundamental indicator for the bus operation dynamic monitoring, traveler’s information service, as well as the bus service evaluation. This article proposed a real-time travel speed calculation model for public transit based on global positioning system data. Combining the real-time bus global positioning system data with the bus geographical information system map, the study developed a series of processing procedures to match the bus location onto the map accurately, so that it could determine the bus position of the given arc and estimate the bus arrival time. Based on the estimated travel time and the actual distance between bus stops, a bus travel speed calculation model was established. In addition, the study designed a survey to verify the precision of the model. The error analysis results showed that the average precision of the travel speed between bus stops and the line speed estimation models were 88.4% and 97.9%, respectively. Finally, optimization strategies for the models were also made by keeping the stable high-frequency global positioning system data and modifying the stop position, and the precision of travel speed estimation was improved to 91.4%, which can meet the demand of the monitoring and evaluation of public transit operation.
Keywords
Introduction
Public transit plays an important role in urban residents’ trips. Bus travel speed is a basic indicator for public transit monitoring, which not only reflects the efficiency of trips and provides essential indicator for the bus information service but also gains insight into the problems of bus operation and provides objective bus service–level evaluation. 1 By monitoring the travel speed of bus transit system, the operation center can discover the abnormality of the bus operation and service quickly and make remedial measures in time. Moreover, by comparing the bus travel speed in a long term, the service level of the bus transit system can be evaluated easily. 2 The bus travel speed is an important factor to measure the bus service level, and it is the basis of determining the arrival time of bus, which can reduce the passengers’ anxiety and waiting time at bus stops. 3 The transit agencies also used the global positioning system (GPS) data to reflect the bus speed, which is not only a simple and economic method to better understand the operation condition of public transit network but also a way to reflect the possible traffic conditions and evaluate the potential consequences of road infrastructure changes. 4
Traditionally, public transit speed collection mainly depends on the manual surveys, such as bus-following survey and roadside observation. However, application coverage of these ways is limited along with the heavy demand of human and material resources. At present, there are 820 bus lines in Beijing city, >90% of the lines carrying the bus real-time GPS positioning system. The application of vehicle-mounted GPS devices provides effective data foundation for the real-time extraction of bus travel speed. These data record the information of time, vehicle position, instantaneous speed, and so on. The biggest challenge is how to extract bus travel speed at line level and network level from bus GPS data accurately. The travel speed and travel time information of public transport vehicles is valuable for decision makers, bus operators, and passengers. With the rapid development of Advanced Public Transit System (APTS), more and more real-time data of bus vehicle and passengers, including the GPS data and IC card transaction data, were collected from APTS. How to extract the accurate bus operation information from these data becomes the key research.
First of all, the GPS data–based bus arrival time prediction is the study emphasis in recent years.5,6 Various prediction methods such as historic and real-time approaches, 7 machine learning techniques, 8 and statistical methods 9 have been proposed in the former research. A regression models had been developed to predict bus arrival information for buses traveling between two points along a route. 10 Based on real-time GPS data, a bus arrival prediction system had been proposed, 11 which took delay times into account for under heterogeneous traffic conditions in Indian. A new model can predict the bus arrival time using GPS data, 12 which divided bus travel time into three parts: travel time from present location to the end of downstream queue, waiting time for the red light, and time for discharging downstream queue vehicles.
However, little research has been conducted on calculation models for bus travel speed. The bus travel speed is the foundation to effectively evaluate the operation condition and the level of service (LOS) of bus transit. 13 Based on GPS data, a method had been presented to monitor average commercial bus speeds systematically. 14 The method was based on the time–space diagram of bus system using the grid analysis method 15 to calculate the travel speed, and it could be applied to both bus route as a whole and section speed over segments of arbitrary length or arbitrary duration. An exponential smoothing model had been proposed to estimate the travel speed of road section using the instantaneous speed values from the bus GPS data, 16 and the zero value data were aborted to improve the accuracy of speed calculation. The map matching rules for GPS data and bus stops under different scenarios were also introduced in detail. The day-to-day variability of public transport travel time was surveyed using a GPS dataset, 17 and the influence factors contributing to the travel time variability had been analyzed.
In conclusion, a large amount of research based on bus GPS data has been conducted on the bus evaluation methodologies, 18 bus arrival time predication models, 19 and influence factors to improve the performance of bus travel time prediction. 20 However, the existing studies usually focused on the delay at special bus operation facilities such as intersections and travel speed at route level, and little research studies were supported by real-time GPS data 21 and geographical information system (GIS) based on bus line data. 22 Therefore, few studies can respond to the questions that how to calculate the travel speed between any adjacent bus stops, how to accurately estimate the arrival time of bus using the discrete GPS spot data, and how the model error difference is on different classes’ road. Additionally, the systematic error and uneven receive time interval of original GPS data make it rather difficult to estimate the actual travel time of bus at any two adjacent stops.
Specifically, this study attempted to estimate the bus travel speed by making use of the real-time GPS data. Based on the preparation of GPS data and bus route data and matched GPS points with the GIS map, the bus travel time was estimated and then it could acquire the bus travel speed using the travel time and the distance between bus stops. To verify the precision of proposed calculation model, the study conducted a bus-following survey and developed an error analysis for the estimation models. Finally, the study optimized the model according to the identified influence factors of error to improve the accuracy of calculation results.
Data preparation and preprocessing
The bus GPS data
Bus GPS data applied in this study was provided by Beijing Public Transport Holdings (the largest bus companies in Beijing). Currently, about 800 bus routes were operated by this company in Beijing; almost all bus vehicles are equipped with the on-board GPS devices, covering >20,000 vehicles. Smaller the time interval of GPS location data transmission from the vehicle returning the center server, the more accurate the travel speed calculation results. Usually, the time interval of GPS is 30 s in Beijing, and about 4.5 million data points are reported per day on average.
The original GPS data are stored in database. There are seven main fields including SIM card ID of vehicle-mounted GPS equipment, route code, vehicle code, returned time, latitude, longitude, and instantaneous speed. A sample of bus GPS original data is shown in Table 1. The speed of the GPS data is the instantaneous speed of the bus, which could not reflect the actual bus travel and operation conditions well. Meanwhile, discrete instantaneous speed values cannot reflect the influences of dwelling and traffic control delays acting on bus operation. In this study, if the instantaneous speed remains approximately 0 for several continuous records, the bus vehicle is usually regarded as parking at bus stop, and if the time duration of low instantaneous speed is >5 min, the GPS data will be discarded because of the GPS accuracy drifting issues under low speed.
Sample table of bus GPS original data.

The public transit GIS map data
In this study, bus route data were obtained based on the GIS map data, mainly including arc section information of bus scheme running path and the bus stops’ positions in the arc section. In order to make the framework work and the feasibility of the calculation, the GIS map data had to be conducted in two steps:
Searching out all the bus routes’ arc sections based on the bus scheme;
Ascertaining all the bus stops’ positions on the proportion of corresponding arc sections.
Then, the original GIS map was modified into the processed GIS map, as shown in Figure 1. It was obvious that the adjacent bus stops in the same roadside had been combined into one stop. The bus stops were simplified to reduce the matching time.
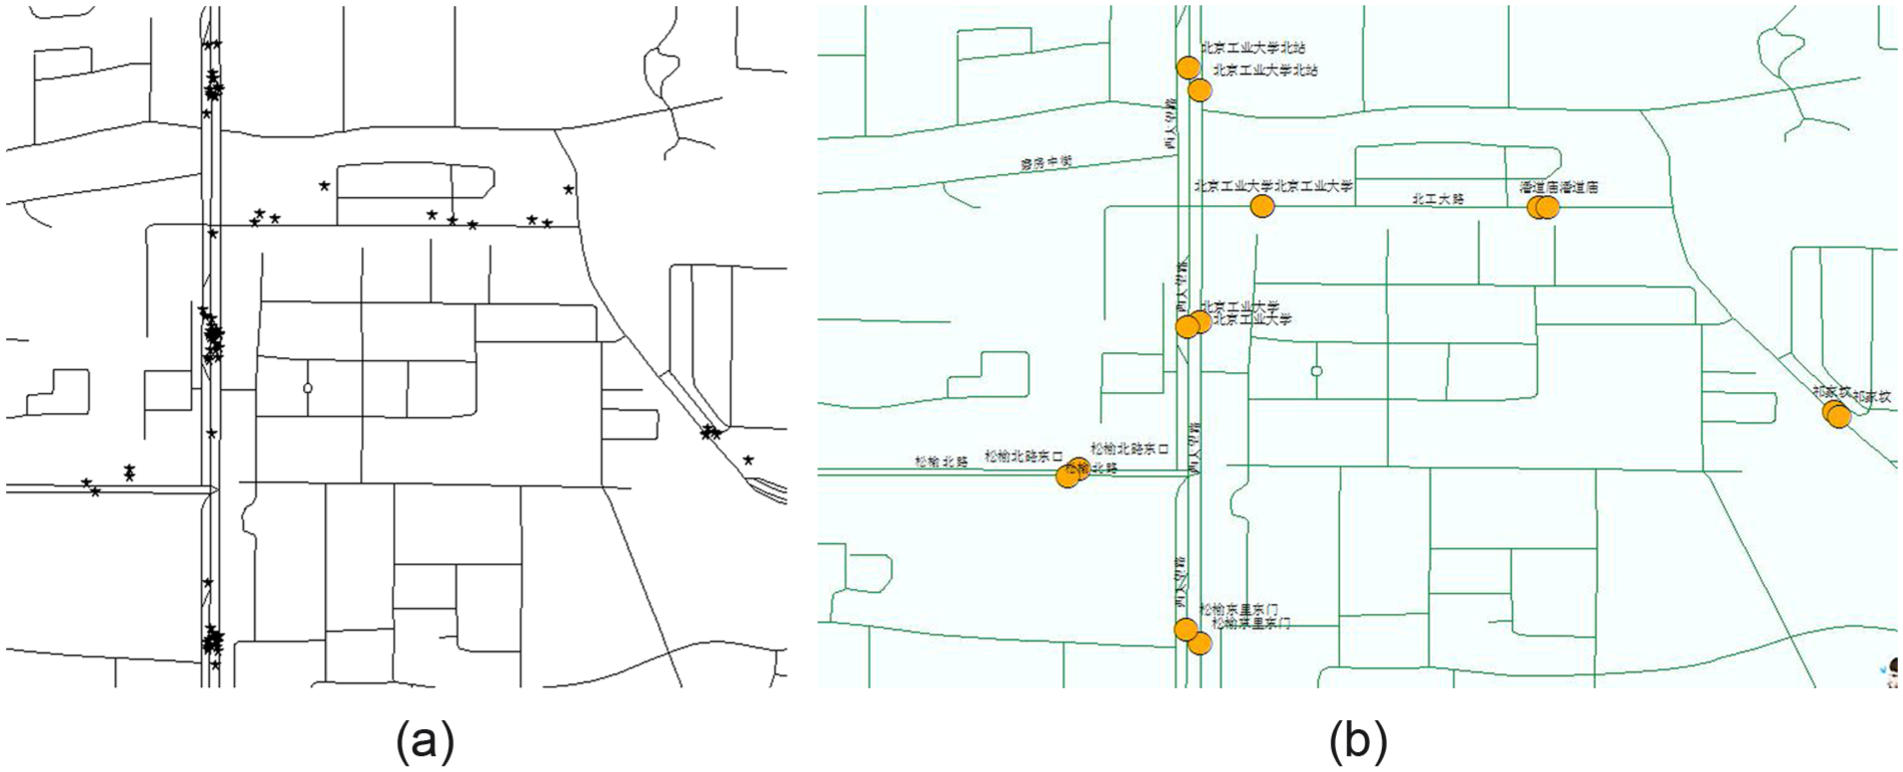
Comparison between (a) the original GIS map and (b) the processed GIS map.
After this, the bus route data were extracted from the GIS map with the fields including the arc sections of two directions of a bus route, the calculated latitude and longitude of bus stops, and the distances between stops. The example of line 6 data is shown in Table 2.
Examples of bus route data sheet.

DIR is the direction of a bus route; 1 and 2 were selected to describe.
Bus real-time travel speed estimation model
Framework of travel speed estimation model
The technique framework of GPS data–based bus travel speed estimation is shown in Figure 2. The model flow was divided into three parts including the data preparation and preprocessing, data matching and travel speed estimation, and travel speed correction. The road sections of adjacent bus stops were taken as the minimum processing unit for estimating bus travel speed. At first, the processed bus GPS data were matched with the bus GIS map data. In this procedure, with an assumed running direction, the bus GPS data were projected onto arc section in sequence, and the proportion of GPS projection point on the arc was estimated. Then, the continuity of the matched road sections was diagnosed, and the missing data will be complemented to estimate the bus arrival time at bus stops. By extracting the travel time and distance between adjacent bus stops, the travel speed could be calculated. Finally, in order to improve the precision of the speed calculation, a correction for the estimated result will also be conducted using speed thresholds of different road classes.
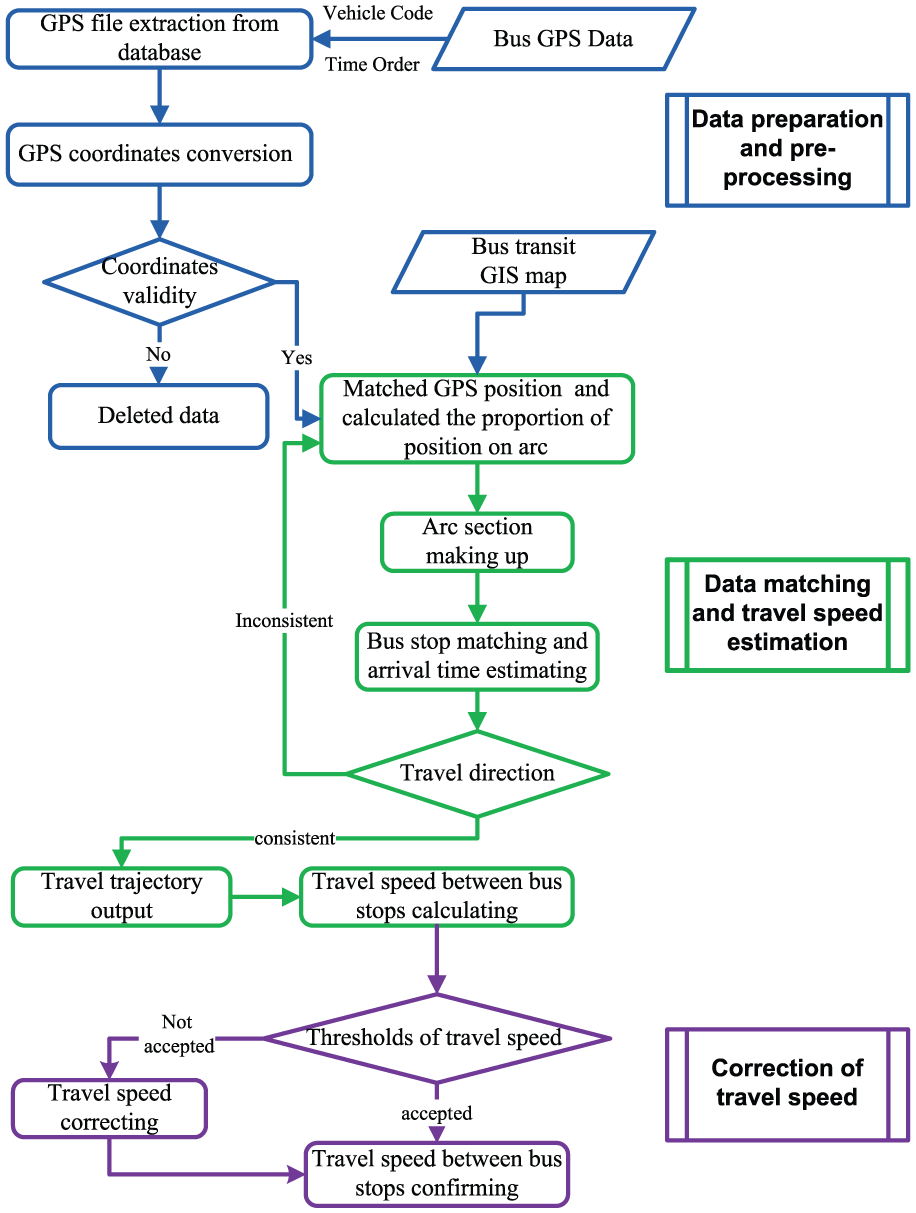
The technique framework of bus real-time travel speed estimation.
GPS data matching and travel speed estimation
The position of the bus GPS data was matched onto the bus stop/line GIS map, and the position of vehicles was determined to estimate the arrival time of the every vehicle from one bus stop to another, and then the bus travel speed can be calculated by distance and time interval. The model was implemented by the following five procedures:
1. Matching GPS data and calculating the position proportion on the arc. The same bus route in GIS map has two directions, so before matching the GPS data onto the GIS map, one assumed direction will be taken as the run direction in advance. According to the sequence of arc sections on the assumed bus travel direction, the GPS points were located onto the arc sections in GIS map, and the proportions of GPS location point position on the arc section were calculated. According to the data character, two rules should be followed in order to get higher matching probability.
Rule 1: If there were several given arc sections for one GPS point projection, the arc which had the minimal vertical distance to the point was matched with this point

where A is the arc matched with GPS point and dn is the vertical distance the arc to GPS point.
Rule 2: If the continuous unsuccessful matched GPS points were >4 on the assumed travel direction, it should be changed for the other direction and matched GPS points orderly again. It happened especially when the bus route had two different operation paths, as samples shown in Figure 3.
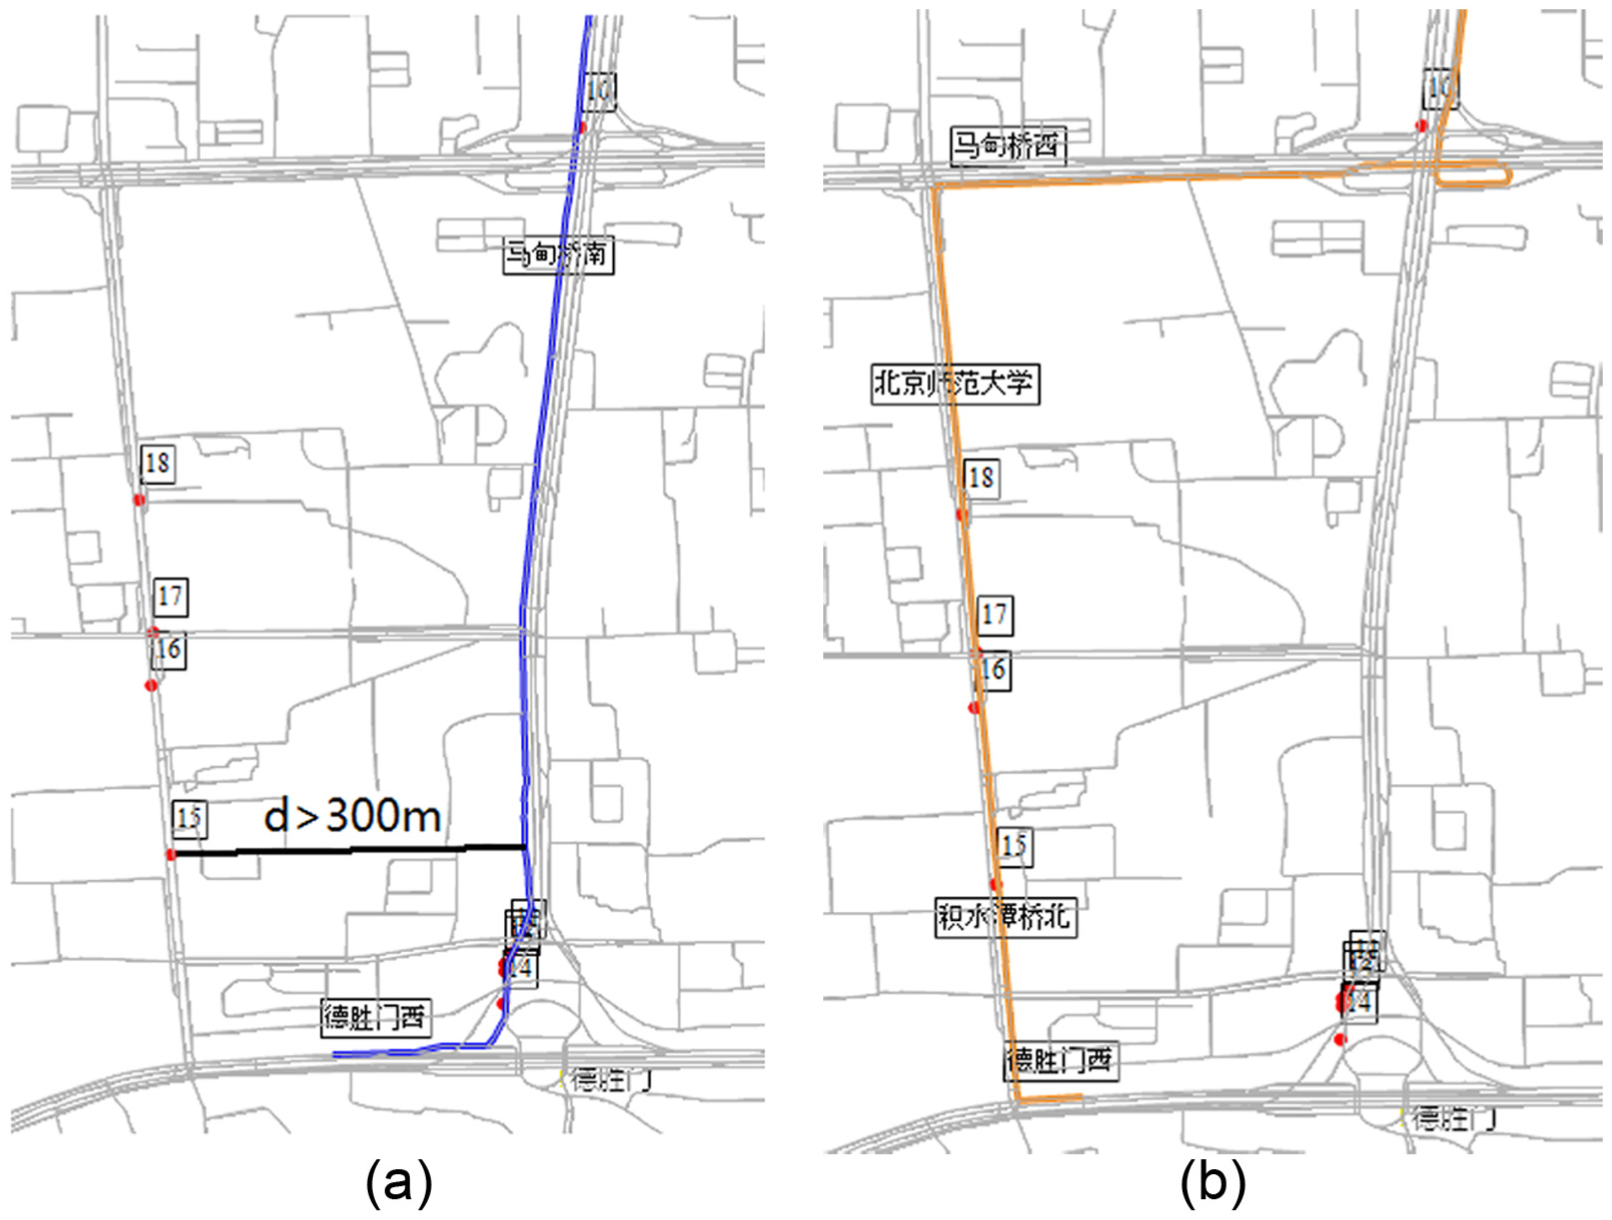
Scenarios of two directions in different paths of bus route: (a) the path to the north and (b) the path to the south.
The following equation (1) can be used to calculate the proportion of GPS projection point position on arc section

where
In general, the threshold of
Situation 1: When GPS point is near the origin stop, it can be projected to an extended line of the first arc section of bus route. As a result,
Situation 2: When GPS point is near the terminal stop, it can be projected to an extended line of the last arc section of bus route. As a result, the length of
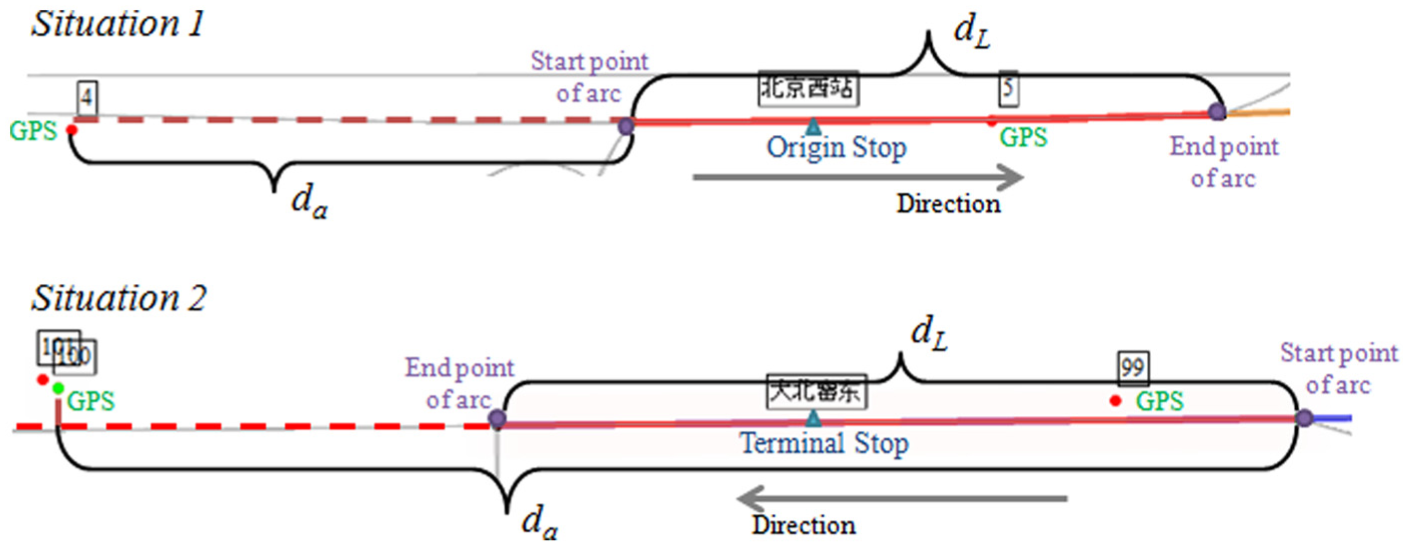
Special processing of GPS point around the origin stop or terminal stop.
2. Diagnosing the continuity of road arc and mending the missing sections. Since the returning signal of GPS data was often sheltered by surrounding buildings, the returned interval of two continuous GPS points would be >30 s, which could make matched arc sections being inconsecutive sequence.
Considering that ending point ID of the arc is same as the starting point ID of the next arc, the algorithm would diagnose the consecutive of arc sections which are matched with two continuous GPS points separately.
If the arc section sequence is discontinuous, and the relationship of two continuous GPS points does not meet the following two conditions, the missing sections should be mended:
If the time interval of two continuous GPS points is >10 min, the whole matched data should be discarded before the latter GPS point matching and taken the latter one as the first point to continue matching in the way of pervious steps.
Calculating the straight-line distance of two continuous GPS points, if the linear speed is ≥80 km/h, the latter GPS point should be regarded as an abnormal data.
3. Matching with the bus stop and estimating the bus arrival time. In the basis of arc sections making up, the bus stop could be determined by judging whether the bus stop is between two continuous GPS points. According to the positional relationship of stop site and adjacent GPS projection points, the bus arrival time could be estimated too. The different positional relationships are applied to different arrival time estimated methods, as shown in Figure 5.

Two scenarios of arrival time estimating.
Scenario 1: the GPS point is near stop site. When a bus stop has many bus routes, it often appears a queuing phenomenon caused by vehicles waiting to dwell. Moreover, bus stop platforms have a fixed length in general. Therefore, the study developed a stop area which refers to the 50 m distance in front of the stop site. If the GPS projection point is in this range, the return time Tn − 1 of GPS point will be regarded as the bus arrival time Ts. However, bus dwell time will be brought into the next travel time interval between bus stops.
Scenario 2: GPS projection point is outside the stop area. During the vehicle operation, the behaviors of accelerating or decelerating happen frequently. In order to process conveniently, the study established a hypothesis that the speed between two GPS points is even. As a result, if the GPS projection point is outside the scope of the stop area, the bus arrival time with the return time of two continuous GPS points is satisfied by the following proportional relation, as expressed by equation (2)
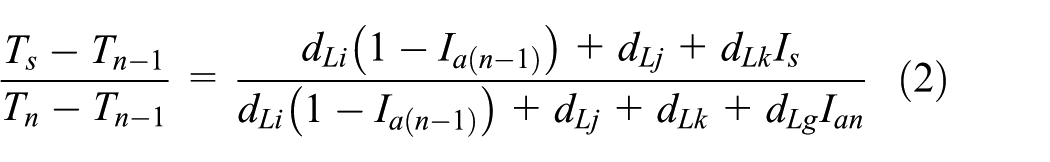
where Ts is the bus arrival time; Tn − 1 is the return time of n − 1th GPS point; Tn is the return time of nth GPS point; Is is the proportion of stop position on arc section, %; Ia(n − 1) is the proportion of n − 1th GPS point position on arc section, %; Ian is the proportion of nth GPS point position on arc section, %; and dL is the length of arc section whose ID is i, j, k, g, …, m.
4. Determining the travel direction of bus. When the numbers of stops which matched successful are equal to 2, we can judge the order of matched stops whether consistent with the direction assumed in procedure 1. If they are consistent, the model will output the vehicle travel trajectory data. On the contrary, if they are inconsistent, it would be changed to the assumed direction, cleared the data of arc sections that made up, returned the sequence of GPS points to the origin, and matched them orderly again from the procedure 1.
5. Calculating the travel speed between bus stops. Based on the vehicle travel trajectory data, the arrival time of each stop can be acquired by applying the methods in procedure 3. Combining with the distance of stops, the travel speed between adjacent bus stops could be calculated

The results of the estimation model of travel speed between bus stops are shown in Table 3. It mainly contained the specific information of every vehicle running in each stop interval, such as departure and arrival time and travel distance, time, and speed of adjacent bus stops. Moreover, in the results, the arrival time of each stop sections is same as the departure time of the next bus stop section, which indicates that consumption time of bus vehicles running on the road is divided into continuous bus stop sections completely.
Results of bus travel speed between adjacent stops.

DIR is the direction of a bus route; 1 and 2 were selected to describe.
Speed thresholds of bus travel speed
Because of the error of travel time estimating, some calculated speed values would exceed a reasonable speed range. Accordingly, considering the characteristics of vehicles running on the road in different classes, the study provided a set of discriminant thresholds for different road classes. The calculated value examined whether it exceeded the threshold of the corresponding classes using the following standard as shown in Table 4.
Thresholds of bus travel speed between stops for discriminant and correction.

If the calculated speed between bus stops exceeds the discriminant thresholds, two steps will be taken in the model produce. First, the travel time of abnormal bus stop section will combine with the adjacent stop section, and calculated travel speed of the adjacent bus stop sections based on combined time and distance.

where
Second, in order to obtain a reasonable bus travel speed, the speed value would be revised into the corresponding correction threshold value if the processed speed exceeds the correction thresholds.
Verification of travel speed estimation
Verification survey design
The design of the bus-following survey considered the temporal and spatial factors that probably affect the model calculation accuracy. The survey conducted in different time periods included the morning peak hours (7:00–9:00), off-peak hours, and evening peak hours (17:00–19:00). The bus lines which could reflect the status of bus operation conditions on the expressway, arterial road, secondary road, and branches, respectively, were selected as the survey bus routes.
The information recorded by the field bus surveyors includes the following fields:
Survey date, route code, and vehicle code of the following bus;
Travel time between adjacent bus stops: the surveyors record the departing time at origin stop and start timing. When the passengers alight from the bus, surveyors would stop timing and record the time cost of adjacent bus stops;
The mobile GPS receiver data.
The surveyors carry a mobile GPS receiver which has been set to record real-time location every 30 s to simulate the on-board GPS module. So, the manually collected GPS data could substitute for the bus GPS data to validate the accuracy, even if the vehicles did not install the GPS device.
The field bus survey captured a total of 966 valid samples of sections between bus stops. These samples were provided by 49 vehicle runs of 20 bus lines. The spatial and temporal distributions of sample sizes are presented in Table 5.
Sample distributions of investigated bus stop sections.

Precision of model
Error analysis of bus travel speed at stop level
Based on the survey data, the study used the mean absolute error (MAE) and mean relative error (MRE) to analyze the error state of estimating travel speed of bus stop sections of different road classes. The MAE reflects the deviation from the true value of actual size, and the MRE is the ratio of the MRE and the investigation value.
As shown in Table 6, there was no significant difference in MAE, and the range of MRE was from 10% to 16% for different road classes. The travel speed of bus stop sections distributed in expressway had the best estimated precision which was 90.2%. The MAE of total samples was 2.50 km/h, and the average precision was 88.4%.
Error analysis of estimated bus travel speed between stops of different road classes.

MAE: mean absolute error; MRE: mean relative error.
Error analysis of bus travel speed at route level
Travel speed of a bus line was the ratio of the entire route mileage and the travel time of a complete operation, which was calculated in the following equation

where VR is the travel speed of bus line; DR is the entire route mileage of a bus line, m; Te is the arrival time of terminal stop; and To is the departure time of origin stop.
The error analysis made in bus line speed of 49 surveyed vehicle indicated that the MAE was 0.75 km/h, and the MRE was 2.1%. Therefore, the model applied in estimating bus line speed could be considered in a higher precision, which can meet the demand of travel speed monitoring and operation reflection.
In order to verify the applicability of the estimated model for different time periods, the study compared the accuracy of the model processing the data received in different time periods. Taking the bus line 300 in Beijing as an example, surveyors captured 11 vehicle data on this route during the morning peak, off-peak hours, and evening peak hours, respectively. From the error analysis, the MREs of these three periods were 1.14%, 0.48%, and 0.19%. The conclusion can be drawn that the precision of estimating travel speed in different time periods is not significant. The model could be applied in different time periods as well.
Influence factors of error
The estimated error of arrival time
During the vehicles’ operation, delays generated because of intersections, building access, dwellings, and so on. The actual real-time speed is different even in an arc section, which is even assumed in the model. A case is presented in Figure 6. In this instance, there was a signal control intersection between bus stop and GPS projection point, and the actual value of Ts − Tn − 1 in equation (2) could be greater than the calculated value by model. Furthermore, an estimated error of arrival time was from the extraction of travel time between bus stops. The stable high-frequency GPS data could help to improve the accuracy of results.

Signal control intersection is between stop and GPS projection point.
Position deviation of stops marked in bus route data
The initial bus stop coordinate data were collected from the bus operation company. However, because of the route adjustment in the site and the positioning error of the original information, the stop position marked in bus route data may have error from the actual stop location. To grasp the actual stop position on map, surveyors had collected seconds reported data with the mobile GPS device by following buses. Matching seconds GPS points onto the map, as shown in Figure 7, the area of dense GPS points should be the actual position of stop, which was far from the marked stop in bus route data.

Stop position marked in bus route data is the deviation from real location.
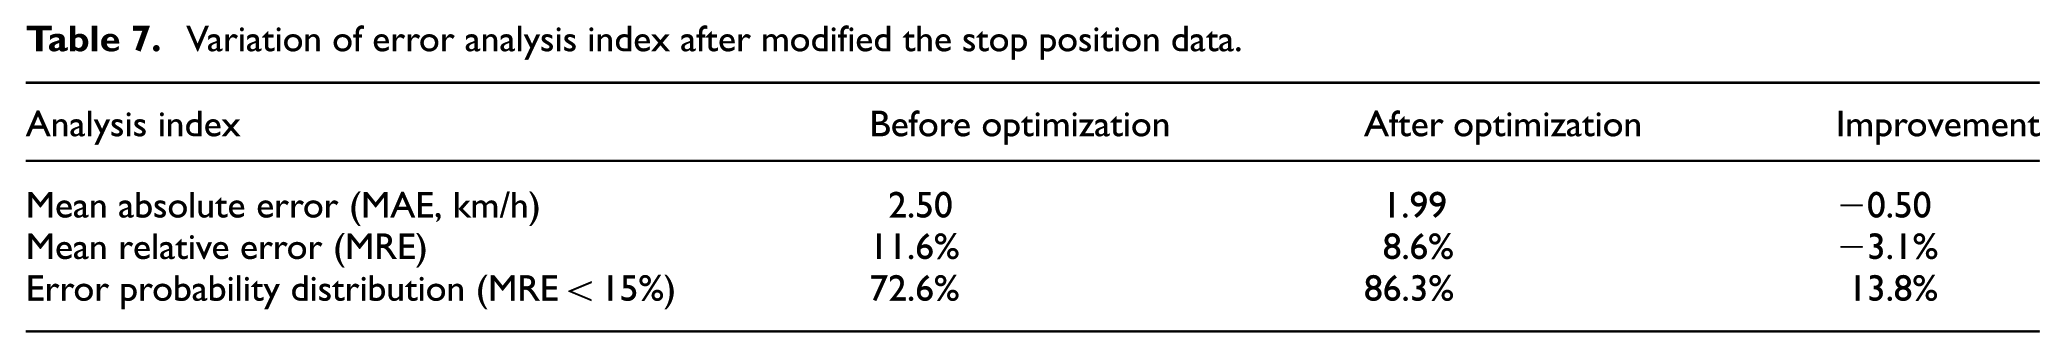
Making use of high-frequency GPS positioning data, the study checked the stop position marked in bus route data and modified the proportion of stop on the arc section. Table 7 shows the variation of error analysis indexes after modifying the bus route data. The estimation precision of travel speed between stops was improved to above 90% overall, and the MAE was <2 km/h. Consequently, the estimated results can reach the requirement of operation monitoring and service evaluation in general.
Variation of error analysis index after modified the stop position data.
Conclusion
This article proposed an approach to estimate bus travel speed based on continuous reported GPS data. The adjacent bus stop sections were taken as the minimum unit to estimate the travel speed. The real-time travel speed was calculated by GPS position matching and arrival time counted. The comprehensive field bus surveys were specially designed and conducted to validate the model accuracy and adapt ability on different classed roads, different time periods, and various days. A total of 966 valid samples of intervals between bus stops belonging to 49 vehicle runs of 20 bus routes were collected. By comparing the field observed values and calculate values of the model, this article revealed that estimation precision of travel speed between bus stops was 88.4%, and the estimation precision of bus line travel speed was 97.9%.
The results also showed that
The MAE of bus travel speed calculation model on different class roads was the same, almost 2.50 km/h. The higher the road classes where bus stops located, the smaller the MRE.
The precisions of bus travel speed calculation have no obvious fluctuation in different time of a day; which indicated that the proposed models had sound adapt ability.
In a further analysis, the estimation method of arrival time and the position deviation of bus stops marked in bus route data were considered as the main influence factors of error causing. After optimizing of model by correcting the bus route data, the estimation precision of travel speed between bus stops was improved to 91.4%, and the MAE is <2.0 km/h.
Certainly, as the fundamental indicator, the bus travel speed is still not enough for the bus transit operation monitoring and evaluation. Based on the travel speed classification, several bus travel index analysis models including the bus rapid index and bus reliability index are still carried on in our research. These travel indicators will build a stronger evaluation index system and make a comprehensive evaluation for public transit operation.
Footnotes
Academic Editor: Yongjun Shen
Declaration of conflicting interests
The author(s) declared no potential conflicts of interest with respect to the research, authorship, and/or publication of this article.
Funding
The author(s) disclosed receipt of the following financial support for the research, authorship, and/or publication of this article: This work was supported by the National Natural Science Foundation of China (NFSC; no. 51578028), the Ministry of Transport of the People’s Republic of China with no. 2015318221020, and the Ministry of Industry and Information Technology of P. R. China under the Major Program of National Science and Technology with no. 2013ZX01045-003-002.