
Abstract
The main purpose of this study was to investigate the influence of air-injection technique on unsteady cloud cavitating flow dynamics. High-speed camera and pressure measurement system are used to record ventilated cavitation images and wall-pressure fluctuation in a convergent–divergent channel, respectively. The measured ventilated cavitation evolution process and corresponding wall-pressure fluctuation are compared with those obtained under non-ventilation condition. The results show that air-injection technique can significantly suppress pressure pulses induced by cavity collapse. Furthermore, by increasing ventilation rate, the time evolution of cavitation tends to be more stable, the wall-pressure fluctuation magnitude is reduced significantly, and the cloud shedding frequency is reduced, which is believed to be related to the interaction between injected air and re-entrant flow.
Introduction
In high-speed fluid machinery, cavitation usually occurs if the local pressure drops below the vapor pressure; consequently, gas-filled and vapor-filled cavities can be formed. Chen et al. 1 measured more pressure pulses with the magnitude of the order of several atmospheres in cloud cavitating flows. In engineering field, cavitation can cause vibration, erosion, and noise due to the production of strong unsteady phenomena, such as quasi-periodic cavity shedding behaviors in cloud cavitation.2–4
With the decrease in the cavitation number, inception cavitation, sheet cavitation, cloud cavitation, and supercavitation are obtained accordingly. 5 Sheet/cloud cavitation always shows the most severe instabilities; thus, the unsteady characteristics of sheet/cloud cavitation have been investigated experimentally by many researchers in cavitation tunnels.6,7 Two-dimensional venturi-type sections, cylinder, and two-dimensional foil are frequently used to investigate unsteady sheet/cloud cavitating flows.8–12
When non-condensible gas appears in a single cavitation bubble, the collapse rate will be reduced, and the collapse process will not be that violent. 2 Thus, the injection of air in the cavitation region can reduce the noise and damage potential. In recent years, air-injection method has been used to investigate its influence on unsteady cavitating flows. For example, Ukon 13 and Arndt et al. 14 performed air-injection tests using a stationary hydrofoil and found some reduction in the mean square hydrophone signal in the 10–30 Hz band. Pham et al. 15 performed air injection in the suction side of a hydrofoil to suppress re-entrant flow, and it is found that the unsteadiness of cavitating flow is reduced. Wang et al. 16 performed air injection in the unsteady cavitating flows around underwater vehicle, and the influence of air injection on cavity collapse is investigated. Yu et al. 17 found that the unsteadiness of cavitating flow is adjusted due to the interaction between air and re-entrant flow.
However, the influence of air injection on pressure fluctuation in cloud cavitating flows is still not clear. Thus, in this article, air-injection method is applied to investigate the influence of air injection on pressure fluctuation in cloud cavitating flow. The influence of air volumetric flow rates on pressure fluctuation is also discussed. It is found that pressure fluctuation magnitude and frequency are changed significantly due to air injection in cloud cavitating flow.
Approach and setup
The experiments are carried out in a cavitation tunnel in Beijing Institute of Technology. 18 Figure 1 presents the schematic representation of the cavitation tunnel. As shown, in order to reduce the likelihood of pump cavitation, an axial flow pump is located about 5 m below the test section. A tank with a volume of 5 m3 is placed in upstream part of the test section to separate undesired gas dissolved in water. A vacuum pump is connected to the top of the tank to control the pressure in the test section. A corner cane and a straightening vane are used to reduce the turbulence level in the pipeline between test section and the tank.

Schematic representation of the cavitation tunnel.
As shown in Figure 2(b), cavitation shape and pressure fluctuation are measured in a rectangular test section of 70 mm in width and 190 mm in height. There are two windows which are located at the top and the side, respectively. The windows are made of Perspex for observation. A triangle test model is installed on the bottom wall to form a convergent–divergent channel; the convergent and divergent angles are 20° and 10°, respectively, and the contraction ratio is 0.5. The time evolution of cloud cavitation generated behind the throat of the channel can be observed from both top and side windows. As illustrated in Figure 2(a), the wall-pressure fluctuations in unsteady cavitating flows are measured by piezo-electric transducers installed flush with the wall surface. The width and length of ventilation slit are 2 and 40 mm, respectively. The ventilation slit is connected to air chamber, and the air chamber is connected to ventilation pipe. The schematic representation of ventilation system is shown in Figure 3; the main components include gas supply, pressure-regulating system, and flow measurement devices. In this system, the ventilation pressure and speed could be freely adjusted to control unsteady cavitating flows, and the volumerical flow rate could be accurately measured by the rotameter.
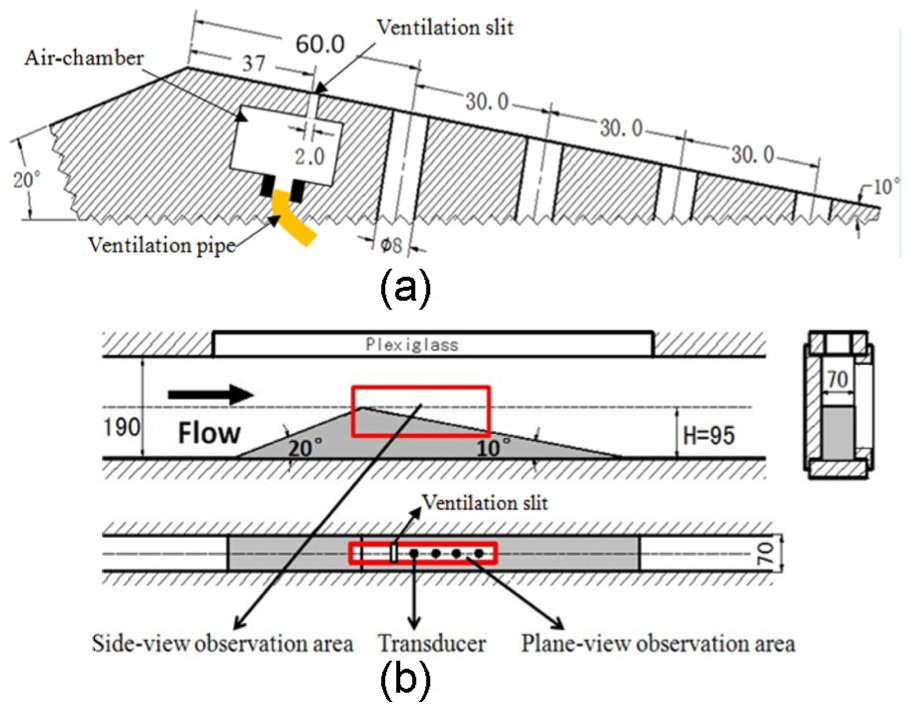
Transducer mounting and schematic representation of test section (units in mm): (a) transducer mounting and ventilation slit and (b) schematic representation of test section and test model.
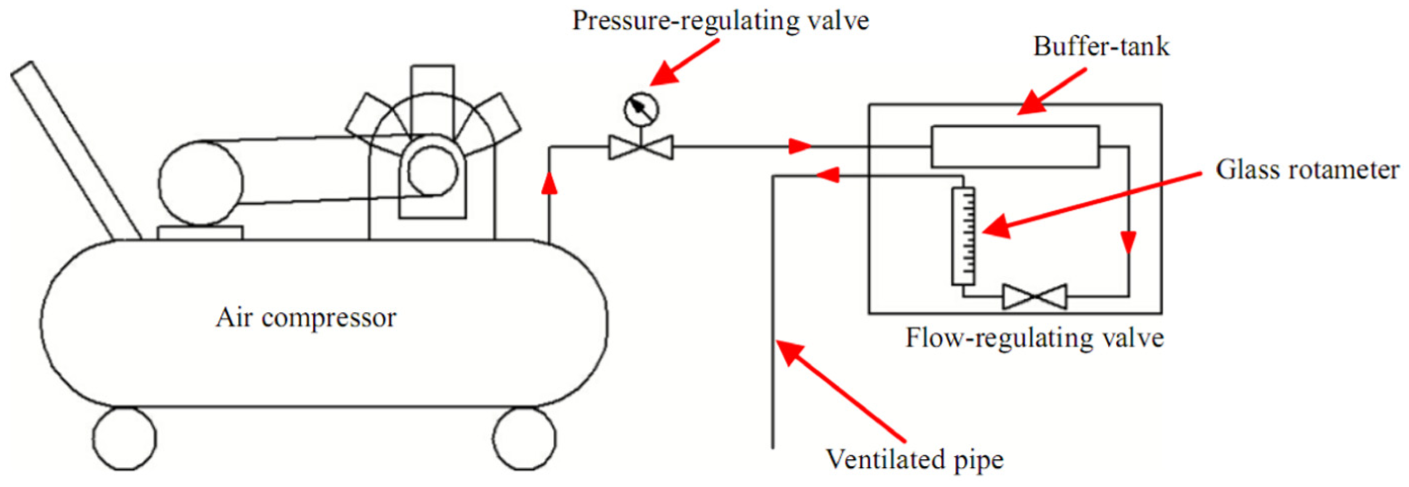
Schematic representation of ventilation system.
The time evolution of cloud cavitation is documented by a high-speed digital camera; the maximum recording rate can be up to 105 fps. 19 In order to maintain desirable spatial resolutions, 3000 and 1500 fps are used for natural cavitating flow and ventilated cavitating flow, respectively.
The unsteady pressure fluctuations are measured by four piezo-electric pressure transducers (sensibility is 7.3 mV/kPa). 20 A data acquisition board is used to transform the output of transducers into digital values; according to the focus of the investigation, 1.024 MHz is chosen in this study.
In the experimental study, the definition of non-dimensional ventilation rate, Reynolds number, and cavitation number are given below, respectively


where Qin, d, H, Ut,
Experimental results and discussion
The unsteady behaviors are most severe in cloud cavitating flows, and the pressure pulses induced by cavity collapse can be as large as several atmospheres, which are mainly responsible for vibration, noise, and erosion. It is believed that air-injection method can be helpful in the reduction in pressure fluctuation and corresponding adverse effect.
The time evolution of cloud cavitation under different ventilation rates is given in Figure 4. The typical attached cavity growth and shedding process in natural cloud cavitating flow are shown in Figure 4(a). The time evolution of natural cloud cavitation is similar to those reported in previous studies; however, due to the decrease in flow velocity and cavitation number, the largest attached cavity length becomes longer. As shown in Figure 4(b), when Qv = 1.135×10⁻³, the pattern of cloud cavitation evolution process is changed, the size of cloud cavitation increases, and the position where attached cavity breaks up moves downstream, and the intensity of cavity fluctuation is reduced. As shown in Figure 4(c), when Qv = 2.27×10⁻³, the time evolution of attached cavity becomes more stable, but cavity shedding still exists in the rear of attached cavity.

Bird’s view of cloud cavitation evolution process under different ventilation rates: (a) σ = 0.7, Qv = 0; (b) σ = 0.7, Qv = 1.135 × 10⁻³; and (c) σ = 0.7, Qv = 2.27 × 10⁻³.
The cavitation areas under different ventilation rates are extracted to illustrate the time evolution of cavitation shape. Sc is area of throat section which is used to calculate non-dimensional cavitation area. As shown in Figure 5, as the non-ventilation rate increases, the cavitation area tends to be larger, and the fluctuation period tends to be longer.

Non-dimensional cavitation area fluctuation under different ventilation rates.
In order to investigate the influence of air injection on pressure pulses induced by cavity collapse, Figure 6 gives the pressure fluctuation under both natural cloud cavitating flow and ventilated cloud cavitating flow. In order to capture pressure pulse, the sampling frequency of pressure signal is set to be 1.024 MHz.

Influence of air injection on pressure pulses: (a) σ = 0.7, Qv = 0 and (b) σ = 0.7, Qv = 2.27 × 10⁻³.
As can be seen in Figure 6(a), when Qv = 0, more pressure pulses are captured during 4.5 s. The occurrence number of pressure pulses is largest on transducer 4# because it is near the rear of attached cavity and the region where cavity collapses. However, as shown in Figure 6(b), when Qv = 2.27 × 10⁻³, no pressure pulses are captured by transducers. This comparison proves that air-injection method is sufficient to reduce the adverse effects induced by pressure pulses. The characteristics of pressure pulses are discussed in detail by Chen et al. 1
In order to investigate the influence of air-injection method on quasi-periodic pressure fluctuation in cloud cavitating flow, Figure 7 presents the pressure fluctuation (dynamic pressure) and standard deviation under different ventilation rates. As shown in Figure 7(a), when Qv = 0, the pressure fluctuation shows clear periodical characteristic which is consistent with the periodical development of cloud cavitation. As shown in Figure 7(b), when Qv = 1.135 × 10⁻³, the magnitude of pressure fluctuation is reduced a lot, and the pressure fluctuation is still periodic, but the period of pressure fluctuation tends to be longer than that in Figure 7(a). As shown in Figure 7(c), when Qv = 2.27 × 10⁻³, the magnitude of pressure fluctuation becomes even smaller, and the pressure fluctuation period also becomes even longer. The magnitude of pressure under different ventilation rates is also presented in Figure 7(d); as the ventilation increases, the magnitude of pressure fluctuation reduces significantly.

Pressure fluctuation and its standard deviation under different ventilation rates: (a) σ = 0.7, Qv = 0; (b) σ = 0.7, Qv = 1.135 × 10⁻³; (c) σ = 0.7, Qv = 2.27 × 10⁻³; and (d) standard deviation of pressure fluctuation.
As shown in Figure 8, fast Fourier transform is further conducted to obtain the power spectral density of pressure fluctuation under different ventilation rates. When Qv = 0, dominant frequency exists at 10 Hz which corresponds to the attached cavity growth and shedding process. When Qv = 1.135 × 10⁻³, dominant frequency is reduced to 8 Hz, and the reduction in dominant frequency is believed to be highly related to the interaction between injected air and re-entrant flow. When Qv = 2.27 × 10⁻³, dominant frequency is further reduced to 3 Hz, but secondary dominant frequency also exists at 8 Hz. It can be concluded that the dominant frequency of pressure fluctuation decreases with the increase in ventilation rate. There are two reasons which are responsible for the reduction in dominant frequency. First, re-entrant jet is widely believed to be the main reason for attached cavity shedding; however, when air is injected into the cavitating flow, the movement of re-entrant jet may be slowed down. Second, as the air is injected into the cavitating flow, the thickness of attached cavity becomes larger, which means that it becomes more difficult to cut through.

Power spectral density of pressure fluctuation under different ventilation rates: (a) σ = 0.7, Qv = 0; (b) σ = 0.7, Qv = 1.135 × 10⁻³; and (c) σ = 0.7, Qv = 2.27 × 10⁻³.
Conclusion
In this study, the influence of air injection on unsteady cavitating flow and corresponding wall-pressure fluctuation characteristic is investigated experimentally. High-speed visualization system and pressure measurement system are used to record ventilated cavitation images and wall-pressure signals in a convergent–divergent channel. The measured ventilated cavitation evolution process and corresponding wall-pressure fluctuation are compared with those obtained under non-ventilation condition. The results show that air-injection technique can significantly suppress pressure pulses induced by cavity collapse. Furthermore, by increasing ventilation rate, the time evolution of cavitation tends to be more stable, the wall-pressure fluctuation magnitude is reduced significantly, and the cloud shedding frequency is reduced which is believed to be related to the interaction between injected air and re-entrant flow.
Footnotes
Acknowledgements
The authors gratefully acknowledge the help received from Prof. Guoyu Wang, Prof. Mindi Zhang, and Prof. Biao Huang during the experiment in Beijing Institute of Technology.
Academic Editor: Yuning Zhang
Declaration of conflicting interests
The author(s) declared no potential conflicts of interest with respect to the research, authorship, and/or publication of this article.
Funding
The author(s) disclosed receipt of the following financial support for the research, authorship, and/or publication of this article: This study is financially supported by the National Natural Science Foundation of China (NSFC; grant nos 11172040 and 51306020).