
Abstract
Typical railway wheelsets consist of wheels, axle and axle bearings. Faults can develop on any of the aforementioned components, but the most common are related to wheel and axle bearing defects. The continuous increase in train operating speeds means that failure of an axle bearing can lead to serious derailments, causing loss of life and severe disruption in the operation of the network, damage to the track and loss of confidence in rail transport by the general public. The rail industry has focused on the improvement of maintenance and remote condition monitoring of rolling stock to reduce the probability of failure as much as realistically possible. Current wayside systems such as hot axle box detectors and acoustic arrays may fail to detect defective bearings. This article discusses the results of wayside high-frequency acoustic emission measurements performed on freight rolling stock with artificially induced damage in axle bearings in Long Marston, UK. Time spectral kurtosis is applied for the analysis of the acoustic emission data. From the results obtained, it is evident that time spectral kurtosis is capable of distinguishing the axle bearing defects from the random noises produced by different sources such as the wheel–rail interaction, braking and changes in train speed.
Introduction
Due to the demand for safe and high-speed rail transportation, rolling stock wheelsets with increasing axle loads and usage require rigorous and reliable inspection and maintenance. While in service, wheelsets operate under harsh working conditions including rolling contact fatigue (RCF), thermal variations and dynamic impact forces. Gradual deterioration of the structural integrity of the wheels can increase the risk of failure and the possibility of delays, unnecessary costs and derailments. 1 Increased levels of vibration, noise and temperature produced by the axle bearing are signs of a developing defect. Acoustic emission (AE) and vibration analysis techniques can be used for continuous remote condition monitoring of axle bearings.
The axle bearing transmits part of the weight of the carriage directly to the wheelset. In the rail industry, bearings are considered to be critical mechanical components. Defects in bearings, unless detected in time, can result in catastrophic failure. The presence of a defect in an axle bearing can cause significant changes in the vibration and AE levels. Therefore, it would be advantageous to have a wayside system to measure AE and vibration signals in order to detect evolving axle bearing faults in time. In this way, potential disruption can be kept to a minimum allowing for repairs to be carried out during scheduled maintenance, thus maximising reliability, availability, maintainability and safety (RAMS). 2
Bearing defects can be classified either as distributed or local. Distributed defects such as surface roughness, waviness and variation of contact force between rolling elements can increase the amplitude of vibration and AE signals. Localised defects such as cracks, pits and spalls can generate a pulse of vibration or AE, which can be monitored to detect the presence of the defect in the bearing.3,4
Direct detection of bearing vibration signals and spectral analysis of vibration signals from defective bearings in steady-state rotating machinery is a well-developed technology and widely used in many industries. Examples of these applications are electrical motors and industrial pumps in refineries. Yet wayside detecting train wheel bearing with vibration analysis has not been successful, largely due to the fact that moving trains operate under stochastic loading conditions rather than steady state which are a function of train speed, weight, condition of wheel tread, rail head geometry, surface roughness and friction.
Railway wayside monitoring technologies
A severe axle bearing fault will lead to temperature rise due to additional heat produced by frictional interactions during rotation. Hot axle box detectors (HABDs) are the most common condition monitoring system type deployed track side in order to identify faulty overheating axle bearings in-service. HABDs are not capable of detecting damage in axle bearings at its early stages, since minor faults do not cause an increase in the temperature of the damaged bearing. In most cases, faults become detectable only once the axle bearing damage has reached a critical level and minutes before the affected wheel seizes to rotate. HABDs are prone to false alarms while in some cases they may be unable to detect faulty overheating bearings due to environmental condition effects from the surroundings of the bearing concerned. 5 Due to their high cost, the number of HABDs deployed along a line depends on the budget available to procure and maintain such systems. Normally, HABDs are installed at locations where trains travel at their maximum speed. The distance between HABDs is carefully determined based on the train speed and estimated time that an axle bearing would need in order to fail just after passing a checkpoint. The maximum spacing between HABDs should be such so as the train is able to reach the next checkpoint before failure occurs and result in a derailment. 6
Trackside acoustic array detectors (TAADS) employ arrays of microphones to monitor the audible noise produced by the axle bearings of passing rolling stock. The operating frequency of the microphones is normally 22–44 kHz which means they will be prone to errors arising from background noises as well as the measured train itself (e.g. wheel flats or noise from the engine). 7 There are a number of commercial products available such as RailBAM and Trackside Acoustic Array Detection System (TAADS). Acoustic arrays can improve measurement reliability by potentially being able to detect axle bearing faults at earlier stages. However, it has been difficult for the authors of this study to find satisfactory scientific evidence that proves the operational capability of these systems in the available literature.
Impact loads generated from the wheels of the train are detected using wheel impact load detectors (WILDs). Such systems, apart from alerting the train drivers of any wheel tread and excessive loading-related problem detected in time so appropriate action can be taken, they also help prevent structural damage on the rails. Most WILD systems are based on the use of strain gauges micro-welded on the surface of the rail web. However, some systems may use accelerometers instead. 8
Wheel profile detectors (WPDs) are based on the use of scanning lasers or cameras in order to control the exact profile of the wheel tread. The data obtained can then be compared against a standard profile without any wear or defect. The use of WPDs eliminates the need for manual profile inspection. 9 Both WILDs and WPDs have proven their reliability in the field already. However, these techniques are not capable of monitoring railway axle bearings.
Despite being beneficial, conventional wayside monitoring techniques currently employed by the railway industry are expensive. Therefore, the development of a reliable and efficient condition monitoring system capable of diagnosing axle bearing faults at an early stage still remains of interest to the railway infrastructure managers and rolling stock operators around the world. 10
AE detection
High-frequency AE in structural health condition monitoring is defined as the generation of elastic waves made by a sudden redistribution of molecules inside or on the surface of a material. When an external stimulus such as temperature or load is present, the released energy will be in the form of stress waves and can be recorded by sensors. In recent years, there has been progress in online predictive maintenance of rotating machinery within oil, gas and maritime industries. These advances have led to a reliable technique based mainly on trending of vibration signatures and occasionally on AE. 11
High-frequency AE can provide feedback about axle bearing defects, but signal processing needs to be employed in order to remove unwanted noise produced from the engine, wheel–rail interactions, train deceleration and acceleration. 8 Time series AE signals can be used to diagnose faults by analysing vibration or AE data and the use of statistical parameters such as moving root means square (RMS), moving crest factor, skewness and moving kurtosis. 8 However, these methods do not provide information in frequency, which can result in certain smaller faults being underestimated or missed. In this article, a new application of time spectral kurtosis (TSK) is described, which is able to deliver information in both time and frequency domains.
Definition of kurtosis
Kurtosis is a word of Greek source meaning bulging or swelling. It relates to the degree of sharpness of peaks in a signal, being a measure of the relative peakedness or flatness of a distribution compared to a normal distribution. For a healthy rotating machine, the kurtosis value is close to 3. Any value greater than 4 indicates the presence of a fault which may lead to a failure in the system. 3
To find the kurtosis, the difference between each value and the average of all the values is calculated

The calculation formula for kurtosis is K = µ4/σ4 where µ4 is the fourth moment about the mean and σ4 is the fourth moment about standard deviation of the signal

In order to detect the presence of a defect, a threshold can be applied (e.g. greater than 4), and any value above this threshold identifies a problem in the system. 12
TSK
Spectral kurtosis (SK) is an analysis technique of measuring kurtosis values in specific frequency bandwidths, whereas TSK is capable of demonstrating the signal in three axes: time, frequency and kurtosis amplitude. The TSK technique can indicate not only the transients in frequency domain but also their locations in the time domain. 5 Defects in rolling element bearings, which are usually similar to short impulses caused by the impact from the defect, can be determined using the TSK technique. The kurtosis value of a normal distribution signal is around 3. A value greater than 3 indicates peaks which are related to AE activities caused by defects in the signal. 13 However, false detections can occur when processing signals collected from wheel-bearings from in-service trains. These errors can be caused by impulses arising from random sources reducing the overall ability of TSK to detect bearing faults. 14 TSK is rarely used despite being appropriate for fault detection. This could be because it has not been clearly defined or the methods were not completely understood. 15 To determine the SK, the signal is passed through a set of band-pass filters and then the kurtosis values of the filtered signals are calculated. 13
Laboratory testing
AE monitoring reported in this work has been carried out using passive high-frequency (>100 kHz) resonant piezoelectric transducers (R50a model produced by Physical Acoustics Corporation, USA). AE sensors signals are amplified using a pre-amplifier and an amplifier also procured from physical acoustics corporation (PAC) before being digitised using an Agilent 2531A data acquisition card. Sampling frequency for both laboratory and field experiments were 500 kS/s. The acquired data are then sent to the PC where they are logged and stored awaiting further processing. The logging and signal analysis software have been written in MATLAB®. Laboratory experiments were carried out to simulate real conditions.
Figure 1 shows a motorised trolley carrying a test wheel (wheel diameter 0.16 m) with a metal build-up defect (0.01 m length) on the 7-m-long test track owned by the University of Birmingham.

Experimental work with motorised trolley.
During testing, the speed was set to be constant at approximately 2.5 m/s using a motor controller. Figure 2 demonstrates the raw AE signal acquired from the test wheel. The peaks seen in the raw data are related to the metal build-up defect impacting on the rail head surface every time the wheel completes a revolution. The peak seen at 2.9 s has higher amplitude because this is where the wheel passed directly above the sensor. An AE source closer to the sensor has lower attenuation and therefore higher energy although this is also dependent on the dynamic forces associated with each impact event.

Raw AE wayside measurement during testing with the motorised trolley.
Figure 3 demonstrates the result of the TSK processing and indicates a great rise in kurtosis values in frequencies about 100 kHz at 2.9 s. This clearly shows that TSK analysis is capable for wheel defect detection.

TSK analysis of the AE wayside measurement from the testing with the motorised trolley.
Field experiments
The customised wayside monitoring system is based on a set of AE sensors mounted on the rails, connected to a data acquisition unit and a data processor module installed trackside. The data were recorded after automatically triggering the system to acquire as the train neared the instrumented section of the track.
Wheel and rail form a direct mechanical path for the AE signals produced from the bearing to be transmitted to the AE sensors mounted on the rail, that is, the detection zone. Detecting bearing defect signals transmitted via this direct mechanical path provides more accurate results compared to airborne acoustic detection because it eliminates adverse effects of surrounding noises and other environmental parameters, such as wind and aerodynamic forces. Moreover, the signals acquired contain high-frequency information which makes detection of faults more likely.
Figure 4 shows the installation outline of the wayside tests carried out in Long Marston. The tank freight wagon containing the three faulty bearings was towed by a locomotive as shown in Figure 5. The faulty bearings were only at the same side of the second, third and forth wheelsets of the freight wagon with 2, 4 and 8 mm roller defects, respectively. Tests were carried out at up to a maximum speed of 48 km/h over a straight section of welded track approximately 1000 m in length. The sampling rate for AE signals was 500 kS/s and the duration of the acquisition was set at 12 s.
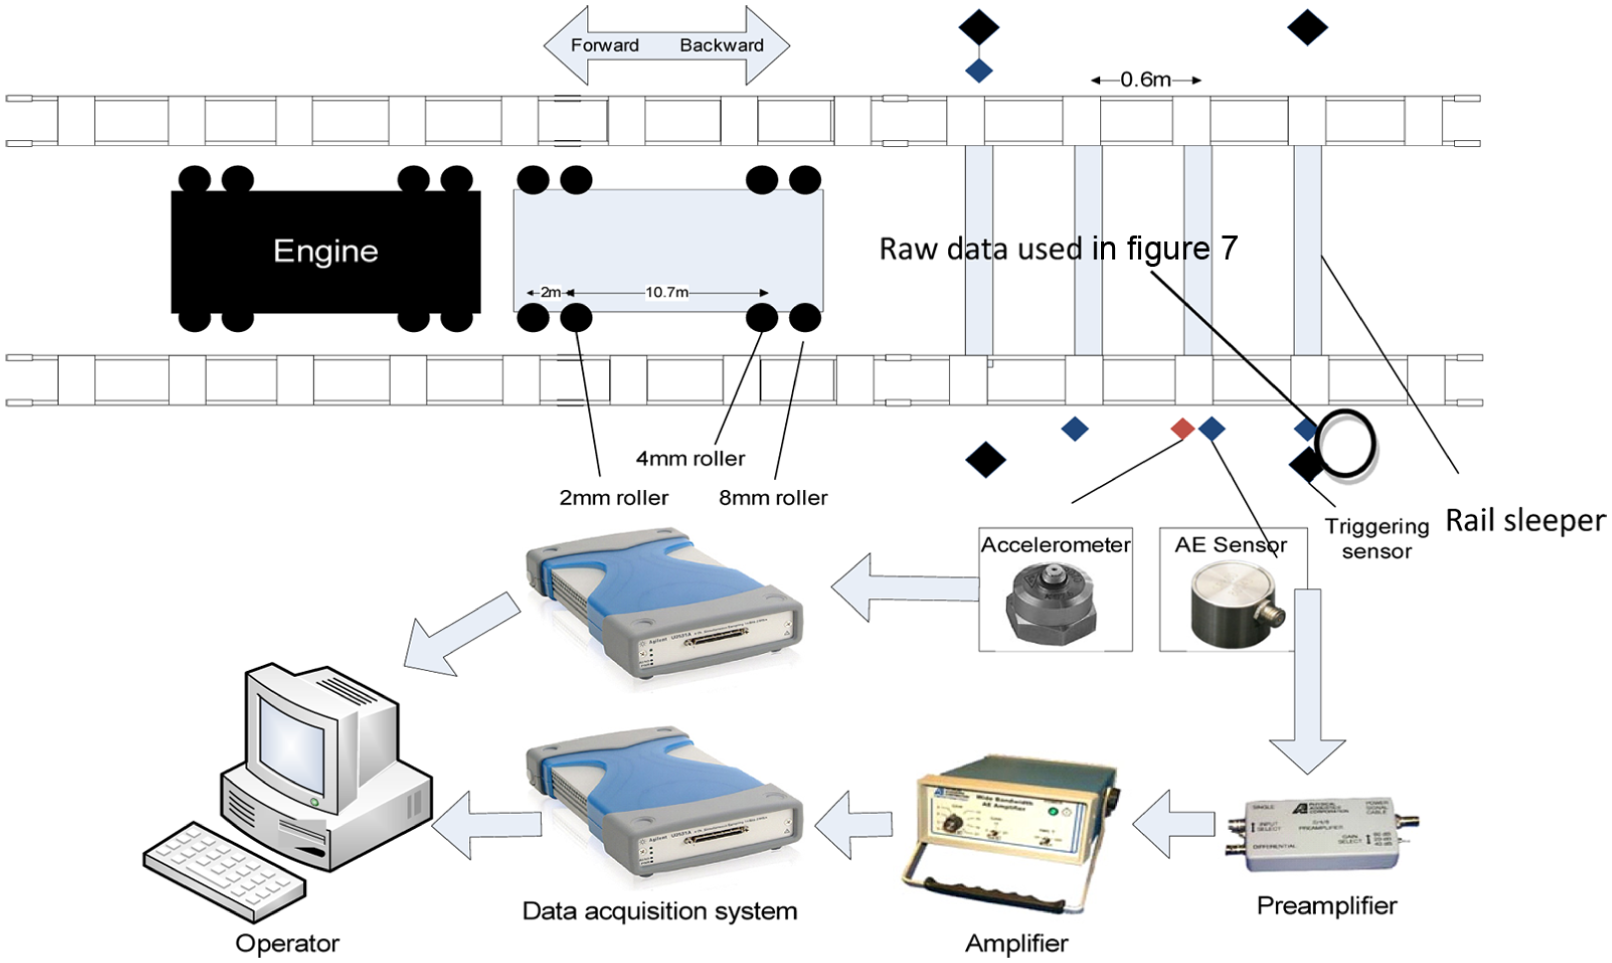
Simplified outline of the wayside installation configuration.
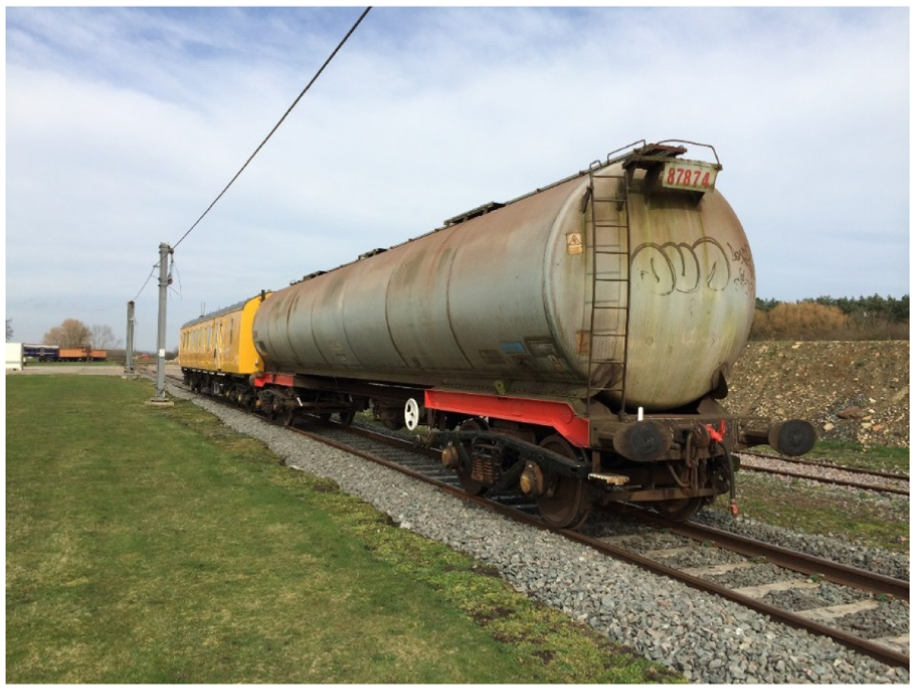
The Long Marston testing configuration. The yellow locomotive pulling the test freight wagon can be seen in the back.
An optical unit capable of measuring the speed of the train and counting the number of wheelsets was employed in order to correlate AE signals with the position of the wheels. The optical unit was also used to trigger the data acquisition unit to acquire data while the train was passing through the detection zone. As the system was also counting the number of axle boxes, it is possible to truncate the AE signal exactly at the time that each wheelset passes through the detection zone. This method saves a vast amount of data as the high sampling rate requires a large volume of physical memory to be available. This also makes the analysis period shorter.
Figure 6 shows the raw data from one of the AE sensors used in the wayside measurements during the Long Marston field trials. The red lines indicate the moment that the wheelset passed above this particular AE sensor. When the roller defect impacts on the bearing load zone, the amplitude is higher. Therefore, the recorded amplitude of a particular defect might vary during each rotation. As a result, the peak from impact may not necessarily be at the exact time when the wheel is passing on top of the sensor. The signal amplitude recorded by the AE sensors is related to the distance between source and sensor. The higher the distance, the more the AE signal will be attenuated. From the plot in Figure 6, it can be seen that bearing defects produce high-amplitude acoustic waves while passing above the sensors at 5.45 and 6.38 s. The engine noise is another source of high-amplitude AE in the raw data. In addition, the noise with a long duration at 7.44 s has been identified to have arisen due to braking. This peak was observed after the train had already passed the detection zone.
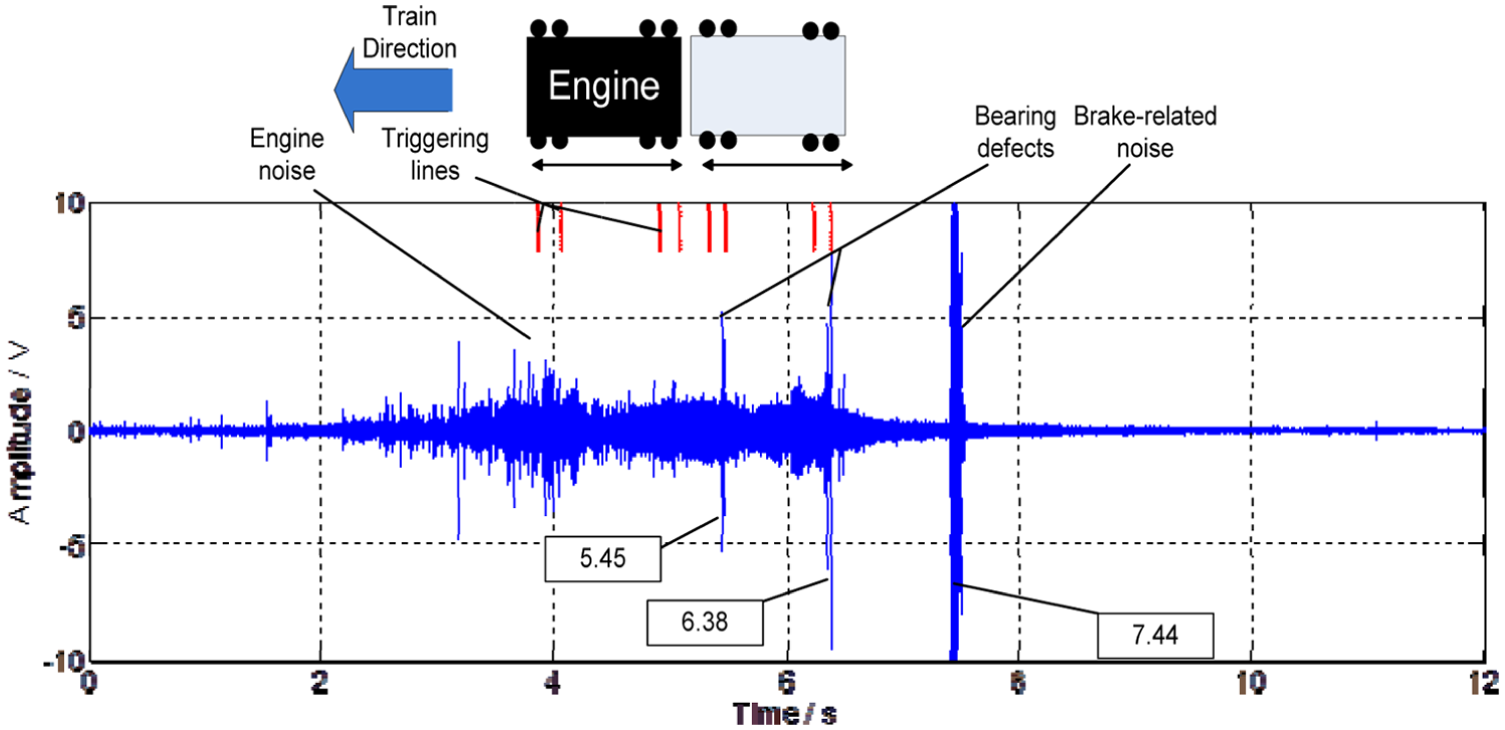
Raw AE data from wayside field test.
Moving RMS and moving kurtosis are time domain signal processing methods, which are applied to the AE data. The results are shown in Figure 7. In the moving RMS, bearing defects are clearly evident with higher amplitude compared to the engine noise although the amplitude of the peak arising from the braking event is still high. The amplitude of the braking-related noise is reduced in the moving kurtosis analysis. However, in this case, the amplitude of the engine noise is increased. The bearing defects are detectable in both of these analysis methods, therefore combining the moving RMS and kurtosis can improve the results. The window size for moving RMS and kurtosis are based on one RPM. The train speed was 48 km/h and therefore a window size of 11,750 samples was chosen in this experiment as described by the following calculation

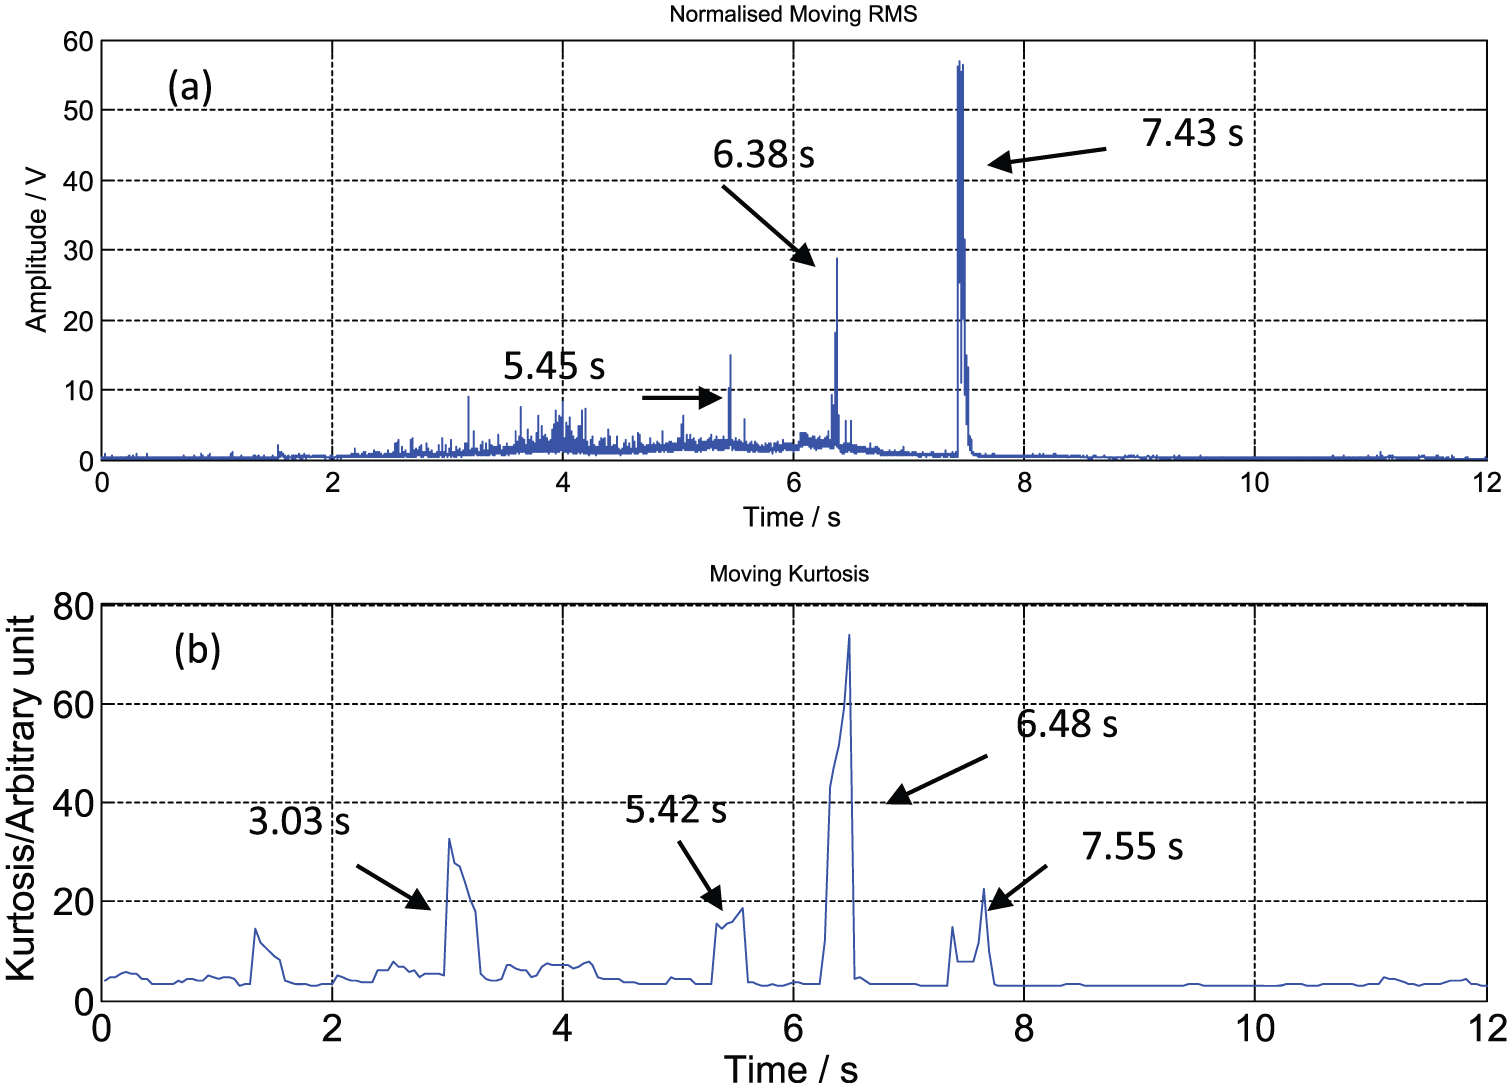
(a) Moving RMS and (b) moving kurtosis diagrams of wayside AE measurement.
By truncating the signal around the wagon passing time, the only remaining peaks are the ones indicating the bearing defects, although this can be affected by the braking-related noise.
Figure 8 shows the truncated signal between 5 and 7 s in the time axis. The time difference between the peaks (0.93 s) confirms the distance between the 2- and 8-mm roller defects

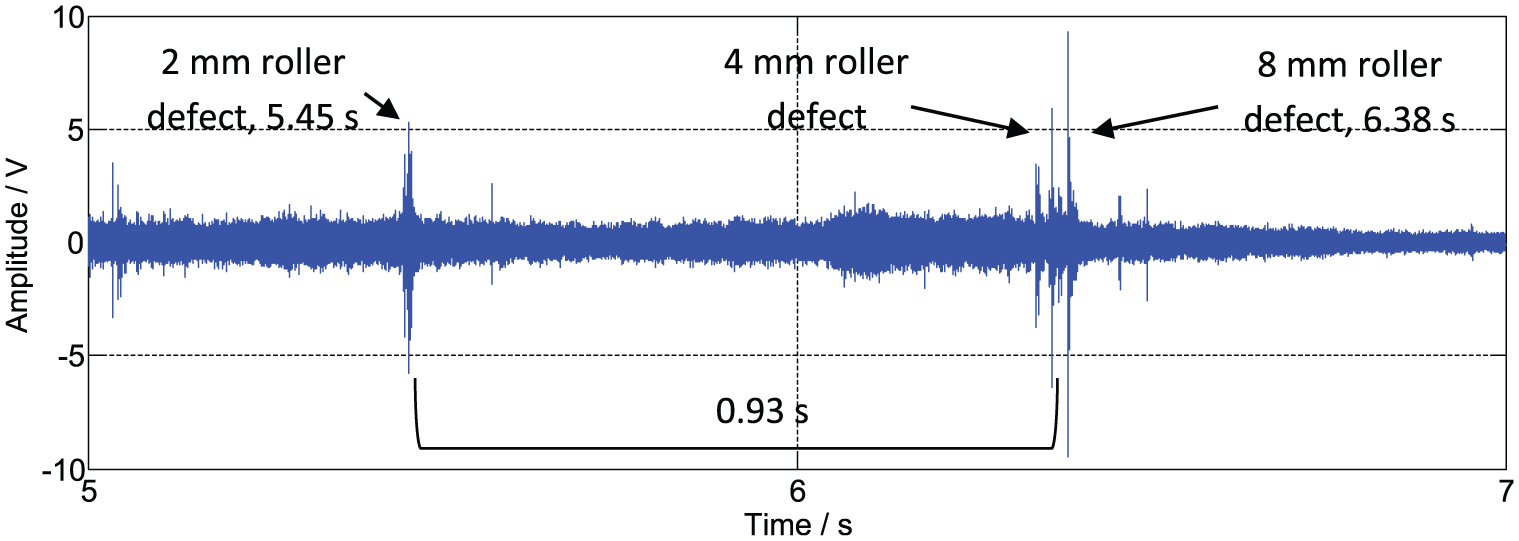
Selected 2-s period of raw data.
When a radial load is applied to the bearing, the load is distributed through only part of the bearing. The area supporting the load is called the bearing load zone which is at the bottom of the axle bearing.
The impacts arising from roller defects occur several times in one revolution of the wheel rotation. However, when the impact occurs on the bearing loading zone, a peak with higher amplitude is evident. Therefore, the recorded amplitude of a particular defect might vary during each rotation. As a result, the peak from an impact may not necessarily be at the exact time when the wheel is passing over the instrumented section. This explains the fact that the time delay between the bearing defects might slightly change.
The existence of high-amplitude AE waves in the raw data can reduce the capability of fault detection. Frequency domain analysis can be utilised to overcome this limitation in conventional signal processing approaches. Figure 9 is the spectrogram (time-frequency diagram) of the measurement and shows that the braking-related noise remains dominant, which can be falsely identified as a defect.

Spectrogram of AE data from wayside field test.
Figure 10 demonstrated the TSK analysis. High-amplitude peaks from the bearing defect do not indicate a normal distribution behaviour, hence the value of kurtosis rises up to 260 in certain frequency bands. However, the braking-related noise contains a lower value of kurtosis in all frequency bands. TSK of bearing defects has much higher value in high-frequency components compared to the braking-related noise. Therefore, the TSK is capable of distinguishing between these two peaks. Engine noises contain lower amplitude in high-frequency ranges. Therefore, using a high-pass filter (fc = 150 kHz) before the TSK analysis can remove the engine noise from the data. The high-amplitude peaks in raw data which have higher TSK value in frequencies between 150 and 250 kHz are related to the bearing defects. In addition, engine noise usually has lower amplitude compared to the bearing defect peaks in raw data. Using a threshold-based method can also be used to eliminate the engine noise.

TSK diagram of AE data from wayside field test.
Figure 11 illustrates the TSK analysis of the truncated raw data between 5 and 7 s. It should be noted that because of the large calculating window size, both peaks from 4 and 8 mm happen in one square window and cannot be distinguished. A smaller window size provides better resolution but needs a longer processing time.

TSK of truncated raw data between 5 and 7 s.
Conclusion
Wayside data can be analysed through a combination of TSK signal processing and wheelset identification position in order to reduce the effect of the surrounding noises and uncertainty in the results obtained. It has been shown that distinguishing the signal from defect bearings and non-Gaussian noises was challenging using data collected from the real train.
Conventional analysis methods such as moving RMS and moving kurtosis although capable of identifying axle bearing defects are not ideal when signal-to-noise ratio is low. Extraneous noises such as the braking system increase the value of the RMS and also lead to slight rise in kurtosis, which can lead to false identification of defects. It has been demonstrated that TSK, using the time and frequency domain including the kurtosis values for each frequency band, enhances the ability to identify the bearing defects in such cases.
Footnotes
Academic Editor: Mario L Ferrari
Declaration of conflicting interests
The author(s) declared no potential conflicts of interest with respect to the research, authorship, and/or publication of this article.
Funding
The author(s) disclosed receipt of the following financial support for the research, authorship, and/or publication of this article: The authors are indebted to the European Commission for partially funding this research through the MAX-BE FP7 (![]() ) projects (Grant Agreement Reference 314408). The authors would also like to take this opportunity to gratefully acknowledge the support of the Birmingham Centre for Railway Research and Education, Krestos Limited, Network Rail, VTG Rail and Motorail Logistics.
) projects (Grant Agreement Reference 314408). The authors would also like to take this opportunity to gratefully acknowledge the support of the Birmingham Centre for Railway Research and Education, Krestos Limited, Network Rail, VTG Rail and Motorail Logistics.