
Abstract
The objective of this article is to develop the procedure in the matching of turbine blades and generator to increase the efficiency of a wind turbine. Hydrodynamic simulation of turbine blades and the logic setting of the controller are always focused on obtaining maximum power from the turbine system. Research on the matching of the two systems, turbine blades and the generator, is rare. If turbine blades are not initially well matched with the generator, the optimal design of the turbine blades to reach peak performance will not be realized, and the controller will be unable to increase the power capture. Thus, the matching problem is worthy of being discussed. In this article, the efficiency of the wind turbine system is increased by determining the optimal constant voltage mode of the generator. As the optimal constant voltage mode is selected, the characteristics of the operating points, such as tip speed ratio, revolutions per minute, blade torque, and efficiency, can be identified by the crossover point of the T (torque)–N (r/min) curves of the turbine blades and the generator. A horizontal upwind turbine is treated as the study case here. It is suggested that the tip speed ratio value calculated by the determined revolutions per minute should be located in the high-efficiency region of efficiency curves of the turbine blades, but not in the steep-slope region of the selected constant voltage mode of the generator. The results show that, if the two systems operate well, the final output power at a low wind speed of 4–5 m/s will be increased by 65%–44%, and at a high wind speed of 10–12 m/s, it will be increased by 3%–5%.
Keywords
Introduction
Since the 2000s, much attention has been paid to obtaining renewable energy from the wind. From 2008 to 2014, the global electric wind capacity grew by an average annual rate of 20.9%. Research methods adopted to study how to gain the maximum power from the turbine system generally have centered on the hydrodynamic simulation of turbine blades and the logic setting of the controller; matching the two systems, the turbine blades and the generator, is relatively rare. In a poorly matched turbine system, the reduction in efficiency is usually more than 15%. This study explores the utilization of matching techniques that will improve the efficiency of the wind turbine system. Accordingly, a matching process will be developed.
Traditionally, turbine blades were designed according to blade element momentum (BEM), as discussed in Glauert. 1 Dynamic stall corrections were adopted by Leishman 2 to improve BEM theory. However, the interaction of rotational flow and three-dimensional (3D) blades were not described clearly by BEM. Thus, the prediction of performance by BEM leaves much to be desired. Hirsch 3 applied computational fluid dynamics (CFD) in blade simulation. Bardina et al. 4 commented that the shear-stress transport (SST) k–ω turbulence model derived by the Menter 5 was suitable for predicting the flows with separation under adverse pressure gradients. Fingersh et al. 6 and Hand et al. 7 conducted aerodynamic experiments of turbine blades in wind tunnels and provided valuable test data for 3D CFD rotor analyses. Sørensen et al. 8 solved the Navier–Stokes equation for wind turbines using the multi-block finite volume method and resulted in agreement with experimental measurements. Johansen et al. 9 used an incompressible Reynolds-averaged Navier–Stokes (RANS) solver to compute the rotor blades, by applying a multi-block, structured mesh and a detached eddy simulation; however, stall initiation at 10 m/s wind speed was not captured. It was evident in Modi et al. 10 that flow over rotating blades is dramatically different than the flow over a wing, and 3D simulations cannot be replaced by two-dimensional (2D) simulations. In Tongchitpakdee et al., 11 the yawed flow conditions were included in the CFD simulations. Three different time-accurate inviscid CFD simulations had been computed for the two-bladed wind turbine using a finite volume flow solver with rotating unstructured tetrahedral grids in Sezer-Uzol and Long. 12 In Sezer-Uzol and Long, 12 sectional pressure coefficient distributions agreed well with experimental data; however, the flow separation could not be described due to the inviscid character. Huang et al. 13 using a non-inertial reference frame discussed the aerodynamic phenomenon of rotating blades. In C Van Dam, 14 it was concluded that CFD simulations for wake development were critically affected by grid, and wake development was significantly affected by the turbine rotor tip speed ratio (TSR) and aerodynamic loading. Dynamic overset grid technology for CFD simulation was presented in Li et al. 15 for computation of bodies with relative motions, including elastic deformation. In Villalpando et al., 16 the streamlines around the clean and iced airfoil were analyzed to evaluate the ice impact on lift and drag with the SST k−ω model. The performance of a turbine blade with a large leading edge diameter and wedge angle was investigated in Sun et al. 17 Yelmule and EswaraRao Anjuri 18 is a case study in which the capability of CFD in predicting complex 3D wind turbine aerodynamics was demonstrated with NREL Phase VI data. According to Chamorro and Arndt, 19 the wind turbine is modeled as an actuator disk, without considering the rotation of the wake. The so-called Boussinesq and Coriolis correction factors are applied in the linear momentum and energy equations to account for the effects of the non-uniform velocity distribution. In Johnson et al., 20 a CFD actuator disk model was conducted to feature different boundary conditions, including a channel and duct flow. The model showed good agreement with the one-dimensional (1D) momentum theory in terms of velocity and pressure profiles. Kosasih and Hudin 21 improved the performance of the turbine system by detecting turbulence intensity. Yin et al. 22 analyzed the system design, basic dynamic characteristics, thermal losses, and management aspects; hydro-viscous transmission was applied to enhance the overall efficiency. The interference of wind turbine surge motion was discussed in Tran and Kim 23 as a result of CFD and blade element momentum (BEM) analyses.
Koutroulis and Kalaitzakis 24 applied the Perturb and Observe Algorithm to track the maximum power of the turbine system by the controller. Mirecki et al. 25 set Fuzzy Logic in the controller to obtain maximum power. According to Odgaard et al., 26 multi-objective model predictive control (MPC) problems are tuned using Pareto curves to minimize the cost of energy of the wind turbine system.
In this article, we show that the efficiency of the wind turbine is improved by matching the turbine blades and the generator. A horizontal upwind turbine is computed by CFD technology and then matched with the selected generator. Both matched and unmatched results will be compared to prove the improvement in the final efficiency test.
Mathematical model
The aerodynamics of this study case is investigated using the commercial CFD software, ANSYS FLUENT. The SST k–ω turbulence model of the second-order upwind scheme with the SIMPLE algorithm method is applied to solve the RANS equations. The time averaging approach for a time-dependent and irregular motion splits all the time varying terms into mean and fluctuating values. ANSYS Fluent solves the RANS equations by finite volume discretization. The SST k–ω model introduced by Menter 27 is applied in this article. To measure adverse pressure gradients, airfoils, and transonic shock waves, the SST k–ω model has been strongly recommended by Menter. 28 The SIMPLE algorithm derived by Patankar and Spalding 29 was used to solve the incompressible flow. The main idea of this scheme is to update the pressure and velocities by corrected terms.
Li et al. 15 mentioned that the flow in wind turbines is still essentially incompressible with Mach numbers based on a blade tip speed rarely exceeding 0.25. The Mach numbers based on the blade tip speed in this study did not exceed 0.25; thus, it was reasonable to consider the flow as incompressible in this article.
Analysis of turbine and matched generator
In this article, a horizontal upwind turbine is analyzed by CFD. Then, the calculated T (torque)–N (r/min) curves of the blades are matched with the selected generator to determine the optimal operating points.
Figure 1 shows the outline of the discussed upwind turbine. The upwind turbine is mainly composed of blades, hub, generator, cover, tail fin, and tower. The associative specifications of the discussed wind turbine are listed in Table 1.

The outline of the discussed wind turbine.
The associative specifications of the discussed wind turbine.

The selected generator, to be matched with the turbine blades, is a direct-drive type with a three-phase permanent NdFeB magnet. The measured T–N curves of this generator with every constant voltage (CV) model are plotted in Figure 2 and the corresponding efficiencies are shown in Figure 3. According to Figure 3, for any CV mode, the maximal efficiency is larger than 80%; the slope varies rapidly before reaching the maximal efficiency point. It is in this steep-slope region that the breakdown in efficiency happens. For attaining high efficiency, the location of the operating point should not be in the steep-slope region.
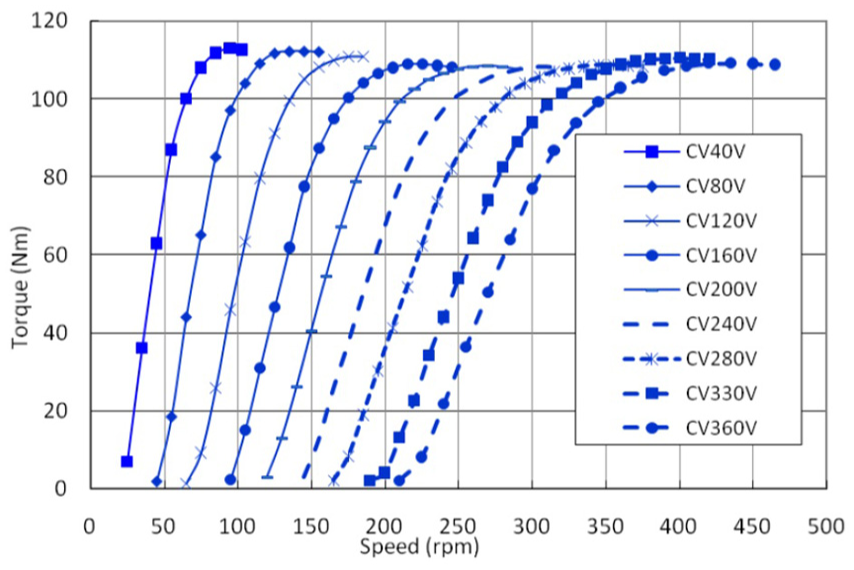
The T–N curves of this generator tested by CV model.

The efficiency of this generator.
Meshing arrangement and boundary conditions
According to Wußow et al., 30 in order to correctly analyze the relative velocity of a rotating turbine, two computing domains are necessary: one encloses the calculated structures, and the other one includes the whole computing domain. Thus, the inner and outer domains are both developed in the present computation. The number of the turbine blades is three, and a one-third size model was constructed. One turbine blade and one-third of the hub and turbine frame are enclosed in the inner domain. The radius of the turbine blade is noted by R. The inlet of the outer domain is located at 6R upstream of the inner domain, and the outlet is located at 12R downstream of the inner domain. The distance from the turbine blade axis to the outer-domain cylinder surface is 6R. The size of the inner domain is made to fit the involved structures. Please refer to Figure 4 for the computing domains.
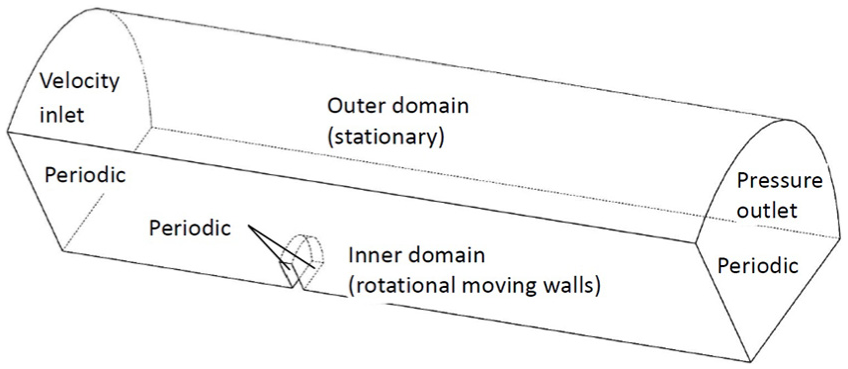
The computing domains and applied boundary conditions.
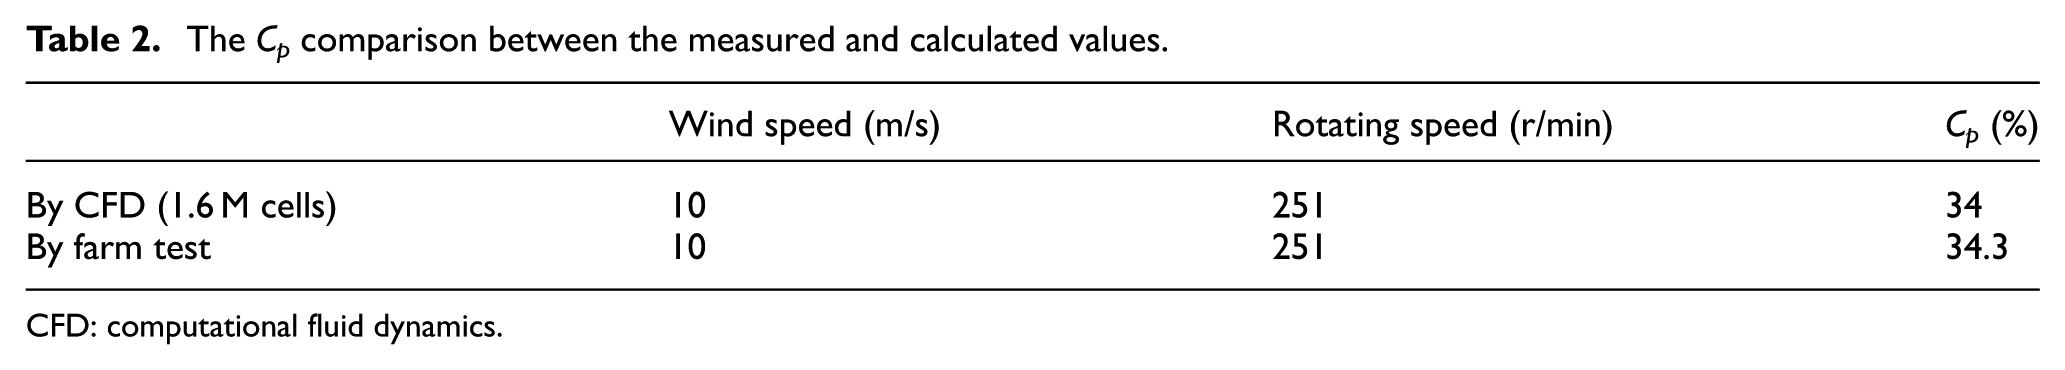
The measured efficiency (Cp) of the turbine blades operating in 251 r/min at 10 m/s wind speed is available. Cp is the efficiency of blade; it can be obtained by the blade torque (T) and the rotating speed (N)
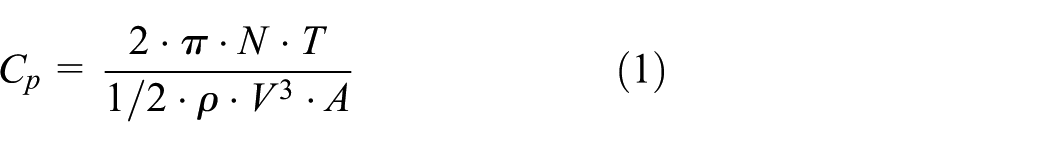
Here, ρ is the air density, V the wind speed, and A the rotating area of the blades. The Cp error between the measured and calculated values, listed in Table 2, is less than 1%.
The Cp comparison between the measured and calculated values.
CFD: computational fluid dynamics.
The applied meshes including 1.6 million tetrahedral cells are shown in Figure 5. Figure 5 shows the meshes near the blade surface. The cell size along the trailing and leading edges of the blade is 0.005R, and the size near the blade tip and hub is about 0.00135R. The mesh size increases from the blade toward the downstream and upstream directions.

The arranged meshes for the present case.
The boundary conditions for the present simulation are indicated in Figure 4. On the outer-domain inlet, a steady uniform velocity, V, is imposed and the outer-domain outlet is set as a pressure outlet. The side faces of the outer and inner domains are considered as periodic boundaries. The outer-domain walls are considered as stationary with no slip. Rotational moving and no slip walls are applied in the inner domain.
Results and discussion
The case when matching the turbine blades with the generator
In this article, the considered wind speeds are 4, 5, 6, 8, 10, and 12 m/s. For every wind speed, the computations are conducted from low speed to high speed. The simulations by CFD are matched with the selected generator; the electronic control interface can then track the maximal efficiency by the matched results.
The T (torque)–N (r/min) curves of the turbine blades, according to the CFD simulation, are plotted in Figures 6 and 7. It is also evident from Figures 6 and 7 that when the inflow attack angle exceeds the stall angle, the blade torque will be reduced. The Cp–TSR curve is shown in Figure 8. TSR is the ratio of the tip speed to the wind speed


The T (torque)–N (r/min) curves at different wind speeds.
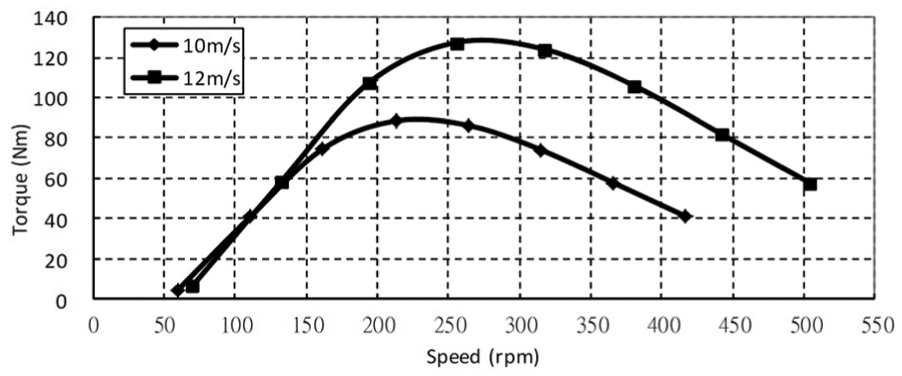
The T (torque)–N (r/min) curves at different wind speeds.
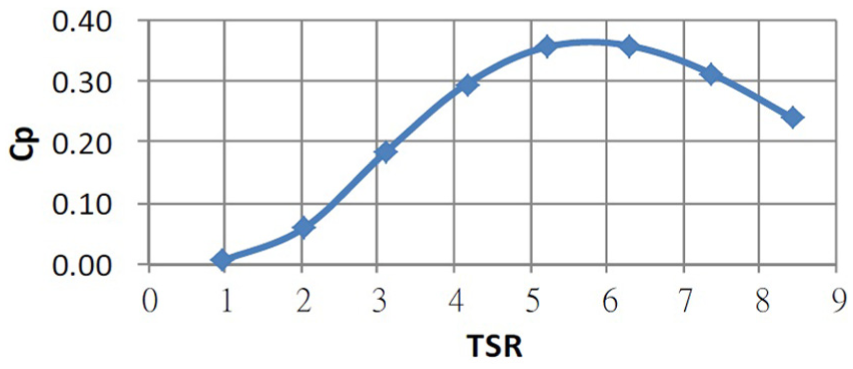
The Cp–TSR curve of the turbine blades.
Figure 8 shows that when the TSR of the operating point for this wind turbine is located at 5–6.5, the blades will operate more efficiently.
For a wind turbine system, the torque generated by the blades is used to overcome the torque of the generator. In this way, the mechanical energy can be transferred to electronic energy by the generator. Thus, the data shown in Figures 6 and 7 should be matched with those shown in Figure 2. Figure 9 is obtained by combining Figures 6 and 2, and Figure 10 is obtained by combining Figures 7 and 2. From Figures 9 and 10, the operating point (i.e. the matched point) at every wind speed can be determined. At the optimal operating point, both the efficiencies of turbine blades and the generator should be kept high. The efficiency of the turbine blades varies with the dimensionless factor, as shown in equation (2), TSR. As shown in Figure 8, when the TSR of the operating point for this wind turbine is located at 5–6.5, the blades will become more efficient. Besides, it should be noted that the operating speed (r/min) cannot be in the steep-slope region of the selected CV mode, as shown in Figure 3. In this steep-slope region, the efficiency of the generator will obviously be reduced. Thus, the criteria for the choice are operating points of the TSR-Cp curve as shown in Figure 8, the efficiency curves of the generator at every CV mode as shown in Figure 3, the determined operating speed (r/min), and the selected CV mode of the generator. It is expected that the TSR value calculated by the determined revolutions per minute will be located in the high-efficiency region of Figure 8 and not in the steep-slope region of the selected CV mode in Figure 3.
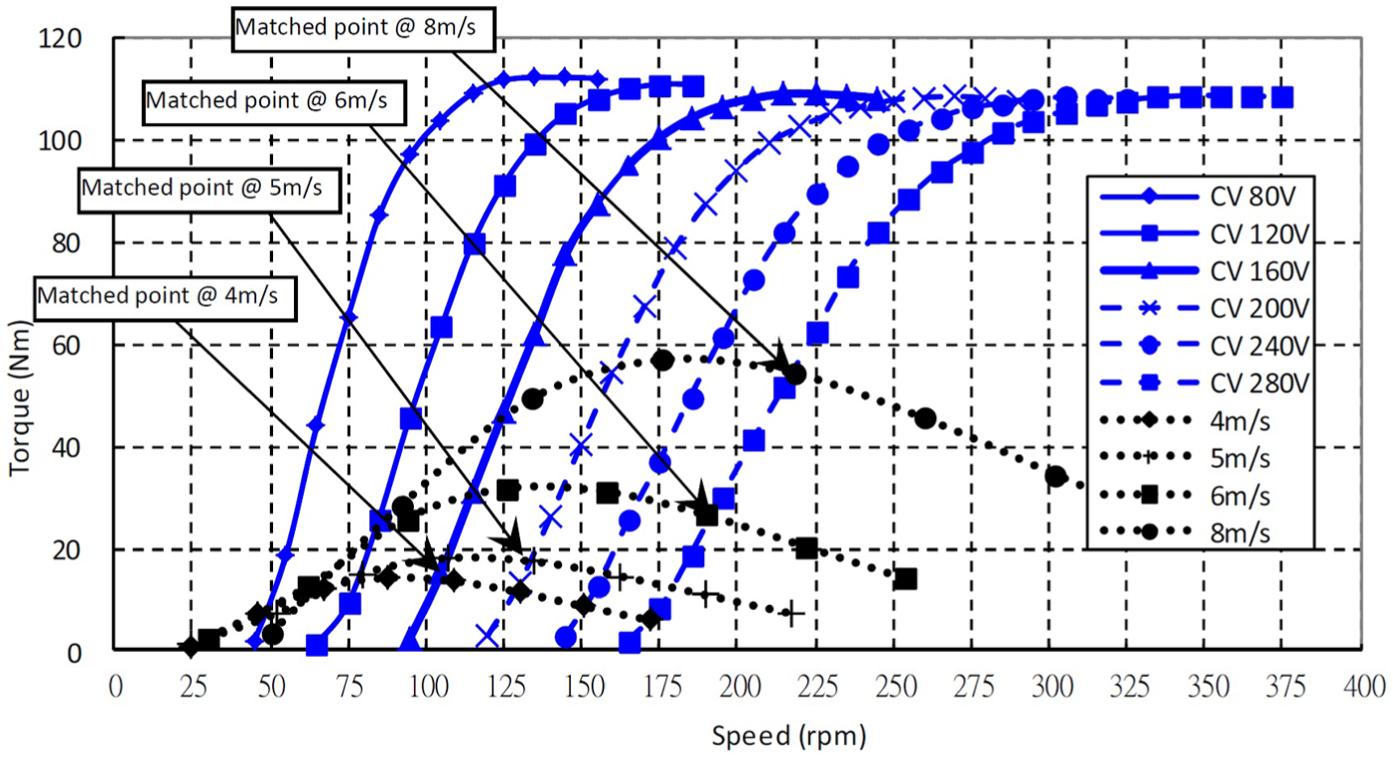
The matching results of turbine blades and generator.

The matching results of turbine blades and generator.
Table 3 shows the associated information of each matched operating point for every wind speed. Take 4 m/s wind speed for example. A CV 160 V mode of generator is selected as the electronic control model. According to Figure 9, the matched point of 4 m/s corresponds to 105 r/min and 13.9 N m. From Figure 3, we can see that the generator efficiency, eff−g, of CV 160 V at 105 r/min is 81%. The electronic efficiency, eff−e, is usually 90%–93% and is assumed to be 90% here. The blade efficiency is about 35% as calculated by equation (1). P−blade (i.e. the mechanical power), 153 W and P−out (i.e. the final electronic power), 112 W are computed by the following


The matched operating points at every wind speed.

CV: constant voltage; TSR: tip speed ratio.
According to Figure 8, when the TSR value of the operating point is in the range of 5–6.5, the blades will achieve greater efficiency. Besides, the matched speed, 105 r/min, is not found in the steep-slope region shown in Figure 3; the generator efficiency, eff−g, is also kept high.
The case when turbine blades and generator are not matched
When the two systems—blade and generator—are unmatched, the generator will operate at the same CV mode for all wind speeds. In the case where these two systems are not matched, an overall CV mode should be selected first. Here, the 280 V mode is chosen in the unmatched case because the T–N curves of the turbine blades at every wind speed can form an intersection point with that of the 280 V mode, as shown in Figure 11. At the intersection point, the torque needed by the generator is equal to that generated by the turbine blades. Other CV modes are not suggested in the unmatched case, except for the 280 V mode. If the 200 V mode is selected in the unmatched case, the turbine system will be overspeed at 10 m/s wind speed, and some damage may be caused because the torque generated by the blades is much larger than the generator requires (i.e. no intersection point is formed at 12 m/s wind speed, as shown in Figure 11).

The selection of the CV mode for the unmatched case.
The final output powers are listed in Table 4. By comparing the P−out listed in Tables 3 and 4, it can be seen that the final output power of the matched case at low wind speed, 4–5 m/s, will be increased by 65%–44%, and at high wind speed, 10–12 m/s, it will be increased by 3%–5%. Achieving a 3%–5% increment of efficiency is remarkable and cannot be construed as negligible. The optimal CV mode will be determined in the matched system and increase the efficiency of the wind turbine. The results of matched and unmatched systems at 6–8 m/s are the same due to the same CV modes. As the CV modes of the matched and unmatched systems are the same at some wind speeds, the characteristics, such as TSR, revolutions per minute, blade torque, and efficiency, of these two systems are also the same. Take 5 m/s wind speed for example. The optimal CV mode at 5 m/s of the matched system, CV 200, is determined and differs from that of the unmatched system. The improved efficiency at 5 m/s due to the optimal CV mode is about 44% (179 − 101)/179 = 0.44. In this case, the lower wind speed, 3 m/s, is not suggested to be discussed because the cut-in speed of this case shown in Table 1, 3.5 m/s, is larger than 3 m/s.
The unmatched operating points at every wind speed.

CV: constant voltage; TSR: tip speed ratio.
Conclusion
The main purpose of this article was to develop a matching process for turbine blades and generator to improve the efficiency of the wind turbine system. Based on the above, several points can be concluded as follows:
At different CV model, the T (torque)–N (r/min) curves of the generator are measured. The T (torque)–N (r/min) curves of turbine blades are calculated by CFD. Both the T (torque)–N (r/min) curves of the turbine blades and the generator are plotted together to find the optimal operating points. The basis for choosing the operating points are the selected CV mode of the generator, the TSR–Cp curve of the turbine blades, the efficiency curves of the generator at every CV mode, and the determined operating speed (r/min). It is suggested that the determined revolutions per minute be located in the high-efficiency region of the TSR–Cp curve of the turbine blades, not in the steep-slope region of selected CV mode.
By comparing the final output power of the matched condition with that of the unmatched condition, it is known that the final output power of the matched condition at low wind speed, 4–5 m/s, will be increased by 65%–44%, and at high wind speed, 10–12 m/s, it will be increased by 3%–5%.
The proposed method of achieving an optimal balance of turbine and generator is still in the developmental stage. Overspeed protection and noise abatement during the matching process are areas that warrant future discussion. The expectation should be that the matched rotating speed is under control as the wind turbine experiences gusts and does not cause unacceptable noise. The above concerns are suggested for future study to make this present process robust.
Footnotes
Academic Editor: Yangmin Li
Declaration of conflicting interests
The author(s) declared no potential conflicts of interest with respect to the research, authorship, and/or publication of this article.
Funding
The author(s) received no financial support for the research, authorship, and/or publication of this article.