
Abstract
To realize whether the rules for controlling the blade three-dimensional stacking line in a compressor with conventional loading level could be used for the design of a highly loaded compressor, the effects of three-dimensional bladings in an ultra-highly loaded compressor stage were studied numerically. A low-speed compressor stage (Stage-C) with ultra-high loading coefficient (=0.52) was designed at first. Due to the well-chosen through-flow design parameters accompanied using controlled diffusion airfoil with spikeless leading edge, Stage-C achieved the design goal of loading level with high peak efficiency of about 0.89. However, all the blades in Stage-C were designed with radial stacking lines. And then, Stage-C-three-dimensional was re-designed with non-radial stacking blades based on Stage-C, after which 1-point compressor efficiency profit was achieved. Based on the numerical simulations, the performance change in the two compressors and also the effects of blade three-dimensional stacking were discussed in depth. It was found that the endwall corner separation and secondary flows could be suppressed effectively using endwall bending; however, the blade forward sweep design at the rotor tip failed due to strong rotor–stator coupling effects in the highly loaded compressor stage.
Introduction
Currently, three-dimensional (3D) blade design techniques play a key role in high-performance compressor designs and have been widely used for industry applications.1–4 A large number of experimental and numerical works, concerning the physical mechanics of the performance of different blade 3D design (i.e. non-radial stacking line) methods, such as sweep, dihedral, bow, and lean, have been conducted.1,2,5,6 However, the results are much diversified in the literatures, and no consensus of quantitative7,8 and/or even qualitative9,10 rules could be found for a certain blade 3D design type, resulting in an absence of widely accepted design criteria for blade 3D designs. Hence, further studies on the working mechanics of blade 3D designs are still needed.
It is well known that the influences on the performance of a blade with 3D designs can be affected by a wide variety of different geometrical and aerodynamic parameters used during compressor blade design procedures. Therefore, most of the related researches were conducted to concern the effects of one or several parameters, for further simplicity, and were mainly conducted in a single-blade row or cascade configurations.5,7,10–17 Although some related works have been conducted in single-stage or multi-stage compressors, the influences of the blade row interaction flow phenomena on the effects of blade 3D designs were often not under serious consideration.1,18,19 It is well known that in a multi-stage configuration, particularly for the subsonic compressors in the middle and rear stages of a high-pressure compressor, the design of one blade row might have significant effects on the flows in both the upstream and downstream blade rows. Hence, for the blade 3D designs in a multi-blade-row configuration, the effects on the flows in the adjacent blade rows should also be considered with caution.
It is well known that increasing the stage loading is a way to meet the requirement for future advanced compressors. 20 As blade loading increased, the 3D flows in the compressors, such as endwall secondary flow, rotor tip leakage flow, and corner separation, may become much more stronger;21–23 meanwhile, the blade row interaction flow mentioned above may also be enhanced. Consequently, a new problem arises: whether the rules for controlling the blade 3D stacking line in a compressor with conventional loading level could be used for the design of a highly loaded compressor.
In order to shed some light on the problems summarized above, in this study, we have conducted a deep and systematic study of the 3D blade designs in an ultra-highly loaded (loading level beyond the state of the practice) subsonic axial compressor stage. The researches were conducted in a low-speed axial compressor test facility, which has an original compressor stage (Stage-A) with ordinary loading level,
Compressor facility
Figure 1 shows the Low-Speed Large-Scale Axial Compressor (LSLSAC) test facility at Beihang University. It is a 1.5-stage axial compressor comprising three blade rows, that is, inlet guide vanes (IGVs), rotor, and stator. The casing diameter is 1 m, and the hub diameter is 0.6 m. In the original low-loading configuration, that is, Stage-A, the rotor and stator blades with C4-series airfoil were designed in terms of the free vortex law. The IGV and stator vanes are cantilevered with a hub clearance of about 0.5 and 1.5 mm, respectively. Detailed introductions of the test facility can be referred to the published article, 24 and some representative parameters are listed in Table 1.

Low-Speed Large-Scale Axial Compressor (LSLSAC) test facility.
Design parameters of LSLSAC and Stage-A.
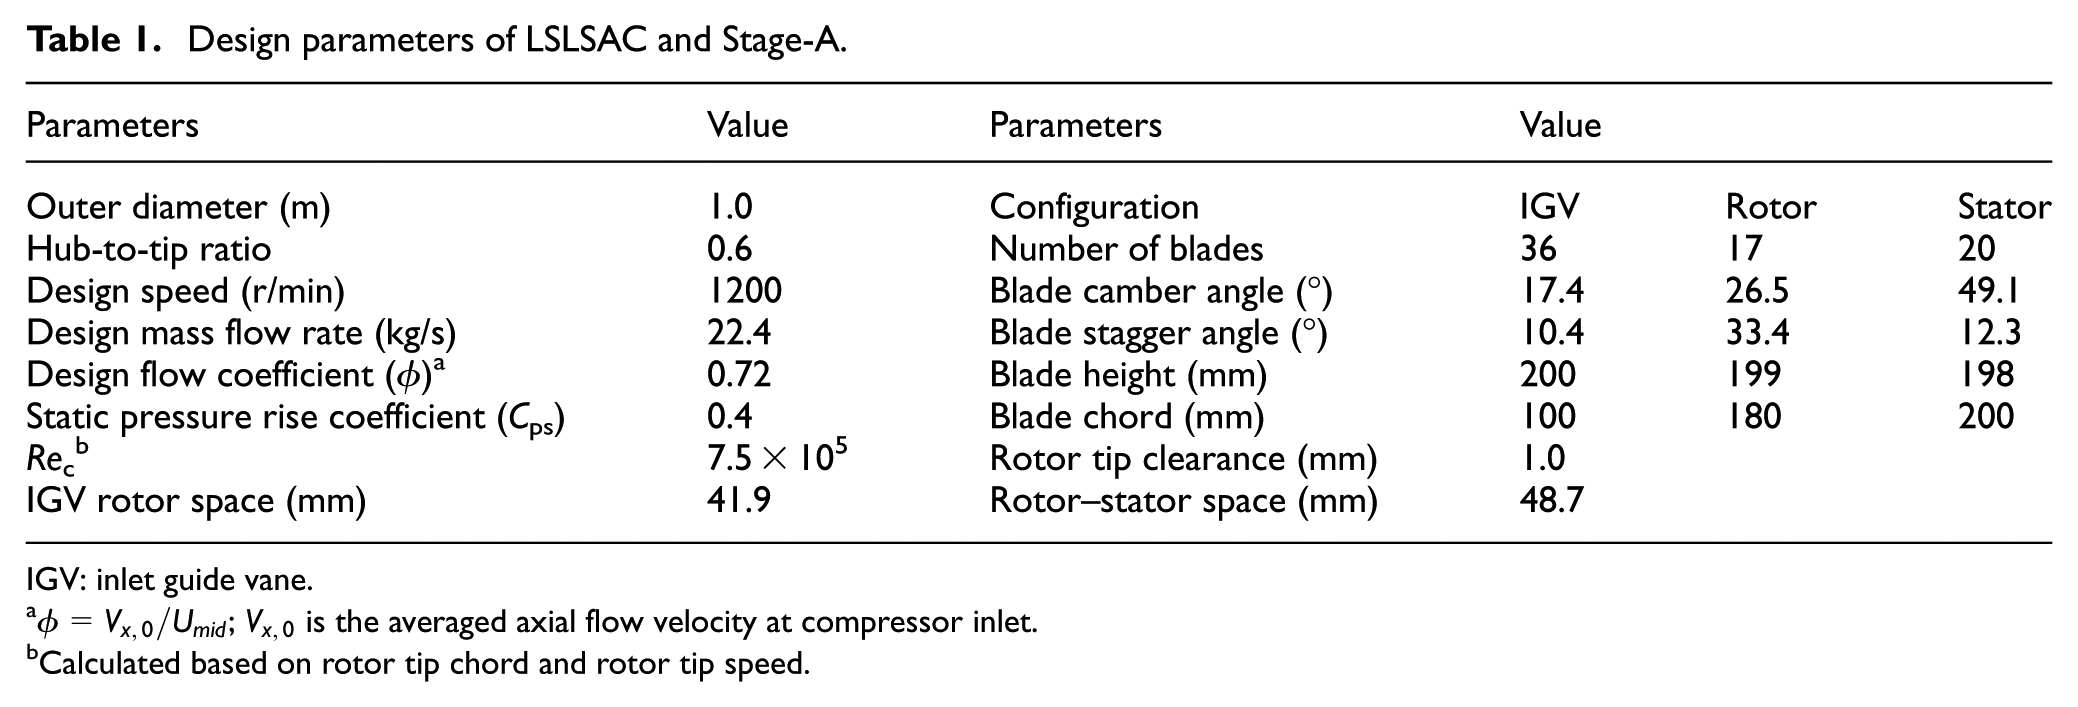
IGV: inlet guide vane.
Calculated based on rotor tip chord and rotor tip speed.
Figure 2 shows the locations on the LSLSAC for data analyses of the numerical results in this article. Plane 0 is located about 600 mm upstream of the IGV. Plane 1 is located just upstream of the leading edge of the IGVs. Plane 2 and Plane 3 are located between the IGV and rotor blade rows and rotor and stator blade rows, respectively. Plane 4 is located just downstream of the stator blade trailing edge. Plane 5 is located 1.5 stator blade chord length far away from the stator blade trailing edge.

Locations of the probe ports on LSLSAC.
Preliminary design tool and 3D computational methods
Preliminary design tool
For the compressor preliminary design procedure, the through-flow code developed by Li and Chen 25 was employed. This code solves the passage-averaged Navier–Stokes equations with streamline curvature method. In this code, the circumferential non-uniformity terms and the viscous dissipation terms were well modeled and validated. Moreover, the effects of the representative complex 3D flows, such as endwall boundary layers, blade wakes, tip leakage vortex, blade motion effects, and turbulent mixing and heat transfer effects, in a multi-stage compressor were also modeled carefully in the code. This code has been widely validated for different compressor configurations, including both single-stage and multi-stage compressors, which has detailed experimental data. The predicted results agreed well with the experimental results. This code has been improved much since it was developed and has been employed for a long time in industry applications. Hence, it should be a reliable tool for the design of the highly loaded compressor stages in this study.
Numerical software
3D steady viscous CFD method was used to evaluate the compressor design results. The numerical simulations in the present studies were conducted using the code first developed by Denton 26 in Cambridge. Viscous and turbulence effects are included in this code using a thin shear layer approximation to the Navier–Stokes equations and eddy viscosity mixing length model. It can solve various turbomachinery models on simple H-type grids with much less resource consumption but with acceptable confidence. Nowadays, this code has been widely used in both university researches and industry applications worldwide.1,2 The version of the code employed in this work has been improved by Liu et al.27,28 and named as TURBO-N6.
Grid and boundary condition
Simple H-type meshes (Figure 3) were generated by a self-developed code GMESH 2.0. The IGV and stator blocks have 170 × 40 × 54 grid nodes in streamwise × circumferential × spanwise directions, respectively. As for the rotor block, the grid nodes are 130 × 40 × 54. The total number of grid nodes is 1.02 million. This level of grid refinement ensures the adequacy of the thin shear layer approximation for viscosity in the code, since the slip model of flow on the boundaries, that is, wall functions, is used to calculate the shear stress on the boundary. 26 The shear stress on the solid boundaries is obtained by assuming that the first grid point away from the solid surfaces lies at the edge of the laminar sub-layer, where a typical value of y+= 11 can be set as a good approximation for various boundary layer profiles.29,30

Mesh for numerical simulations.
Steady simulations were conducted in this study with mixing plane model 26 used between the interfaces of IGV/rotor and rotor/stator. During the simulations, the total pressure, total temperature, and flow angle were set at the inlet; accordingly, the back pressure was set at the outlet. The convergence criterion for the TURBO-N6 simulation is set to ensure that the residual of mass flow rate is less than 0.01% and the average velocity residual is less than 0.001%, which were much more strict than that usually used for industry applications. 27
Using the same grid and numerical settings mentioned above, TURBO-N6 was validated using the detailed experimental results measured in Stage-A. The comparison of the predicted and measured compressor static pressure rise characteristics is shown in Figure 4. It can be seen clearly that the predicted and measured results agree very well.

Comparison of the predicted (using TURBO-N6) and measured compressor static pressure rise characteristics of Stage-A (Cps is the stage static pressure rise coefficient calculated based on the casing static pressure at Plane 1 and Plane 5 shown in Figure 2).
Design strategy
In order to design a compressor with high performance, the preliminary design parameters, such as design flow coefficient and stage loading coefficient, should be determined properly. The “Smith chart” is a commonly used reference to it. A typical Smith chart obtained using the models developed by Wright and Miller
31
is given in Figure 5. Most of the modern compressors lie inside the dashed ellipse marked in Figure 5, which nearly overlaps the contour of the peak efficiency determined by the state-of-the-art design technologies. As mentioned above, the original compressor stage, Stage-A, is an ordinarily loaded compressor, but the design mass flow rate (see in Table 1) is too large. Hence, its efficiency level (around 85%) is much lower than the state-of-the-art level (around 90%). For the design of Stage-C, the loading coefficient was set as

Status of Stage-A and Stage-C on a typical Smith chart. 31
In order to decrease the cost to rebuild the test facility, the structure of LSLSAC will not be changed for replacing Stage-A with Stage-C, that is, Stage-C will be designed by keeping the blade numbers of each blade row and the blade hub-to-tip ratio unchanged as that for Stage-A. As can be seen in Table 1, the hub-to-tip ratio of LSLSAC is 0.6, which is much lower than the high-pressure compressors designed by the state-of-the-art technologies. Hence, much more stronger radial equilibrium effects may be encountered in Stage-C than in large hub-to-tip ratio compressors. Consequently, the radial distributions of blade loading and the degree of reaction of the compressor stage are very hard to be kept in a uniform profile, however, which is a usual feature in modern high-pressure compressors. In order to overcome this structural imperfection of the LSLSAC, the swirl of the IGV and outlet flow angle of the stator are designed carefully to make the radial profile of the blade loading uniform enough and the stage reaction ranged in a typical region. Moreover, in Stage-C, both the rotor and stator blade rows will be designed with radial stacking method, but the blade airfoils will be replaced with advanced controlled diffusion airfoil (CDA). Based on the above-mentioned design strategies, it is hoped that Stage-C can achieve the ultra-high loading level with a typical isentropic efficiency (
Based on the design results of Stage-C, the blade with non-radial stacking lines, such as blade sweep, lean, and dihedral, will be implemented on the rotor and stator blades of Stage-C. The design of non-radial stacking lines of the blades should be used to suppress the strong secondary flows, such as rotor tip leakage flow, endwall corner separation, and radial migration low-momentum flows, in the ultra-highly loaded compressor Stage-C. After the design of 3D blading, it is hoped that the Stage-C-3D compressor can achieve a 1-point efficiency increase compared to Stage-C.
Design of an ultra-highly loaded stage: Stage-C
Radial variation in through-flow parameters
In order to significantly increase the blade loading in Stage-C, the loading near the rotor blade tip has to be enhanced much, which can cause an inevitable non-uniform tip-strong radial loading profile as that shown in Figure 6. This non-uniform total pressure rise radial profile can cause significant blade radial-matching problem particularly in a small hub-to-tip ratio compressor such as the LSLSAC test facility used in this study. It is well known that the choice of the degree of reaction for a compressor stage is very important for its efficiency level. As suggested by Wisler, 32 the stage reaction should range from 0.5 to 0.7 for a high-efficiency compressor stage designed with the state-of-the-art technologies. As can been seen in Figure 7, the degree of reaction in Stage-A ranges from about 0.31 at the hub to 0.80 at the shroud, which is too low near the hub and should be a critical reason for the much low compressor efficiency level of Stage-A.

Comparison of the design (normalized) total pressure for the rotor exit in both Stage-C and Stage-A.
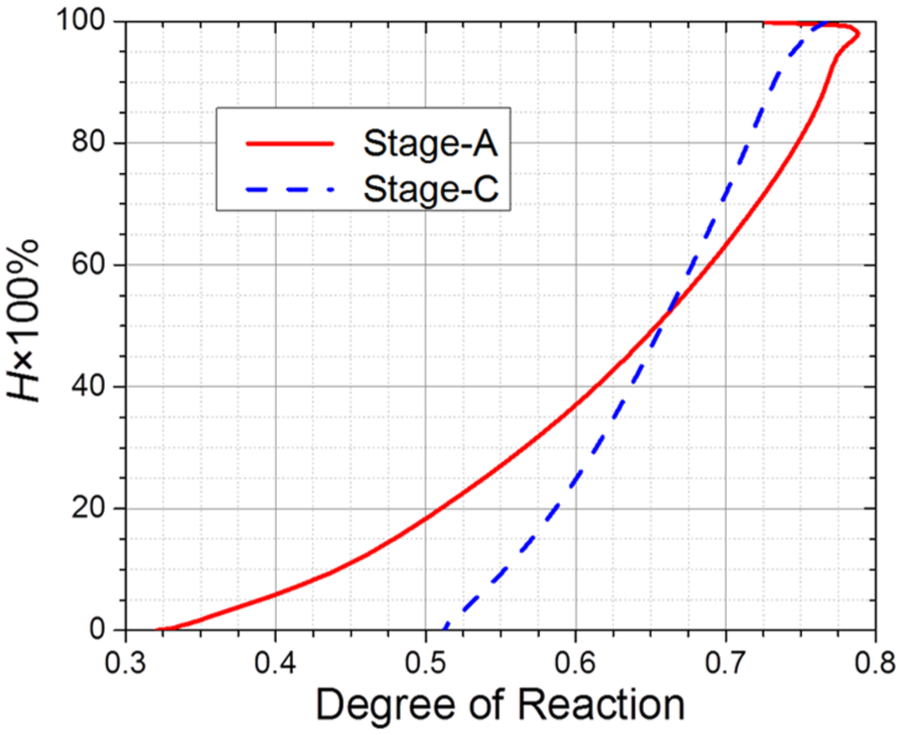
Comparison of the design degree of reaction for Stage-C and Stage-A.
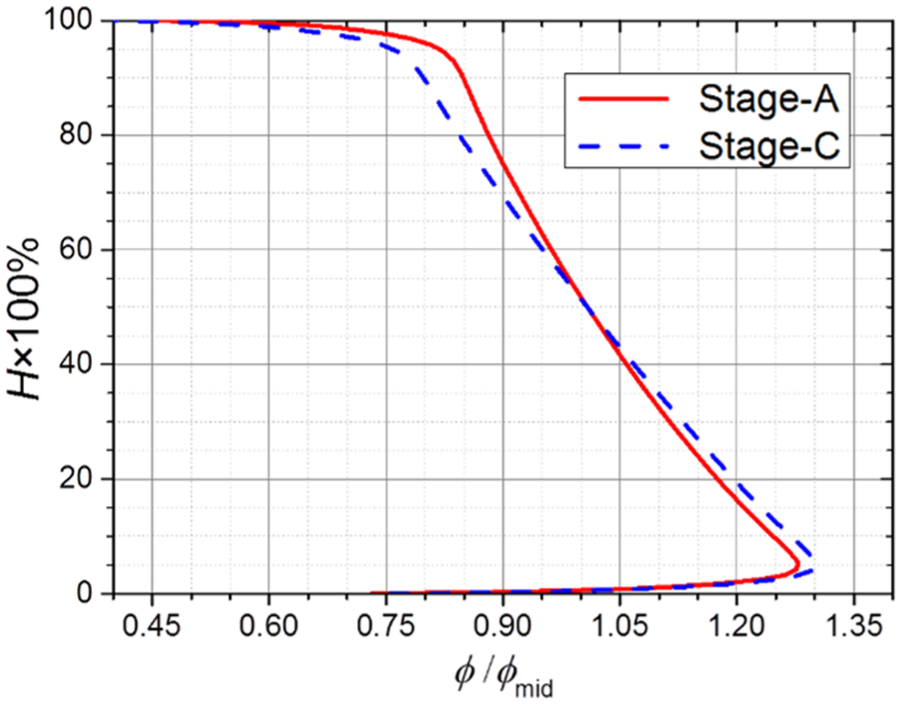
In order to achieve a reasonable stage degree of reaction profile in Stage-C, the spanwise variation in the pre-swirl angle in Stage-C changed a lot compared to that in Stage-A. As shown in Figure 8, in Stage-A, the pre-swirl angle ranges from −18° to −11° from the hub to shroud. With the free vortex design of the rotor and a nearly axial outflow design of the stator, the large positive swirl angle near the hub usually decreases the stage degree of reaction. Hence, in order to increase the near-hub reaction, for the design of Stage-C (Figure 8), the pre-swirl angle near the hub region was reduced significantly to a counter-swirl form compared to that in Stage-A. As a result (Figure 7), a much more reasonable spanwise distribution of the degree of reaction was achieved in Stage-C which ranged from 0.5 at the hub to 0.75 at the shroud. Moreover, this counter-swirl design near the hub opened the flow passage at the lower spans and resulted in a slight increase in the flow capacity near the hub and a relative decrease in local mass flow rate near the shroud, which can be seen clearly in Figure 9.

Comparison of the design rotor inlet pre-swirl angle for Stage-C and Stage-A.
Comparison of the design normalized rotor inlet mass flow coefficient for Stage-C and Stage-A.
The radial distributions of the diffusion factor at the design condition in both the rotor and stator blades of Stage-A and Stage-C are shown in Figure 10. In Stage-A, both the rotor and the stator have a low diffusion factor around 0.35 at the design condition. However, very high diffusion factor can be seen at the near-hub end of the stator blade, which should be a result of the design with low degree of reaction near the hub region (shown in Figure 7) in such a low hub-to-tip ratio configuration. Detailed experimental results also showed that the low efficiency and even stall limit of Stage-A should be determined by the serious near-hub corner separation that appeared in the stator passage.33–35 In Stage-C, in order to achieve the high design loading coefficient, the rotor was designed with a diffusion factor of about 0.52 at the mid-span at the design condition; however, the diffusion factor at the two ends of the rotor blade was reduced to ensure high flow efficiency could be obtained. As for the stator in Stage-C, the diffusion factor is about 0.48 at the mid-span at the design condition. At the lower spans, the diffusion factor is a little higher than that at the upper spans; however, the dramatic increase in the diffusion factor approaching the hub end appearing in Stage-A was suppressed due to the counter-swirl design mentioned above.

Radial variation in the diffusion factor for both the rotor and stator blades.
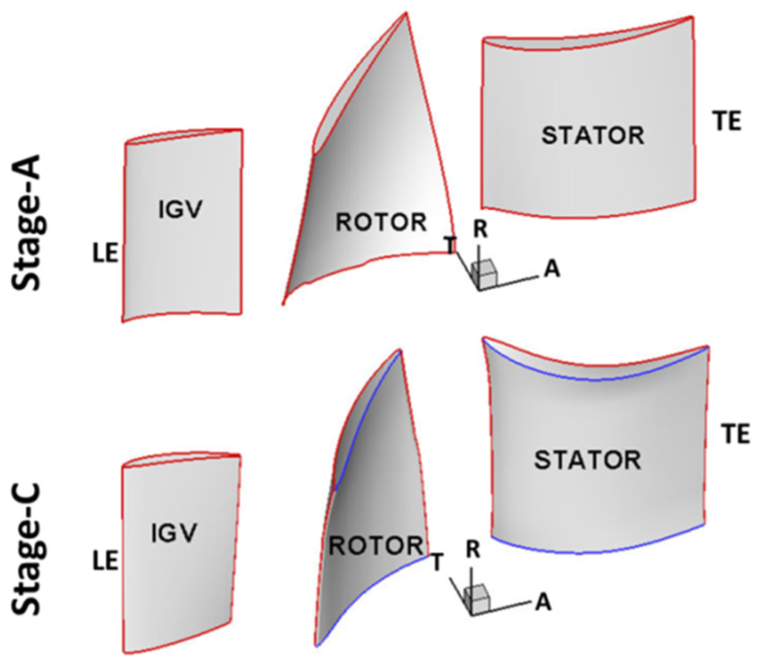
Figure 11 shows the 3D models of the blades in both Stage-A and Stage-C. It is evident that both the rotor and stator blades possess a much larger blade camber angle and stagger angle in Stage-C compared to Stage-A. The detailed blade geometrical parameters are listed in Table 2.
3D models of the blades in Stage-A and Stage-C.
Design parameters of Stage-A and Stage-C.
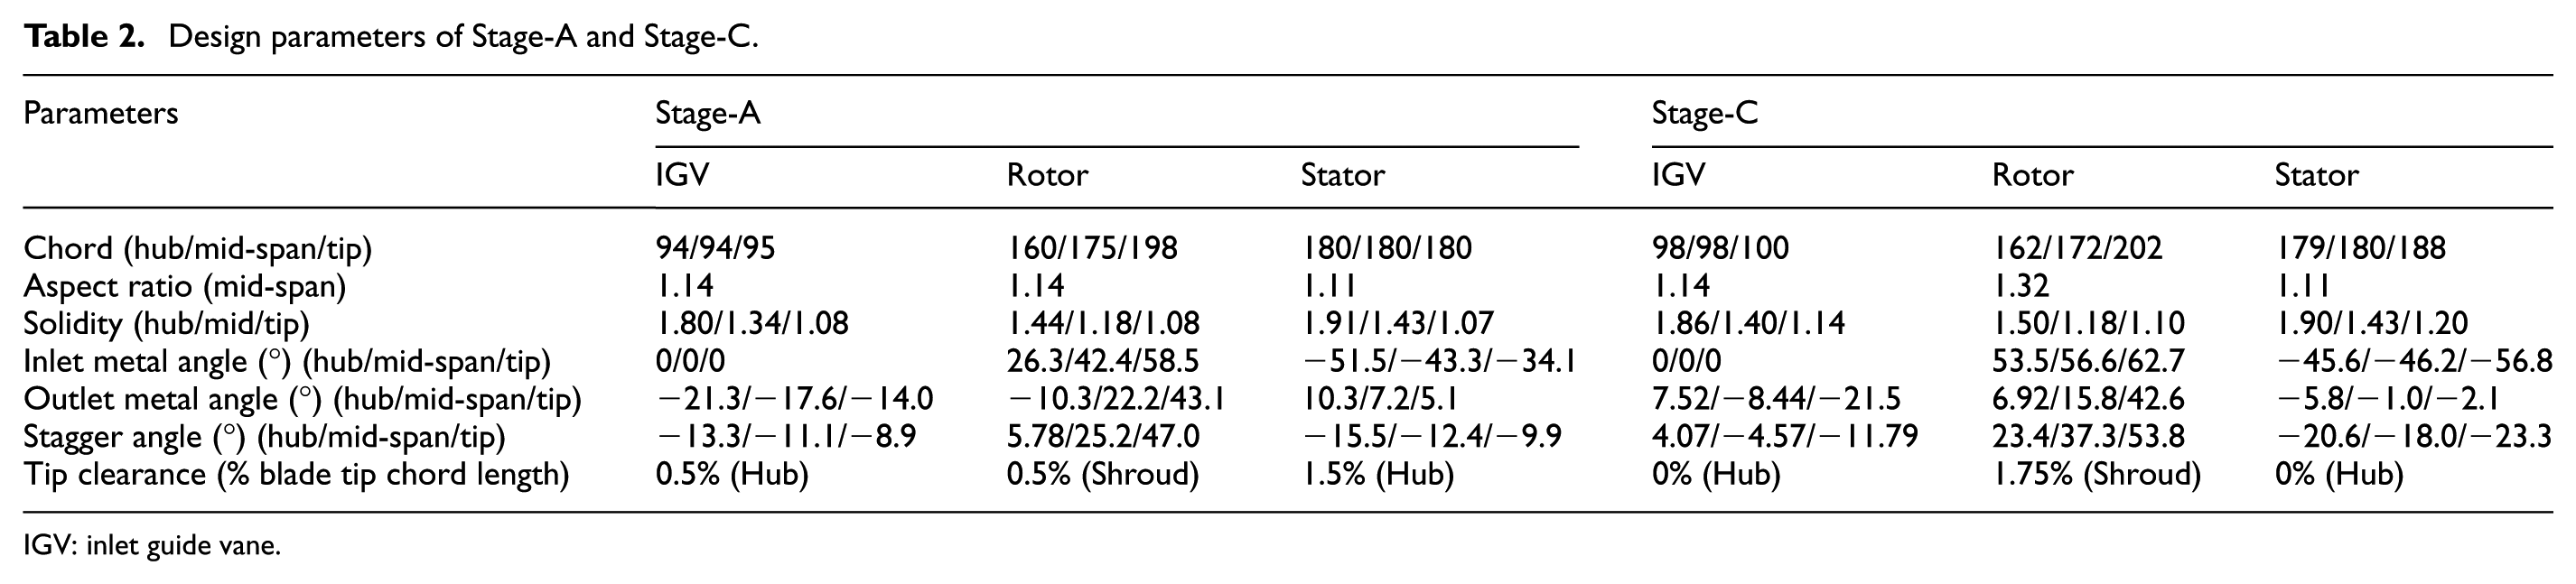
IGV: inlet guide vane.
Blade airfoil design
In Stage-C, the IGV blade was designed with C4 airfoil; however, the rotor and stator blades were designed with CDA profiles. The blade profiles at the blade mid-span and the corresponding Cp distributions at the design condition are shown in Figure 12. The CDA profiles for both the rotor and stator blades were designed with nearly the same loading distribution along the blade chord. The suction velocity peaks are all located at about 20% chord position on the blade suction surface. It should be noted that the CDA profiles were designed with curvature-continuous blade leading edge using Modified “Class function/Shape function” Transformation technique (MCST) method developed by Liu et al. 36 Hence, there are no distinct leading edge spikes 37 that can be seen on the Cp charts in Figure 12.
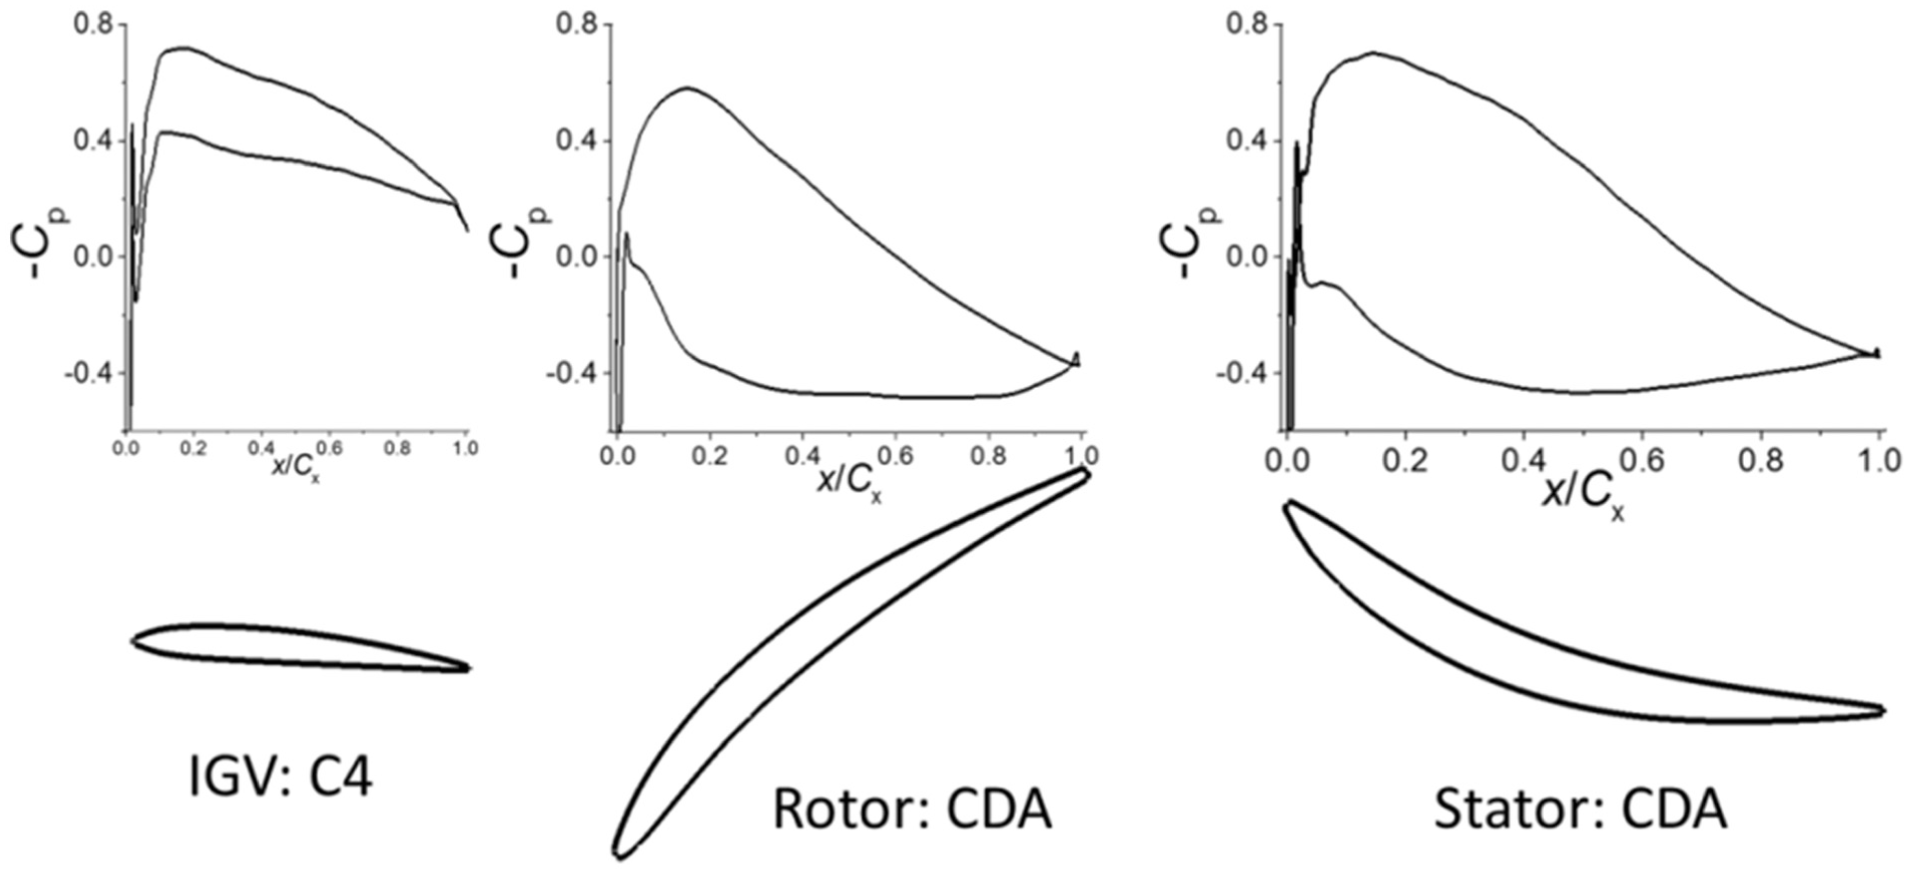
Blade profiles at the mid-span of the three blade rows in Stage-C and the corresponding static pressure rise coefficient at the design condition (Cp is the static pressure rise coefficient).
Because of the significant increase in the blade elements’ loading, as shown in Figure 10, the flow deviations in Stage-C should increase accordingly compared to that in Stage-A, which can also be seen in Figure 13. However, because of using the CDA profiles and the optimization of the distribution of blade radial loading (see in Figures 6 and 10), the changes in deviation angle at different compressor operating conditions are not very significant in Stage-C.
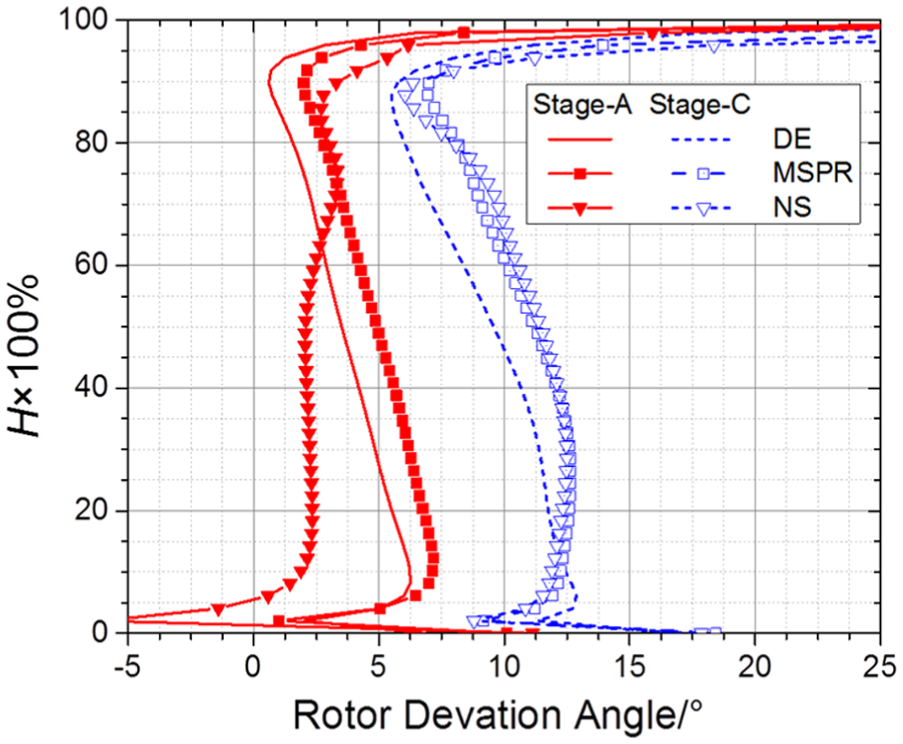
Comparison of the predicted rotor deviation angles of Stage-C and Stage-A.
Compressor performance
The predicted compressor characteristics are shown in Figure 14. Obviously, both the pressure rise characteristics and the efficiency characteristics are promoted much in Stage-C compared to that in Stage-A (rotor tip gap of about 0.5% blade span). The peak static pressure rise coefficient is about 0.78 in Stage-A and it is promoted to 1.0 in Stage-C. Meanwhile, the peak efficiency is also greatly increased from 0.859 in Stage-A to 0.890 in Stage-C. At the design (DE) condition (
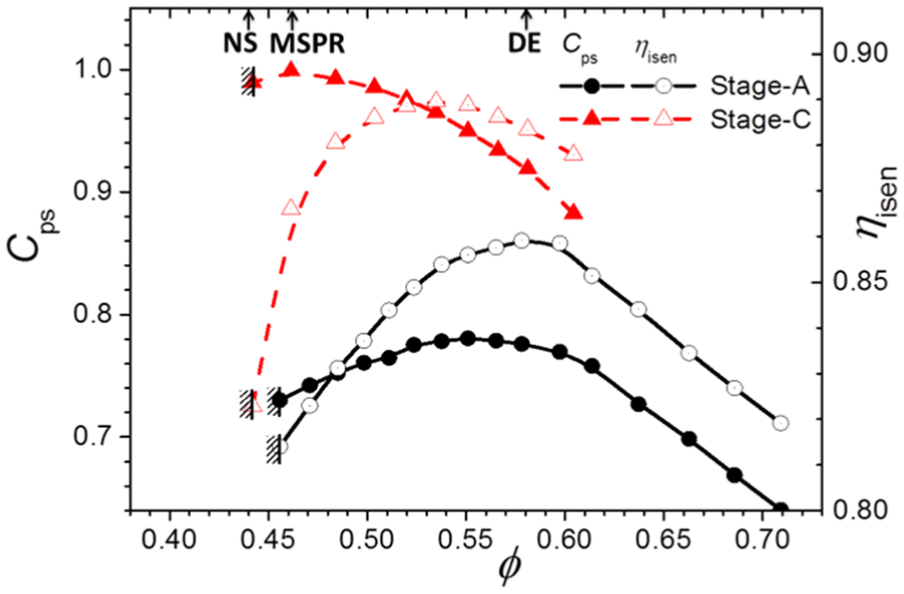
Comparison of the predicted compressor characteristics of Stage-C and Stage-A with the rotor tip gap of about 0.5% blade span.
Blade 3D design of Stage-C: design of Stage-C-3D
Blade re-stacking method
Because of the high loading of Stage-C, based on some numerical simulations, it was found that the secondary flows, including the rotor tip leakage flow and the endwall corner separations at the rotor hub and stator endwall corners, inside the rotor and stator passage were very strong, which should be the reasons for the much rapid efficiency drop at the low mass flow rate conditions as mentioned above. Hence, Stage-C-3D was designed with the re-stacking of both the rotor and stator blades in Stage-C to suppress these strong secondary flows and improve the compressor performance at low mass flow rate conditions.
The widely used blade 3D design definitions in a pair of orthogonal directions shown in Figure 15 were employed during the blade re-stacking of Stage-C-3D, that is, the displacement of blade sections in the blade chordwise direction is called as the blade sweep, and consequently, the displacement of blade sections in the direction perpendicular to the blade chordwise is called as the blade dihedral. In meridional plane, if the angle between the endwall and blade stacking line is an obtuse angle at the blade leading edge side, the sweep is defined as the forward sweep; on the contrary, an acute angle indicates the backward sweep. Moreover, in the meridional cross-sectional plane, if the angle between the endwall and blade stacking line is an obtuse angle at the suction surface side, the blade is designed as positive dihedral; on the contrary, acute angle means negative dihedral.

Definitions of blade 3D designs in chordwise-based orthogonal coordinates. 38
Non-radial stacking line design in Stage-C-3D
As shown in Figure 16, for Stage-C-3D, the rotor tip was designed with forward sweep and a slight positive dihedral, which were used to reduce blade tip loading and decrease the strength of the tip leakage flow. 39 At the rotor hub, in order to suppress the hub corner separation and weaken the accumulation of low-momentum flow, significant positive dihedral with slight forward sweep was employed. As for the stator blade, strong positive dihedral was imposed at both the hub and casing ends to suppress the endwall corner separation flows.

Comparison of the blades in Stage-C and Stage-C-3D.
The exact radial variations in the blade elements’ displacement in the sweep and dihedral directions in different blade spans of both the rotor and stator blades are shown in Figure 17. At the rotor hub, blade elements’ sweep is much stronger than that for dihedral, while they have nearly the same magnitude at the rotor near-shroud spans. For the stator blade, at the near-hub spans, the blade sweep and dihedral have nearly the same magnitude, however, approaching to the shroud end, blade dihedral is dominant.
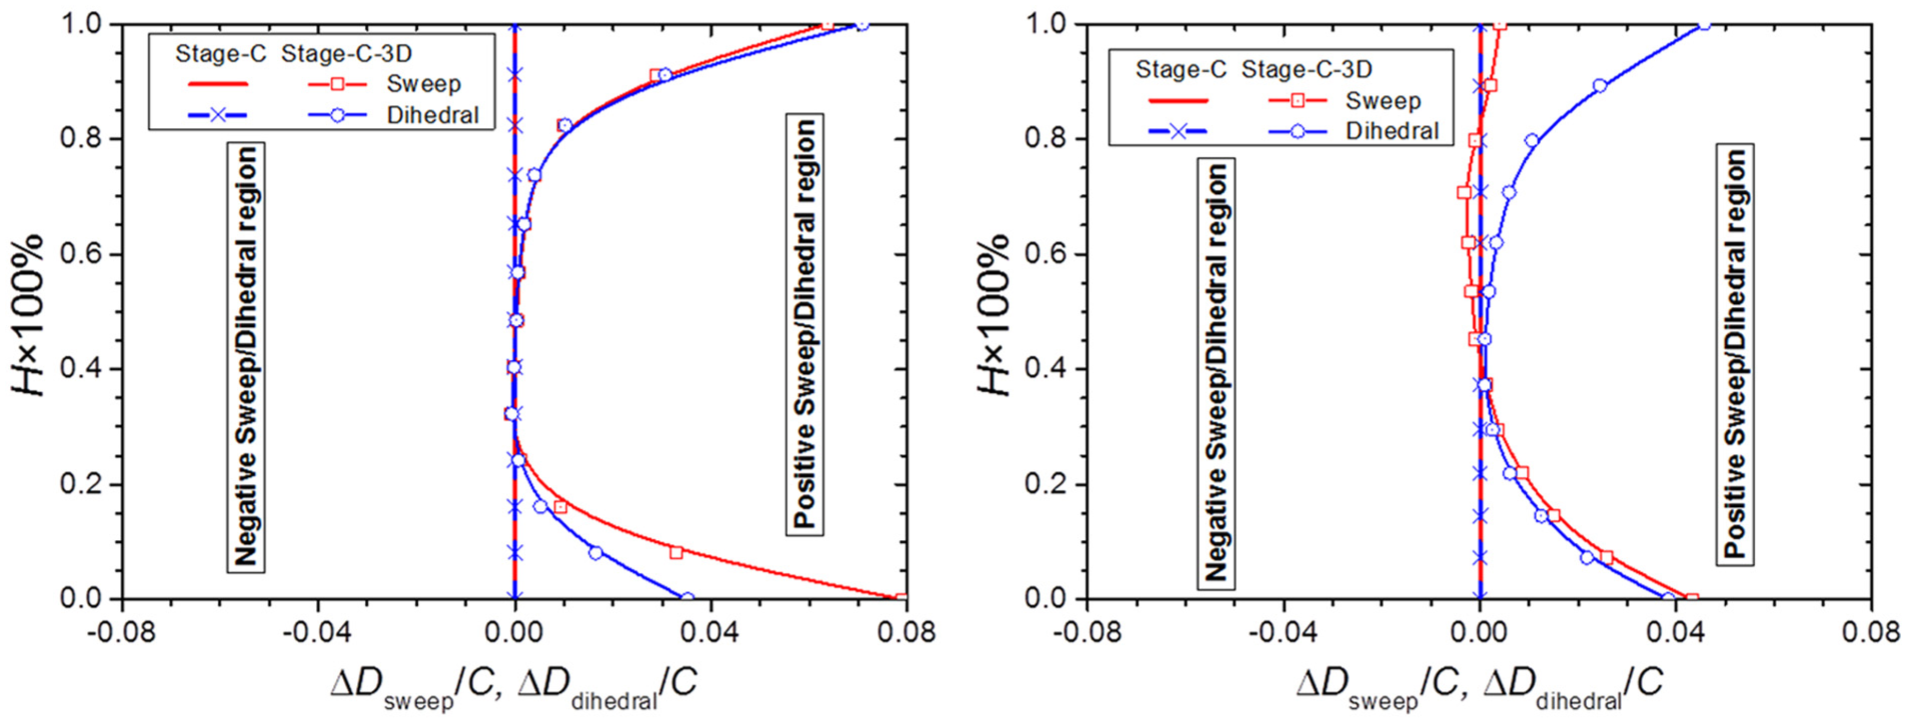
Radial variations in the blade elements’ displacement for the sweep and dihedral designs of the rotor (left) and stator (right) blades in Stage-C-3D (ΔD is the relative displacement of the blade elements in Stage-C-3D compared to that in Stage-C; C is the blade chord length).
Discussion of the effects of blade 3D designs
The improvement of compressor performance
Figure 18 shows the predicted compressor performance characteristics of Stage-C and Stage-C-3D with the rotor tip gap of about 0.5% blade span. The DE, MSPR, and NS indicate the design (ϕ = 0.52), maximum static pressure rise (ϕ = 0.46), and near-stall (ϕ = 0.408) conditions for Stage-C-3D, respectively. It can be seen that the 3D bladings in Stage-C-3D make a very little decrease in static pressure rise coefficient at the DE condition; however, it increases as the mass flow rate ϕ < 0.49. It should be noted that in Stage-C, the computed NS condition (numerical non-convergence points) is at the mass flow rate of ϕ = 0.44, which means a significant stall margin improvement was achieved in Stage-C-3D. Compared to that in Stage-C, the non-radial stacking line designs in Stage-C-3D gain a distinct improvement of the isentropic efficiency at any inlet mass flow rate conditions. The isentropic efficiency increases about 0.5 points at the DE condition; however, it increases about 1.5 points at the MSPR condition. At the NS condition, although the mass flow rate decreases from φ = 0.44 in Stage-C to ϕ = 0.408 in Stage-C-3D, the isentropic efficiency still increases 2.3 points.
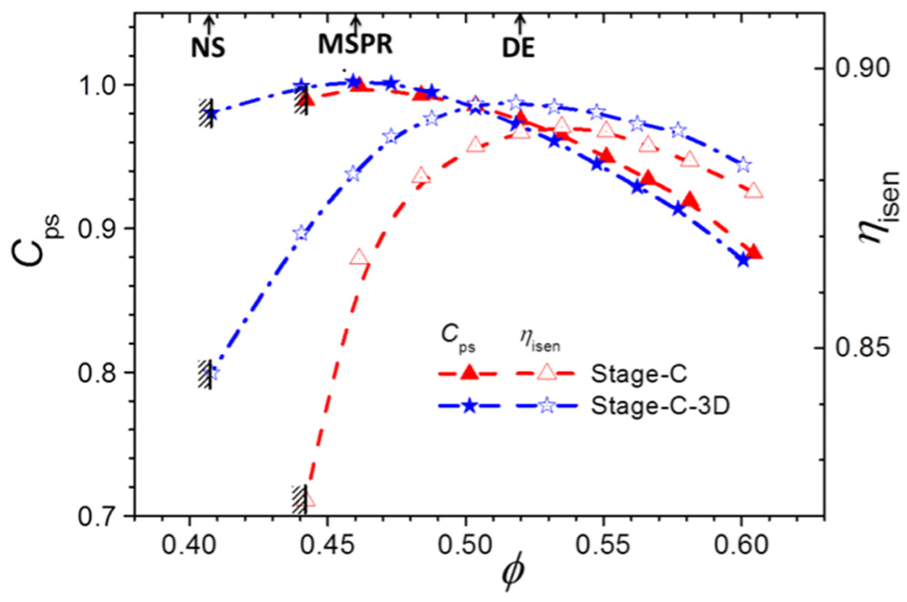
Comparison of the predicted compressor characteristics of Stage-C and Stage-C-3D with the rotor tip gap of about 0.5% blade span.
The effects on 3D flows at the DE condition
As mentioned above, forward sweep and positive dihedral were employed to reduce blade tip loading and decrease the strength of the tip leakage flow, which can be seen clearly in Figures 19–21. The computed static pressure contours for the rotor passage of Stage-C and Stage-C-3D near the blade shroud (98.7% span) are given in Figure 19. The solid lines denote the results of Stage-C and the dashed lines depict the results of Stage-C-3D. Clear pressure troughs, starting near the blade leading edge at the suction surface side and propagating to the pressure surface of the adjacent blade, can be seen in both the solid and dashed isolines. These pressure troughs are caused by the tip leakage vortex. The trajectory of the vortex core usually coincides with the pressure trough. Moreover, the deeper the pressure trough, the stronger the tip leakage vortex. Obviously, the pressure trough for Stage-C is deeper than that for Stage-C-3D, which means the tip leakage vortex in Stage-C-3D is weaker than that in Stage-C.
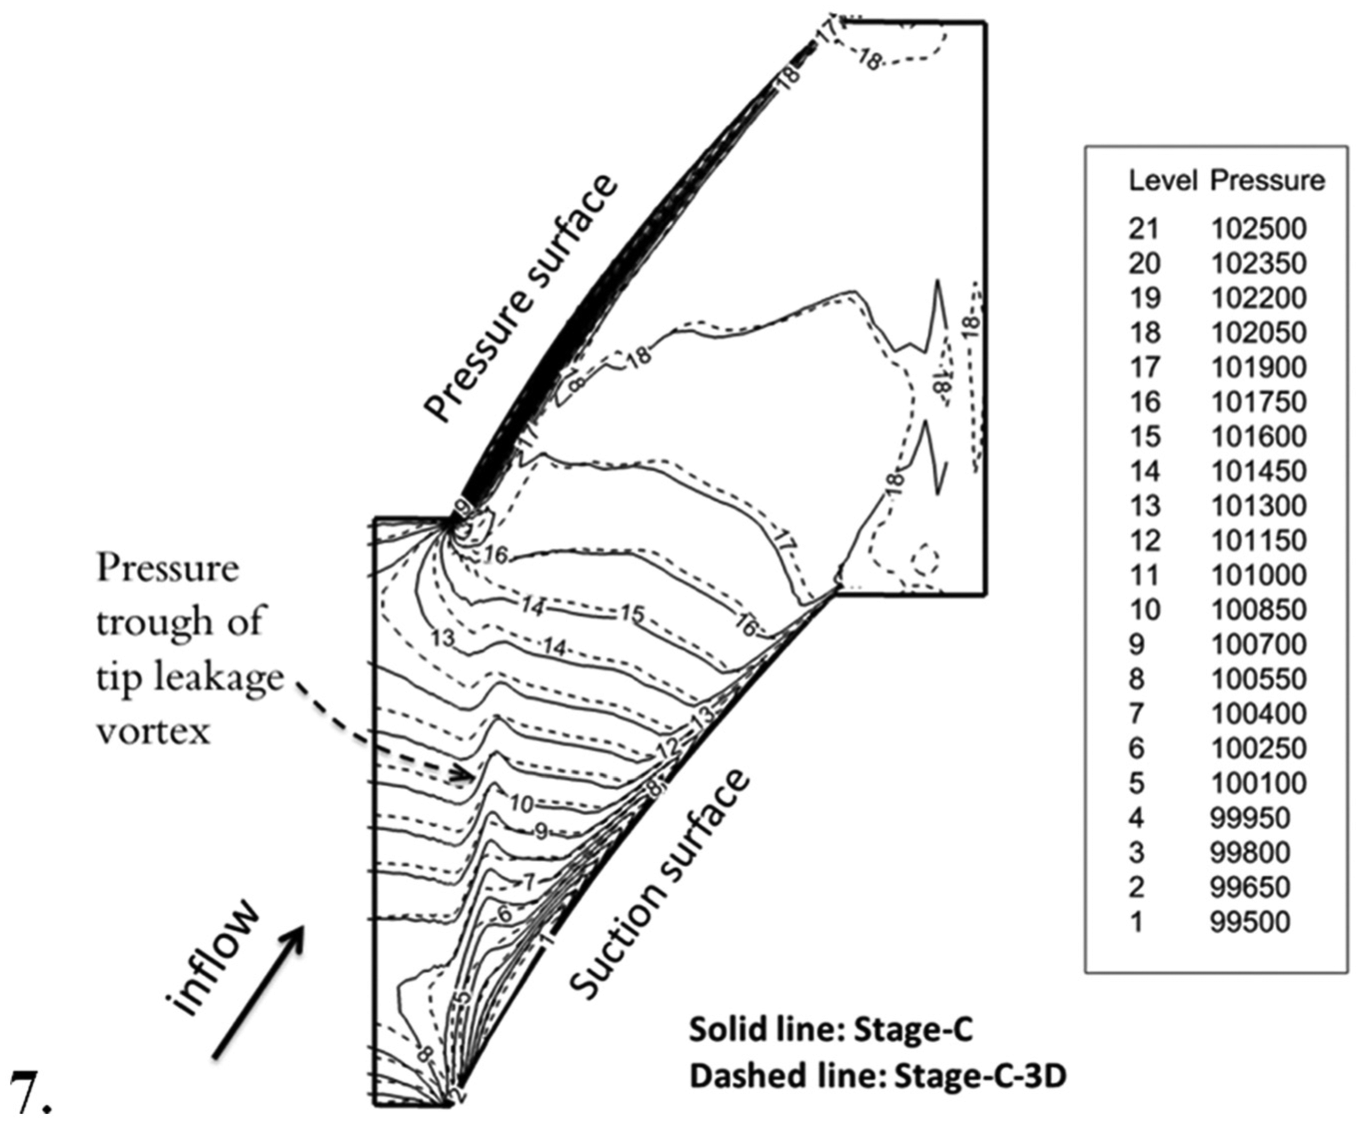
Computed static pressure contours for the rotor passage of Stage-C and Stage-C-3D (98.7% span plane, design condition).

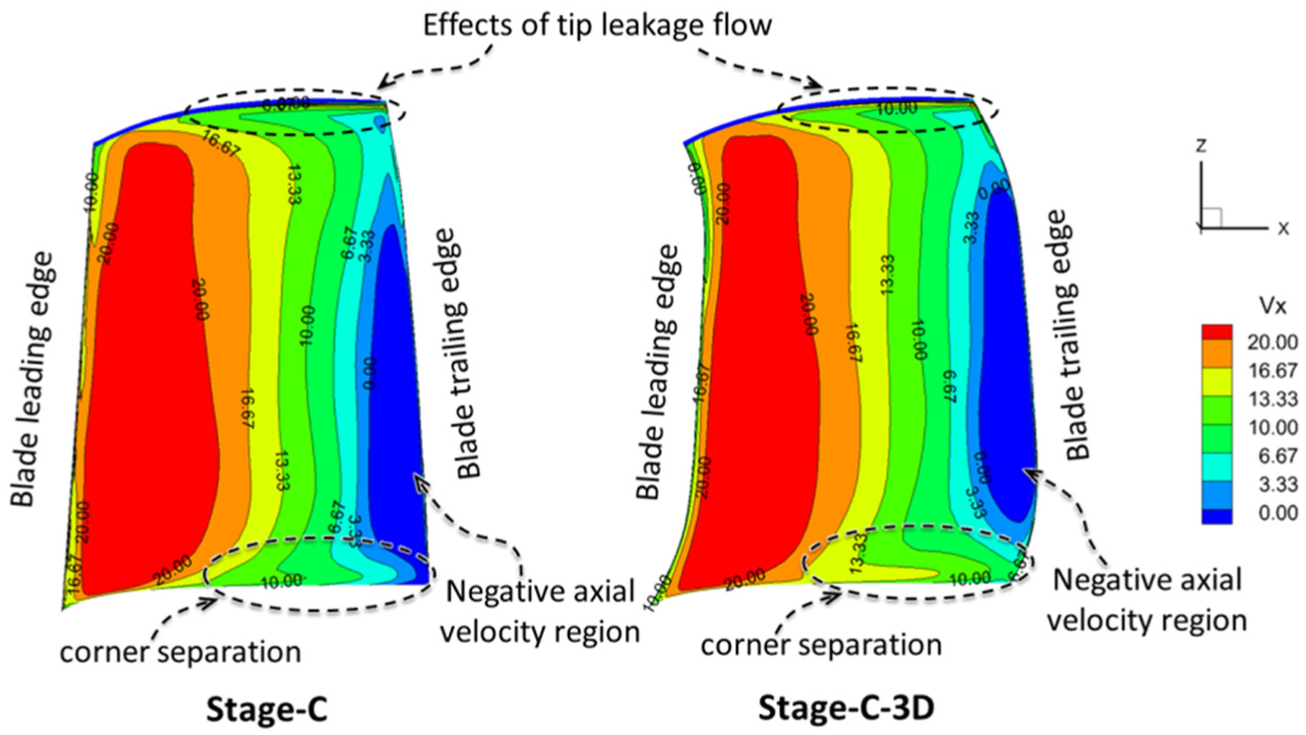
Computed rotor outlet axial velocity contours for Stage-C and Stage-C-3D (design condition).
Computed near-suction surface axial velocity contours for the rotor of Stage-C and Stage-C-3D (design condition).
The computed rotor outlet axial velocity contours for both the two compressors are shown in Figure 20. The near-shroud low-momentum flow, for which the tip leakage flow contributes much, can be seen clearly. It is evident that the tip flow blockage decreases in Stage-C-3D compared to that in Stage-C, which can also approve the weakening of the tip leakage flow for the 3D designs of the rotor blade in Stage-C-3D. The axial velocity trough near the rotor blade tip depicted in Figure 21 can also indicate the effect of the tip leakage flow. In Stage-C-3D, compared to that in Stage-C, the tip axial velocity trough appears as a slight shallower trench, which also means that the tip leakage flow in Stage-C-3D is weaker than that in Stage-C.
It should be noted that as analyzed above, although the strong tip leakage flow in Stage-C was weakened in Stage-C-3D using the blade non-radial stacking methods, the improvement seems very slight than that as expected. As can be seen in Figure 19, the trajectory of the tip leakage vortex changed a little and has no obvious downstream-shift in Stage-C-3D. Considering that the trajectory of the tip leakage vortex has a very close relationship with the stall of the compressors, 40 the improvement of the compressor stall margin introduced based on the numerical results in the above section and shown in Figure 18 should be analyzed with caution.
As can be seen in Figures 20 and 21, because of the positive dihedral near the rotor hub in Stage-C-3D, the low-momentum flow migrates much more to the upper blade spans, resulting in the weakening of the accumulation of the low-momentum flows at the hub corner and a weakened corner separation in Stage-C-3D compared to that in Stage-C. The radial distributions of the diffusion factor for the rotor blades of Stage-C-3D and Stage-C at the design condition are compared in Figure 10. Due to the rotor blade non-radial stacking line design in Stage-C-3D, a very slight decrease in blade diffusion factor can be seen clearly at both the rotor tip and the mainstream regions.
The results shown in Figures 22 and 23 indicate the significant strength reduction in the near-hub endwall secondary flow and corner separation (the significant low axial velocity region) in the stator of Stage-C-3D compared to that in Stage-C. Hence, the re-stacking of the blade elements near the hub of the stator blade is very effective. As can be seen from the results shown in Figure 10, it is clear that the stator blade non-radial stacking line design in Stage-C-3D releases the loading at the endwall regions, but increases the blade loading away from the endwall.

Computed stator outlet axial velocity contours for Stage-C and Stage-C-3D (design condition).

Computed near-suction surface axial velocity contours for the stator of Stage-C and Stage-C-3D (design condition).
The effects on 3D flows at the off-design conditions
Figure 24 shows the calculated circumferential mass-averaged radial variations in axial velocity density ratio (AVDR) at the DE, MSPR, and NS conditions for the rotor blade rows in both Stage-C and Stage-C-3D. The results show that in Stage-C-3D, at the DE and MSPR conditions, the radial distributions of AVDR decrease a little above 70% span and increase slightly below 70% span, which means that the mass flow shifts from the near-shroud region to the lower spans slightly. Thus, the flow near the rotor blade tip suffers a relatively larger meridional flow expansion in Stage-C-3D. Moreover, because of the decrease in local mass flow rate near the blade shroud, the local incidence angle near the rotor blade tip might increase. As a result, an opposite effect which can counterbalance the effect of blade forward sweep (i.e. release of the local blade loading and weakening of the strength of the tip leakage flow) is obtained. Hence, it should be the reason why the expected significant weakening of the tip leakage flow in Stage-C-3D was not achieved as mentioned above. At the NS condition, the results shown in Figure 24 show that AVDR in the rotor of Stage-C-3D decreases significantly above 75% span but increases significantly below 75% span. Hence, the very slight radial mass flow rate redistribution effect appearing at the DE and MSPR conditions enhances significantly at the NS condition. Consequently, the efficiency near the rotor tip region degrades significantly at the NS condition as shown in Figure 25. However, because of the mass flow rate redistribution effect, much more mass flow propagating downstream undergoes a high-efficiency process (Figure 25, the mainstream flow always has much higher flow efficiency compared to the endwall flows), which can contribute to the efficiency gain obtained in Stage-C-3D mentioned in section “The improvement of compressor performance.”
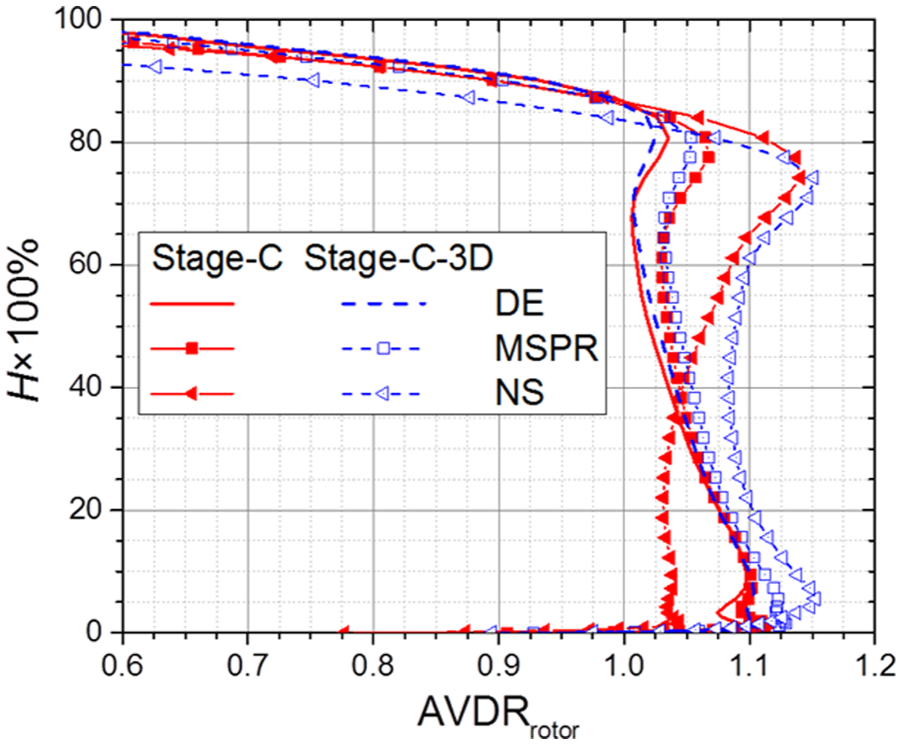
Calculated radial variations in AVDR for the rotor blade rows in both Stage-C and Stage-C-3D.

Calculated radial variations in the rotor isentropic efficiency in both Stage-C and Stage-C-3D.
The calculated radial variations in the total pressure loss coefficient and local mass flow rate coefficient at the outlet of the stator blade passage at the DE, MSPR, and NS conditions are shown in Figures 26 and 27, respectively. The results shown in Figure 26 indicate that the endwall flow losses are reduced significantly at the two endwall regions in Stage-C-3D and the effects are much more prominent at the small mass flow rate conditions, such as the MSPR and NS conditions. Obviously, the reduction in the total pressure losses in stator passage is mainly achieved by suppressing the endwall corner separations via 3D blade designs in Stage-C-3D. Moreover, the suppression of endwall corner separation can also result in the increase in local mass flow rate near the endwall regions (Figure 27). Considering that for subsonic realm the flow in the rotor may be influenced significantly by the potential effects of the downstream stator, the spanwise redistribution of mass flow rate in stator passage may cause the unexpected mass flow rate downwash in the rotor passage as analyzed above. Hence, there should be a strong rotor–stator coupling effect for the 3D blade designs in such an ultra-highly loaded compressor stage. Hence, the designs of the non-radial stacking lines for rotor or stator blade should always be considered in the whole stage configuration.

Calculated radial variations in stator total pressure loss coefficient in both Stage-C and Stage-C-3D (

Calculated radial variations in stator outlet mass flow rate coefficient in both Stage-C and Stage-C-3D (
Conclusion
In order to realize whether the rules for controlling the blade 3D stacking line in a compressor with conventional loading level could be used for the design of a highly loaded compressor, in this work, the effects of 3D bladings in an ultra-highly loaded compressor stage were studied and investigated numerically. In this article, we first re-designed the original three blade rows (Stage-A) in a low-speed axial compressor test facility by increasing the stage loading level from ψ = 0.35 to 0.52 (loading level beyond the state of the practice). The newly designed compressor stage with ultra-high loading coefficient was named as Stage-C. In this stage, the key through-flow design parameters, such as the radial variations in the pre-swirl angle, the total pressure rise across rotor blade, and the stage degree of reaction, and also some critical blade geometrical parameters, such as the profiles of blade elements and the radial variations in blade solidity, were well chosen to make sure it can achieve high compressor performance characteristics which can represent the state-of-the-art design level. However, all the three blade rows were still designed with radial stacking lines. In the second step, we re-designed the rotor and stator blades in Stage-C again with non-radial stacking line designs to suppress the strong secondary flows in both the rotor and stator blade rows, which was hoped to achieve a 1-point compressor efficiency profit. The newly designed compressor was named as Stage-C-3D. Finally, based on some numerical works, the performance change in the two re-designed compressors and also the effects of blade 3D stacking on the development of the complicated flows, including rotor tip leakage flow, endwall secondary flow, and corner separation flow, were discussed in depth. Based on these works, the following conclusions can be drawn:
With the careful choices of the aerodynamic and geometrical design parameters accompanied using CDA with spikeless leading edge, Stage-C was designed successfully which can achieve an ultra-high loading coefficient of 0.52 with high peak efficiency of about 0.89.
Stage-C-3D was re-designed with non-radial stacking of the rotor and stator blades in Stage-C. It retained the high-pressure rise characteristics of Stage-C but achieved much significant efficiency improvement along the whole characteristics line.
In Stage-C-3D, endwall bending (positive dihedral accompanied by some extent of forward sweep) could suppress the massive corner separation and strong endwall secondary flows effectively even in the highly loaded compressor stage.
In Stage-C-3D, the rotor blade forward sweep released the blade tip loading and reduced the strength of the tip leakage flow. However, because of strong rotor–stator coupling effects in the highly loaded compressor stage and due to the suppression of endwall corner separation in the stator passage, the mass flow in the upstream rotor shifted to its lower spans, which could act as an opposite effect to counterbalance the effect of blade forward sweep. As a result, the blade forward sweep in the rotor of Stage-C-3D seems to gain little benefit of the compressor performance improvement.
Footnotes
Academic Editor: Fakher Chaari
Declaration of conflicting interests
The author(s) declared no potential conflicts of interest with respect to the research, authorship, and/or publication of this article.
Funding
The author(s) disclosed receipt of the following financial support for the research, authorship, and/or publication of this article: This study was supported by the National Natural Science Foundation of China (grant nos 51376014, 51476004, and 51006007).