
Abstract
A new retrofitting system is proposed for reinforced concrete structures with application of near-surfaced mounted smart basalt fibre–reinforced polymer bar. The distributed optical fibre sensing technology, namely pre-pump pulse Brillouin optical time-domain analysis, is applied as the sensing technology for the smart bar. Then the proposed system is explained in detail from both self-sensing and strengthening. Finally, some experiments were implemented with reinforced concrete beams to verify the actual effects. From the results, it is concluded that the ultimate strength and the stiffness after steel rebar yielding can be increased obviously due to the high strength and ultimate strain of the smart basalt fibre–reinforced polymer bar. Meanwhile, the structure strain distribution can be measured with the smart basalt fibre–reinforced polymer bar, with which some key parameters can be well assessed, such as crack location, crack width, displacement and bending moment. However, the self-sensing effects indeed have been obviously influenced by the strain measurement accuracy especially after concrete cracking. Therefore, it is meaningful to improve the sensing accuracy especially for complicated strain. Additionally, some prestress upon the smart basalt fibre–reinforced polymer bar can improve both sensing and strengthening performance.
Keywords
Introduction
Around the world, many reinforced concrete (RC) structures have been constructed for living and transportation. These structures are of varying quality and function, but it is natural that they are all ageing and deteriorating over time. And errors may have been made during the design or construction phase as well. In addition, new demands from the transportation sector are increasing all the time. Under all these factors, many structures need to be upgraded or replaced. The former method is economical and becoming more and more practical especially with the development of the new materials of high performance, such as fibre-reinforced polymer (FRP).
Due to its high strength-to-weight ratio and excellent corrosion resistance, FRP system externally bonded to strengthen the RC structures has particularly become very popular over the past decade. 1 Over the last few years, a new strengthening technique, near-surfaced mounted (NSM) FRP strengthening system, has emerged for the RC structures as a valid alternative to externally bonded FRP bars or sheets. As for NSM FRP strengthening, FRP bars or strips are embedded using epoxy paste or cement grout into grooves cut in the cover of a concrete member, which has been considered to show a lot of advantages over externally bonded FRP reinforcement, such as less installation labour, less debonding probability, more reliable prestress and anchoring.2–4
However, the potential strengthening failure has upset the designers, such as the interface debonding and brittle fracture of the unidirectional reinforced FRP. To improve the situation, some sensing methods were introduced to monitor the performance of FRP. Yang et al. 5 used the electrical properties of carbon fibre–reinforced polymer (CFRP) to monitor the damage of the CFRP and strengthened structure. Kumagai et al. 6 mixed the carbon particles into the resin and made a smart glass fibre–reinforced polymer (GFRP) rod, which was embedded into the concrete specimen to implement structural monitoring. Qiu et al. 7 embedded shape memory alloy (SMA) wires into composite plates to monitor the strain. However, due to some inherent limitations, such as low accuracy and stability, some obvious improvements should be made with these methods for actual application.
Due to their excellent sensing properties and small size, the fibre optic sensors have attracted much attention, among which the sensors based on Fabry–Perot, fibre Bragg grating (FBG) and Brillouin scattering are much more popular than others. B Benmokrane and colleagues8,9 glued the Fabry–Perot sensors on GFRP bars to measure the static and dynamic strain of FRP-reinforced bridge decks. Alexander Kalamkarov et al. 10 used the smart GFRP bars with embedment of Fabry–Perot fibre optic sensors to reinforce the concrete beam in conjunction with steel bars. The smart GFRP bars were verified with the characteristic of high accuracy and data acquisition speed. However, the multiplexing performance is not as good as expected, reducing their advantages greatly in actual application.
FBG is most popular in laboratory researches and field applications because of excellent accuracy, data acquisition speed, stability and multiplexing performance. Jinping Ou, Zhi Zhou and their research group have done much work about the smart FRP with embedded FBG sensors. They have investigated the basic sensing properties of the optical fibre Bragg grating (OFBG)-FRP bars and used these smart bars to reinforce concrete structures with the profit of structural health monitoring (SHM).11–13 From the experimental results, it was found that the structural strain could be measured with the OFBG-FRP bars’ high accuracy and the damage could be detected from the load–strain curve. Some other researchers have finished some useful work as well.14,15
Even though the sensing performance of FBG sensors is excellent, there is still some inherent deficiency as well as Fabry–Perot sensors, which will influence their application effects in the infrastructures. They are the sensors of the ‘pointed sensing’ type, meaning that they can only give an exact strain measurement of the location where they are installed. As shown in Figure 1, if some random damage happens at the location away from the FBG or Fabry–Perot sensors, the strain measured by the sensors may fail to detect the damage completely. However, the distributed sensing techniques, such as Brillouin optical time-domain reflectometer (BOTDR) and Brillouin optical time-domain analysis (BOTDA), will make a good future. With the new type of sensing technology, the strain can be measured at each location along the sensing optical fibre (OF) by obtaining and analysing the reflected Brillouin scattering light. It is well known that the local strain will change obviously where some local damage happens such as concrete crack. Therefore, random damage can be detected from the sharp change in the strain distribution curve as the OF sensors can cover the span along the whole structure with a low cost. However, it will cost too much if FBG or Fabry–Perot sensors are installed with the same distributed style.

Random damage monitoring with different fibre optic sensing techniques.
Zhishen Wu et al. bonded the fibre optic sensors with BOTDR on the surface of the poly-p-phenylene benzobisoxazole (PBO) FRP sheet used to retrofit the concrete beam. During the static load tests, they obtained the continuous strain distribution along the whole beam successfully. 16 Filippo Bastianini et al. also obtained the strain distribution of a concrete bridge under static load with BOTDR. However, the fibre optic sensors were embedded into FRP. 17 Z Zhou et al. 18 embedded the fibre optic sensors with BOTDA into FRP bars and obtained good strain properties of these smart bars. They set these smart bars in a concrete beam and used their strain information to detect the slip between FRP bar and concrete as well as the crack through a mathematical way. 19 However, due to the poor measurement accuracy and the spatial resolution, the strain measured was not very exact, so the damage could not been detected from the strain distribution directly. The best spatial resolution for BOTDR is 1 and 0.5 m for BOTDA in Zhi Zhou’s researches. As well known, the common crack may cause strain concentration within about several centimetres, so the value of the strain measurement averaged in 0.5 or 1 m will be too small to detect the damage in actual structures other than the load–strain curve in the experiments. Therefore, the spatial resolution should be improved enough to reflect the strain change around the location where damage happens. Another problem is the measurement accuracy. For example, the strain accuracy is 30 µε for BOTDR of the machine AQ8603 made by Ando company. The strain accuracy will be greatly decreased at some cases such as stiff strain change within the sensing length of the spatial resolution and so on. The system named pre-pump pulse Brillouin optical time-domain analysis (PPP-BOTDA) was developed by Neubrex company with a spatial resolution of 10 cm. 20 However, the strain accuracy is not improved too much for the machine NBX-6000, only up to 25 µε, while it is up to 7.5 µε for NBX-6050. Considering the sensing advantage of PPP-BOTDA, the author embedded the fibre optic sensors into FRP bars to make a new type of smart material with this technique. 21
In author’s researches, the basalt fibre–reinforced polymer (BFRP) is selected as the strengthening part. 21 CFRP has the best mechanical performance among the FRP materials. However, the cost is too expensive especially for the infrastructures as the total amount of expectedly applied FRP is surprisingly large. Another problem of CFRP is that its ultimate strain is much smaller than that of GFRP and BFRP. Therefore, if some large prestress is applied, the CFRP bars may fracture before the structures’ failure. It will make the structures brittle to some extent, which is not a good design. Compared to GFRP, the resistance of BFRP to environment is more promising.
As mentioned above, it is meaningful to use NSM FRP system to strengthen the RC structures. However, the safety and structural performance should be paid much attention. Therefore, the monitoring system is introduced reasonably. In this article, the type of smart BFRP bars based on PPP-BOTDA is proposed as the retrofitting materials with both monitoring and strengthening functions. In the author’s another article, 21 the basic sensing and mechanical properties of the smart BFRP bar have already been investigated in detail, while in this article it is focused on how to use the smart BFRP bar to strengthen and monitor the existing RC structures, namely, constructing the methods of increasing the structural ultimate strength, monitoring the structural strain distribution, detecting the concrete cracks and assessing the structural displacement and inner force. Totally, the basic aim of the research in this article is to make the existing RC structures ‘strong’ and ‘smart’ based on the proposed smart BFRP bar as mentioned in Tang et al. 21
Sensing principle of PPP-BOTDA
The conventional BOTDA technique is based on the stimulated Brillouin back scattering. When the frequency difference between the two lasers introduced into the OF from different ends is equal to the shift of Brillouin centre frequency, the back Brillouin scattering will be stimulated, and energy transfer will be generated between the two lasers as well. To enhance the accuracy and the spatial resolution, Neubrex company introduced an advanced technique using a pre-pump pulse in front of a traditional laser pulse to develop a system called PPP-BOTDA with the characteristics of 10 cm spatial resolution, ±25 µε, 1°C measurement accuracy and more than 20 km sensing distance. 20 The sensing principle of PPP-BOTDA is shown in Figure 2.

Sensing principle of PPP-BOTDA.
The Brillouin frequency shift νВ of OF changes in proportion to the variation in strain or temperature along the OF. The linear relationships between the Brillouin frequency shift and strain or temperature are given as


where Cε and CT are the strain and temperature coefficients, respectively, and T0 and ε0 are the strain and temperature at a reference Brillouin frequency νВ0, respectively.
Fabrication and properties of smart BFRP bars 21
To manufacture the smart BFRP bars, fibre optic sensors are embedded into BFRP bars during the industrial fabricating process. However, the common commercial OF is so fragile that it may be broken since the fibres will be extruded during the manufacture process. So the OF is first strengthened with braiding basalt fibres around it. Then it is introduced into the manufacturing system. To get enough free OFs for connecting with other OFs, some methods are proposed to make a certain length of the bar uncured at the position where connection between the OFs is needed. The sample of smart BFRP bar with some free OFs is shown in Figure 3.

Smart BFRP bar with free optical fibre.
Some experiments were performed to investigate the properties of this type of smart FRP material before applying it into RC structures. It is shown in the experimental results that the smart bar is characterized by large ultimate strain, high strength and excellent strain-sensing properties, namely, good measuring accuracy, repeatability and linearity. Some of the results are shown in Table 1 and Figure 4. The detailed results and analysis can be found in the author’s another article. 21
Main fundamental mechanical properties of basalt fibre and smart BFRP bar.

BFRP: basalt fibre–reinforced polymer.
Data are based on experiments of specimens with a diameter of 10 mm.
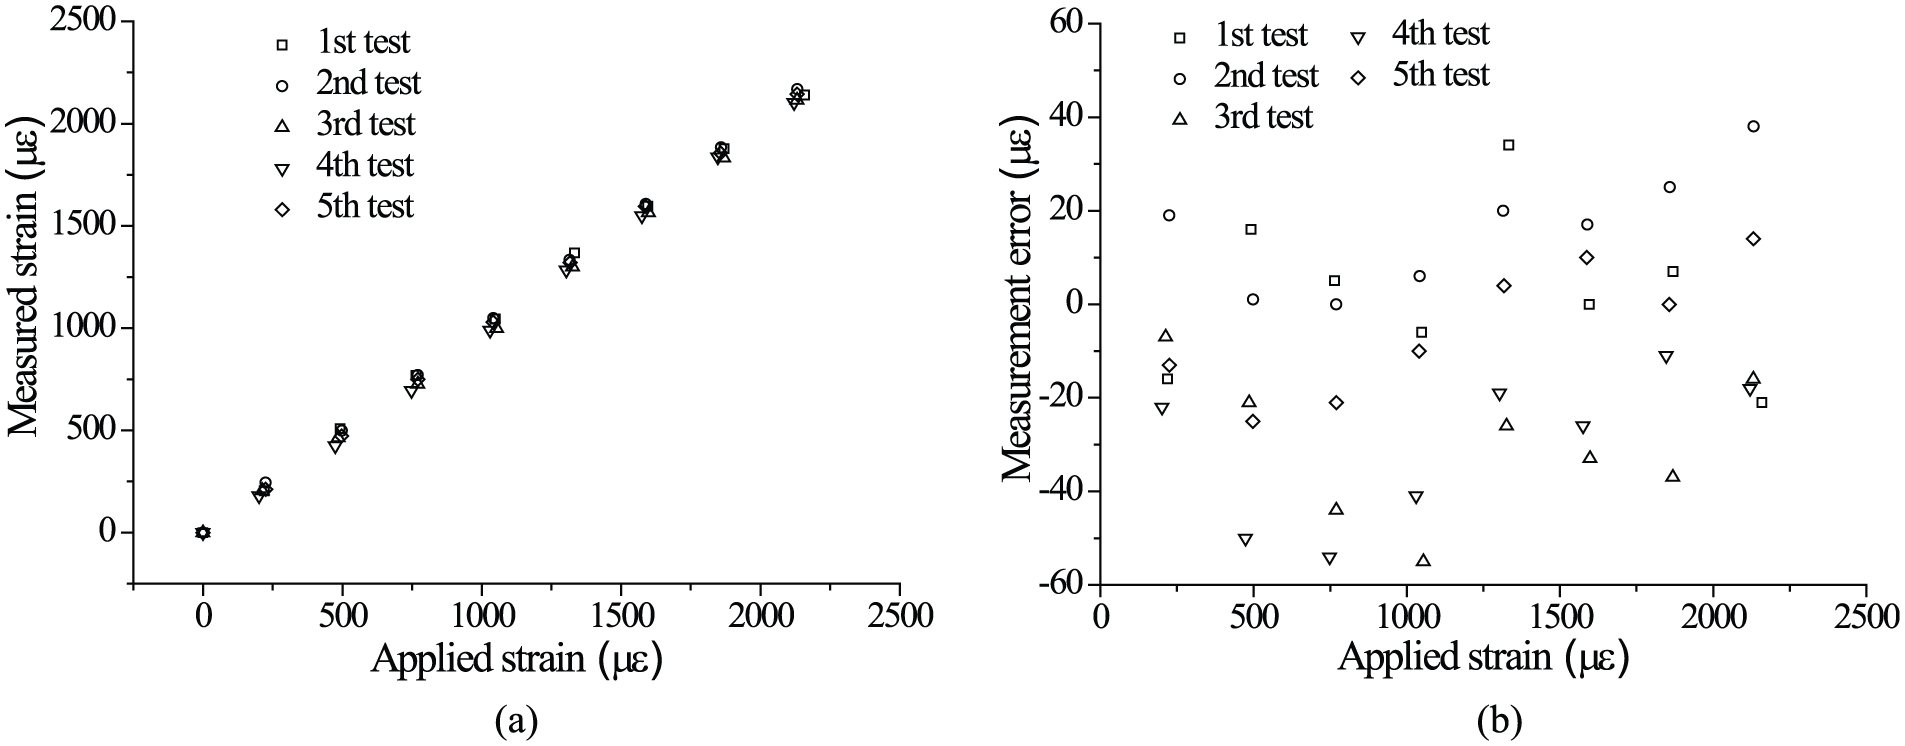
Strain-sensing properties of smart BFRP bars: (a) measured strain and (b) measurement errors.
Methods for monitoring and strengthening RC structures with NSM smart BFRP bars
Strengthening RC structure with NSM smart BFRP bar
The principle of strengthening RC structure with smart BFRP bar is shown in Figure 5. The traditional RC structure will lose further load capacity after steel yielding, making it unsafe especially under overloading or dynamic loading cases. After being retrofitted with smart BFRP bar, the load capacity of the structure will increase obviously. Meanwhile, the structure ductility will not decrease. Therefore, this type of strengthening method can satisfy the needs of both strength and deformation.

Principle of strengthening RC structure with smart BFRP bar.
To implement the retrofitting system, some concrete should be cut off from the concrete cover of the structure to make a groove at first. Then the glue material, epoxy resin grout, is filled into the groove. After that, the smart BFRP bar is embedded into the groove. Finally, one additional cover of the glue material is often needed to increase the integrity and strengthening performance.
The design theory of the RC structure can also be applied to analyse the proposed retrofitting system. Therefore, the detailed design theory is not explained in this article.
Crack monitoring
In this article, the crack monitoring includes detecting crack location and crack width. With the measured strain distribution from the smart BFRP bar, the crack can be easily located as there will be a sharp peak along the strain distribution where the crack happens. In actual application, some strain thresholds can be set to identify cracks.
The crack width can also be evaluated with the measured strain distribution. The most popular concrete crack model is the classical bond-slip model as shown in Figure 6, in which a supposition is proposed that in a neighbouring zone at two sides of the crack the slip develops between the reinforcing bar and the concrete. The strain of the reinforcing bar will get maximal value at the position of the crack and decreases sharply to the minimal value a distance away. There is a reverse trend for the strain distribution of the concrete. Another supposition is included as well that the minimal strain of the reinforcement


Bond-slip crack model for reinforced concrete.
Because generally

where
Displacement monitoring
The displacement distribution is a key parameter for structural evaluation. As well known, it is easy to calculate the displacement with the strain distribution especially for the flexural structures. Here, the traditional method, named conjugated beam method, is taken as an example to explain the way to obtain the displacement from the strain distribution.
According to material and structure mechanics theory, the absolute value of the displacement distribution in the original beam is equal to the absolute value of moment in the conjugated beam. Therefore, the strain distribution can be regarded as an appropriate simulation for arbitrary load conditions in the actual structures and load distribution in the conjugated structures, which is shown in equation (5)
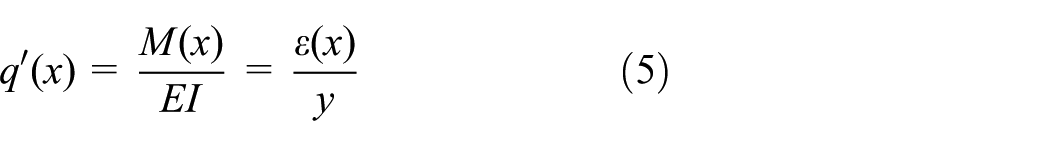
where
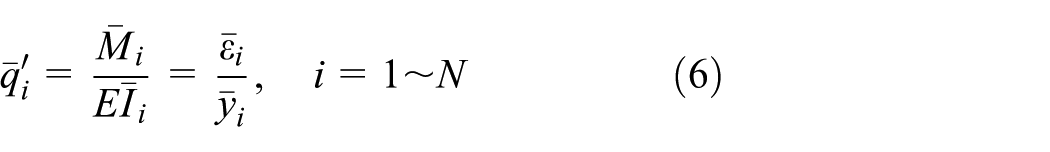
where
The simply supported beam model, of which the conjugated structure is shown in Figure 7, is taken as an example to explain the strain–displacement analysis method in detail. At first,


Load distribution along the conjugated beam for a simply supported beam.
The displacement of the original beam is equal to the moment of the conjugated beam at the same section. So the displacement distribution of the original beam can be expressed as equation (8)

Inner force monitoring
It is meaningful to implement inner force monitoring when the residual load-bearing capacity is assessed. Based on the knowledge of structure design and analysis, the bending moment can be easily obtained if all the stress distributions of the section are known as shown in Figure 8. The plane-section supposition is the basic theory for the structure design and analysis, meaning that the strains on the section vertical to the neutral axis distribute proportionally as shown in Figure 9. Therefore, all the strains can be obtained if the height of compressive zone xn is known, as the strain of the smart BFRP bar

Stress distribution of the section.
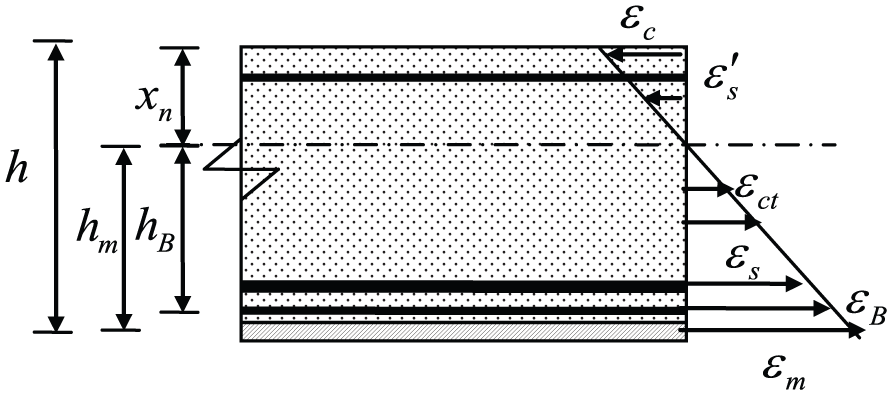
Strain distribution of the section.
The steel bar strain in tensile zone

where
The balance equation of the inner force for the section is equation (14)
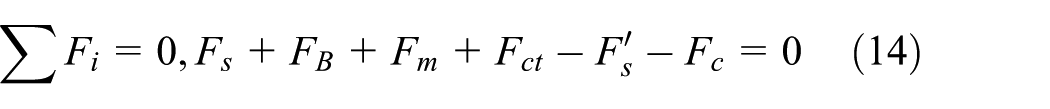
where
Then the bending moment of the section can be expressed as equation (15)

where
Experimental verification with concrete beams
Experimental description
The RC simply supported beam shown in Figure 10 was applied to verify the actual self-sensing and strengthening effects of the proposed retrofitting system. The original beam was 2 m long with a section of 150 mm × 300 mm. There were three steel rebars with a diameter of 14 mm in the tensile side and two rebars of 6 mm in the compressive side. Totally, four specimens were prepared, among which one was the controlled specimen, and the other three, denoted as 1#, 2# and 3#, respectively, were the experimental specimens strengthened with smart BFRP bars with a diameter of 10 mm. To prepare the experimental specimens, one or two grooves with a depth of 30 mm and width of 25 mm were made along the beams at the bottom at first. Then one smart bar was embedded in the groove filled with resin for Specimen 1#, two bars for Specimen 2# and one bar with a pre-strain of 5000 µε for Specimen 3#. After that, the whole beam bottom was coated with epoxy resin grout with a thickness of about 2 mm.

Experimental concrete beams strengthened with smart BFRP bars: (a) reinforced beam, (b) section for Specimens 1# and 3# and (c) section for Specimen 2#.
In the experiments, the specimens were loaded under a four-point manner through the hydraulic pressure system, as shown in Figure 11(a). Each span between two nearby points was 600 mm. One displacement transducer (DT) was set at the middle span of the beam to measure the largest displacement during the experiments as shown in Figure 11(b). The beams were divided into six elements and each element has the same size with a length of 300 mm. Some strain gauges were bonded on the surface of the steel bars when the concrete was cast. However, no one could work well after nearly 2 years. Therefore, the exact strains of the steel bars cannot be obtained through these strain gauges. The strains along the beams were measured with the OFs inside the smart BFRP bars by NBX-6000.
Experimental set-up and specimen: (a) test field and (b) element.
Results and analysis of distributed monitoring
A distinct characteristic of the smart BFRP bar is its strain-sensing properties. Therefore, the most advantage of application of smart BFRP bars to strengthen the existing concrete beams is to use the distributed monitoring information to evaluate the structural performance. In this article, with the sensing data from the smart bars, some parameters about the health of specimens can be obtained, such as crack location, crack width, displacement and moment distribution.
Strain distribution
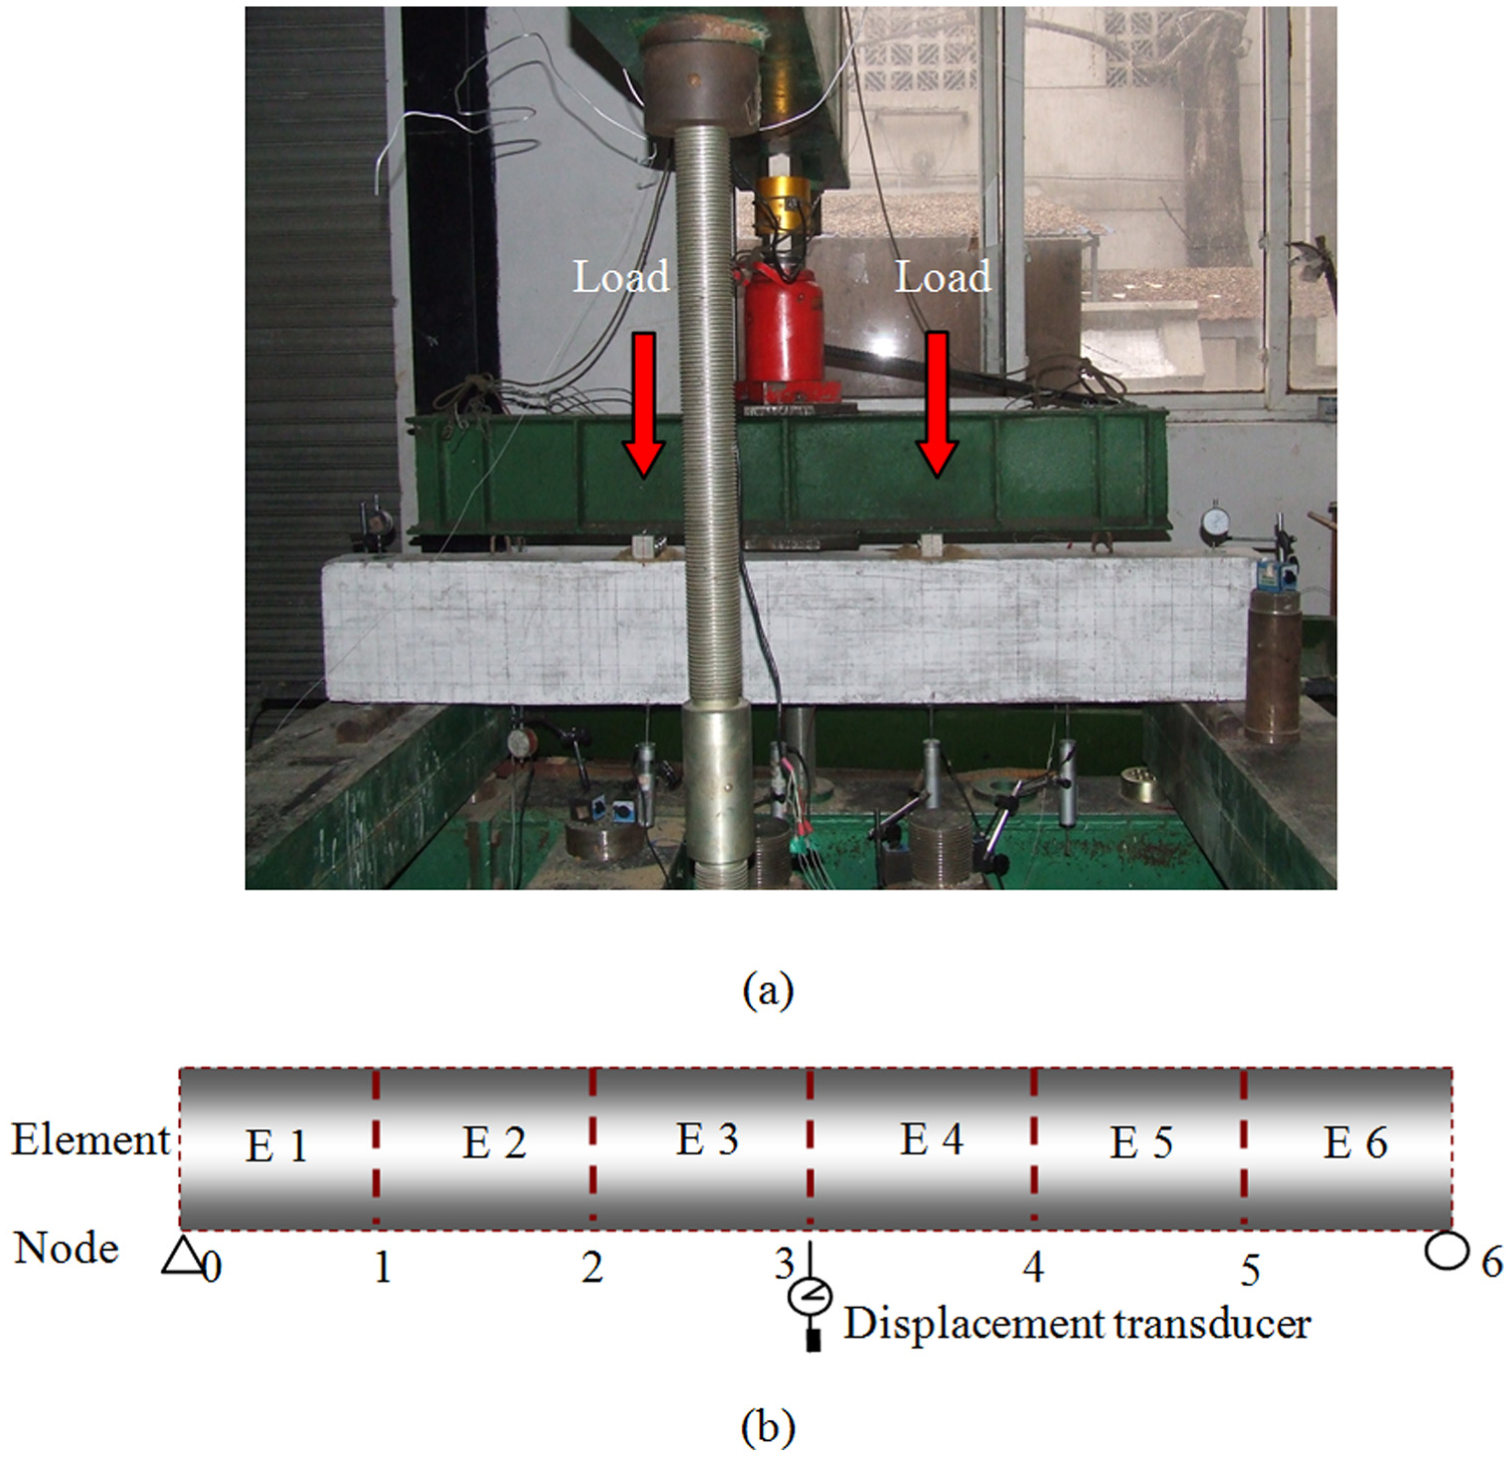
The strain distribution was measured every 5 cm along the OFs inside the bars as shown in Figures 12–14, which can reflect the strain distribution of the structure as the smart bars bond well with the concrete beam. However, the accordance will not always keep excellent, especially after the concrete crack has initiated while the epoxy grout keeps no crack. There is no obvious slip between the concrete and the smart bar, or the slip exists in a very small zone, because the epoxy grout bonds well with the smart bars and concrete. As aforementioned, the PPP-BOTDA has a spatial resolution of 10 cm, which means that the strain change should cover most part of the 10 cm so as to distinguish it. However, since the epoxy resin grout has a good bonding with the smart bars and concrete, the strain changes sharply within a very small zone nearby the concrete crack, which cannot be detected by the PPP-BOTDA. Then it is explainable that there is no distinguishing sharp peak of the strain distribution when the concrete cracks happen (shown in Figure 12), but there are several peaks of the strain distribution when the epoxy grout cracks happen (shown in Figure 13).
Strain distribution during the concrete crack initiation: (a) Specimen 1#, (b) Specimen 2# and (c) Specimen 3#.
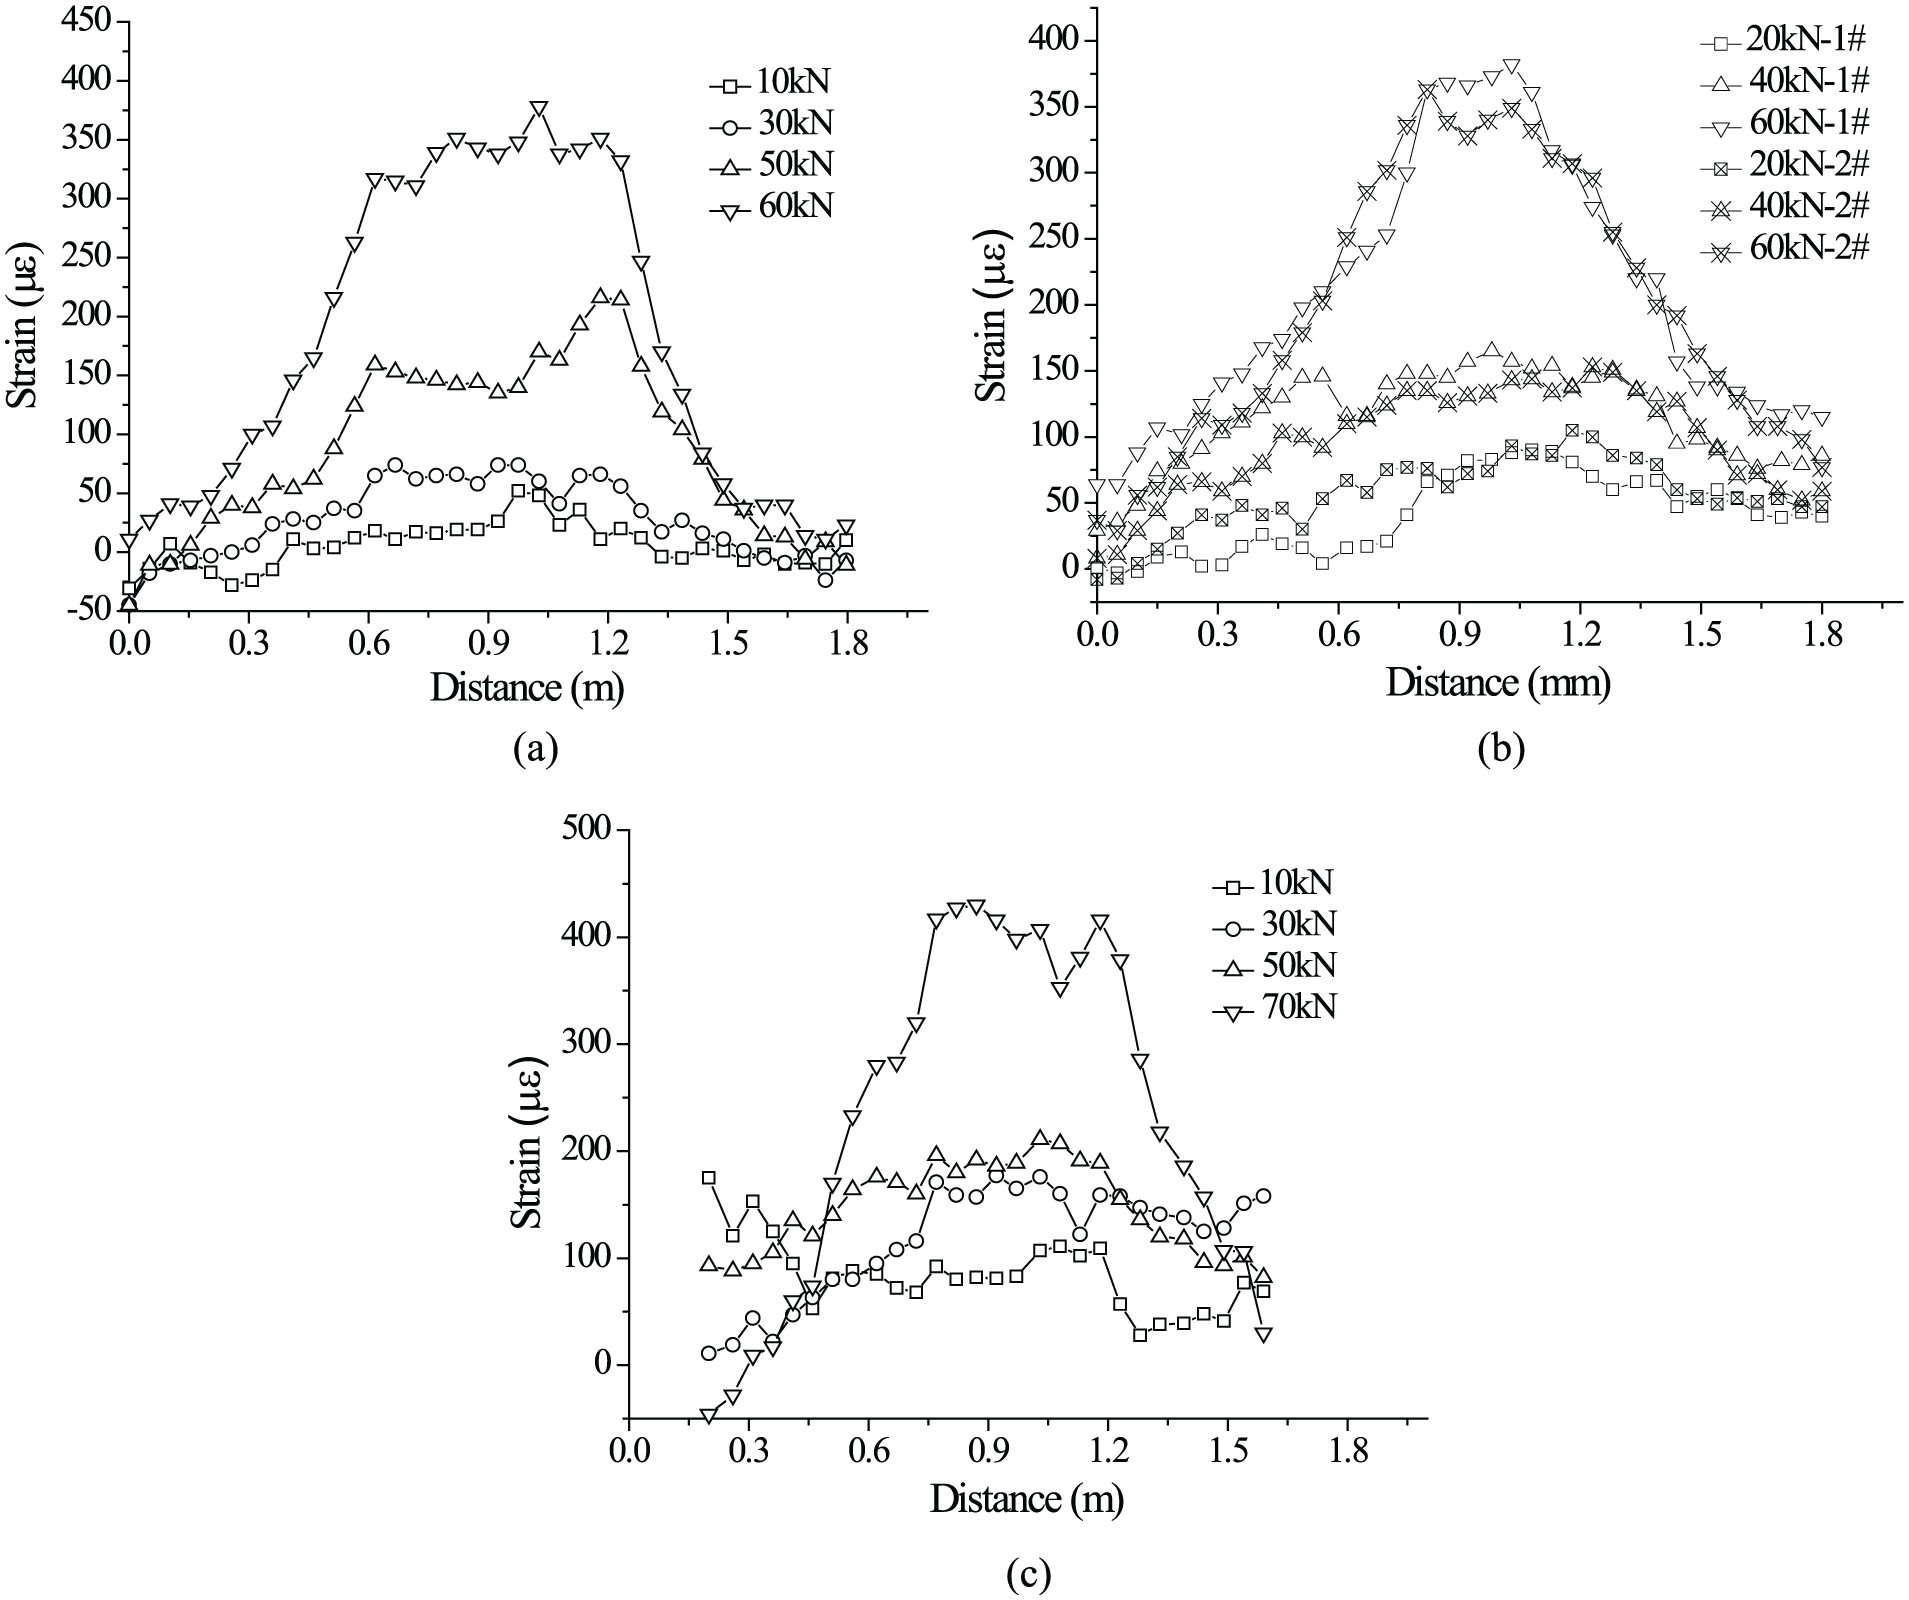
Strain distribution during the epoxy grout crack initiation: (a) Specimen 1#, (b) Specimen 2# and (c) Specimen 3#.

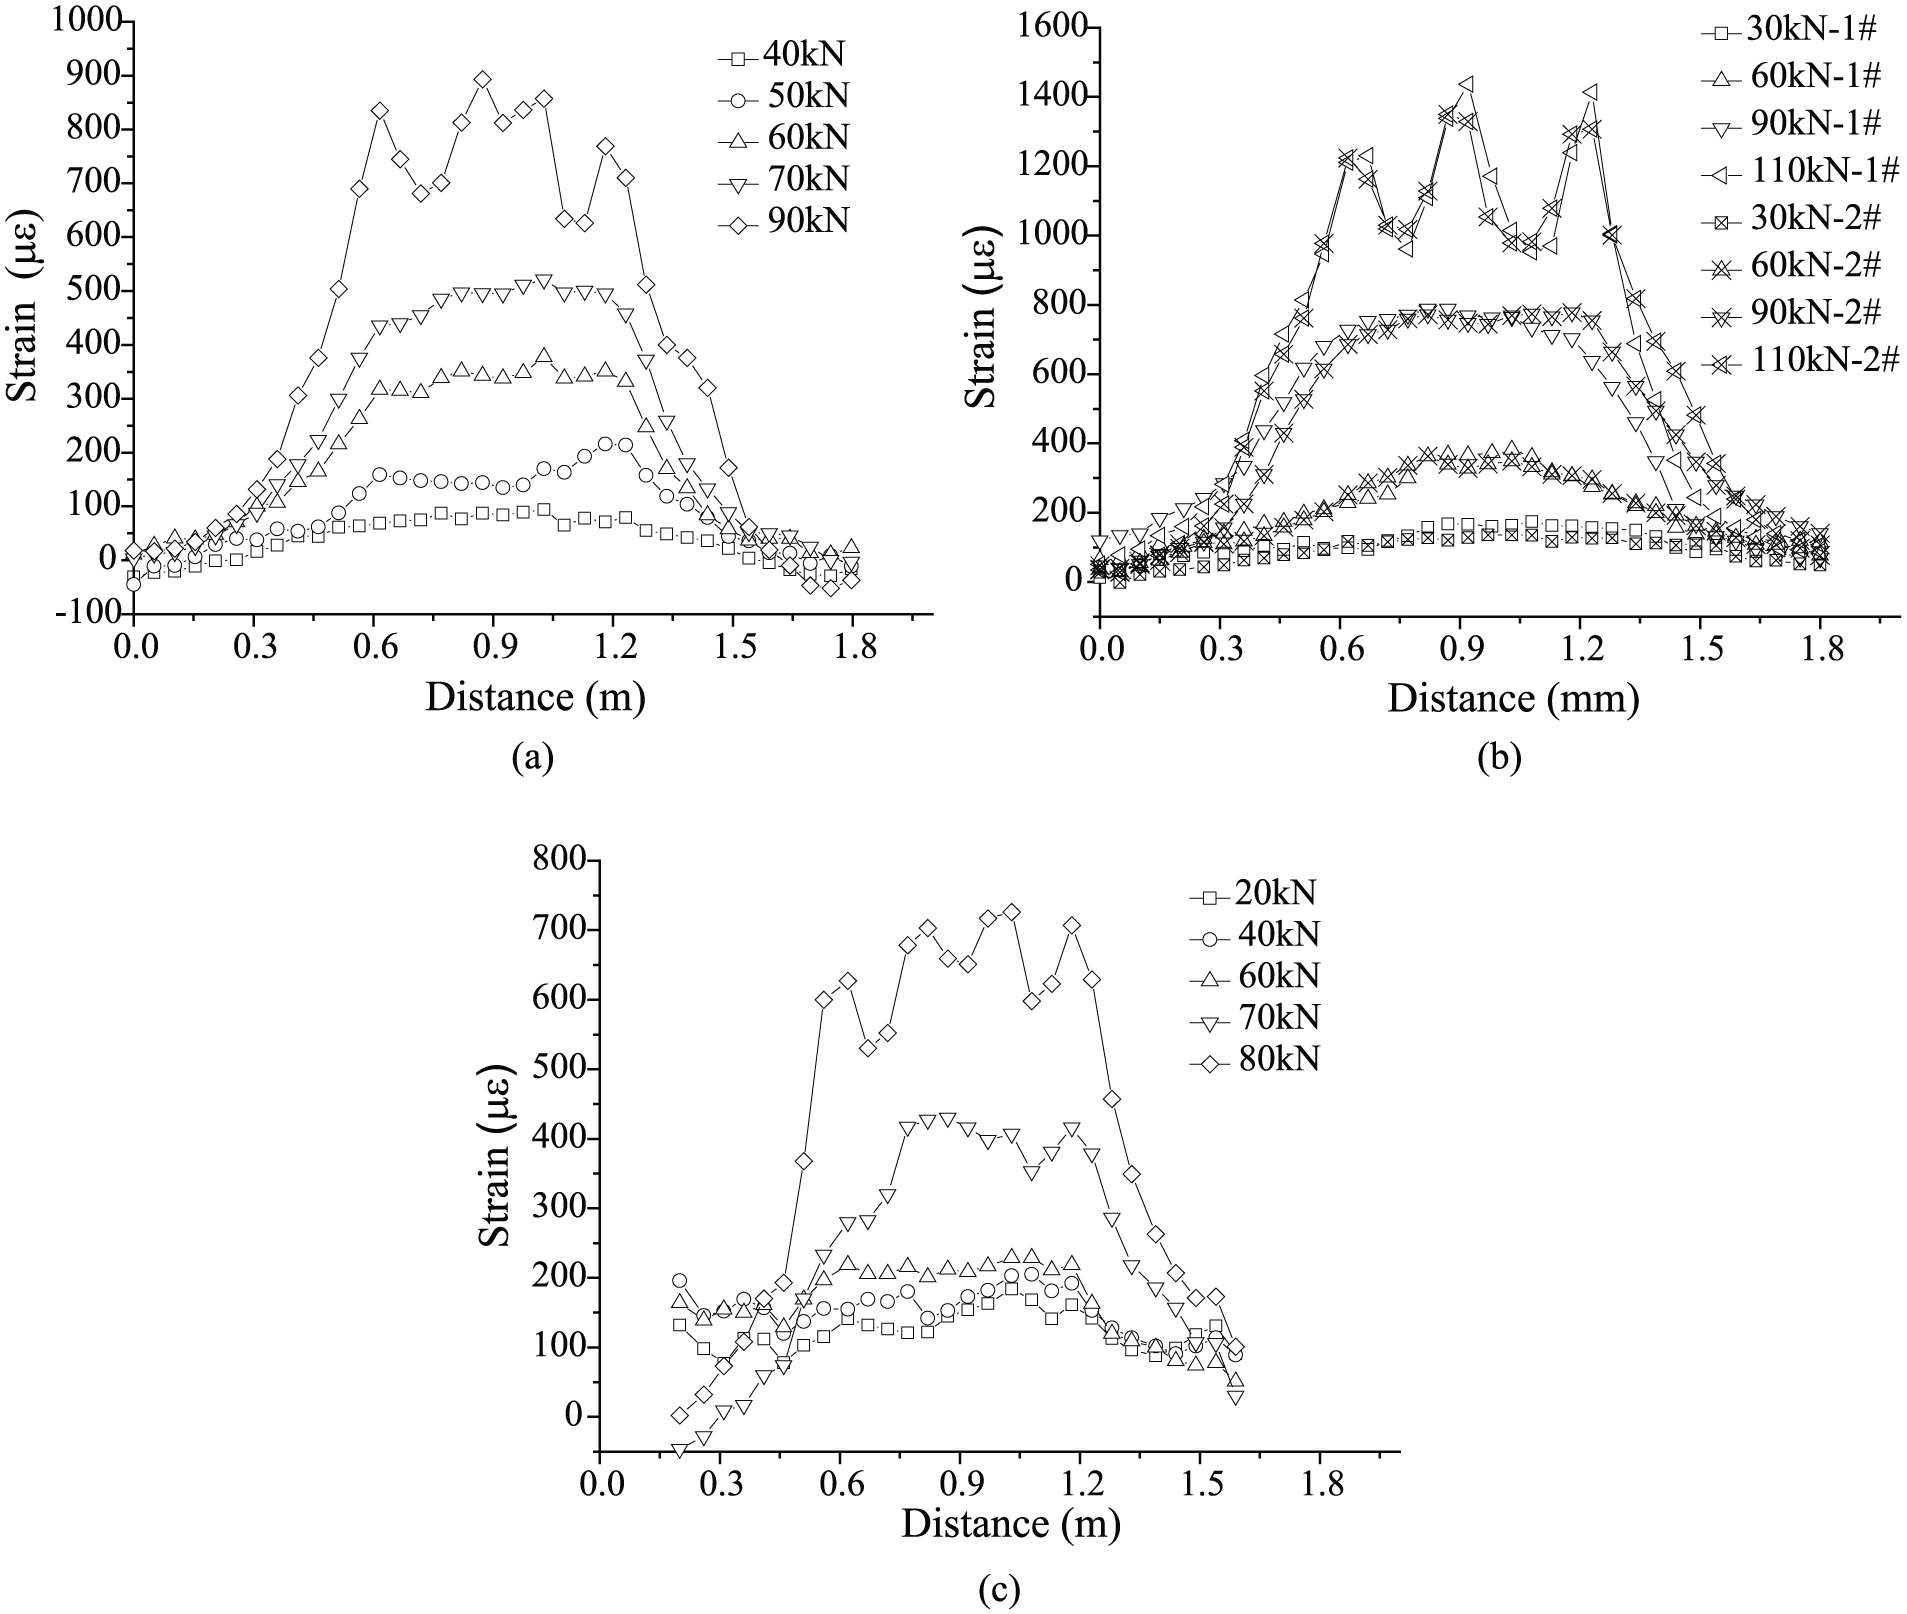
Strain distribution during the steel bar yielding: (a) Specimen 1#, (b) Specimen 2# and (c) Specimen 3#.
However, some important information can be still obtained from the strain distribution. The strains are uniform to some extent in the pure bending zone before cracking, which is in agreement with the theoretical trend. The beam stiffness decreases obviously after the concrete cracking, because the strain change presents much larger compared to the value before concrete cracking for the same applied load step as shown in Figure 12. The method can be used to detect the yielding of the reinforcing steel bars as shown in Figure 14. From Figure 13, the sharp peaks indicate cracks in the layer of the epoxy resin grout. And these cracks are at the same position where the main concrete cracks develop.
From Figures 10(b), 11(b) and 12(b), some other conclusions can also be drawn. The strain distributions measured by the two smart bars in Specimen 2# are very close to each other, while larger relative deviations are present in the phase of smaller applied loads before the concrete cracking or larger loads after the reinforcement yielding. In the former phase, the absolute value of strain changes is small, so it is easy to understand that the inner fixed measurement error of the PPP-BOTDA will make some larger relative measurement errors. In the latter phase, the strain distributes complicatedly within the spatial resolution of the PPP-BOTDA which will decrease the strain-sensing accuracy greatly.
Crack
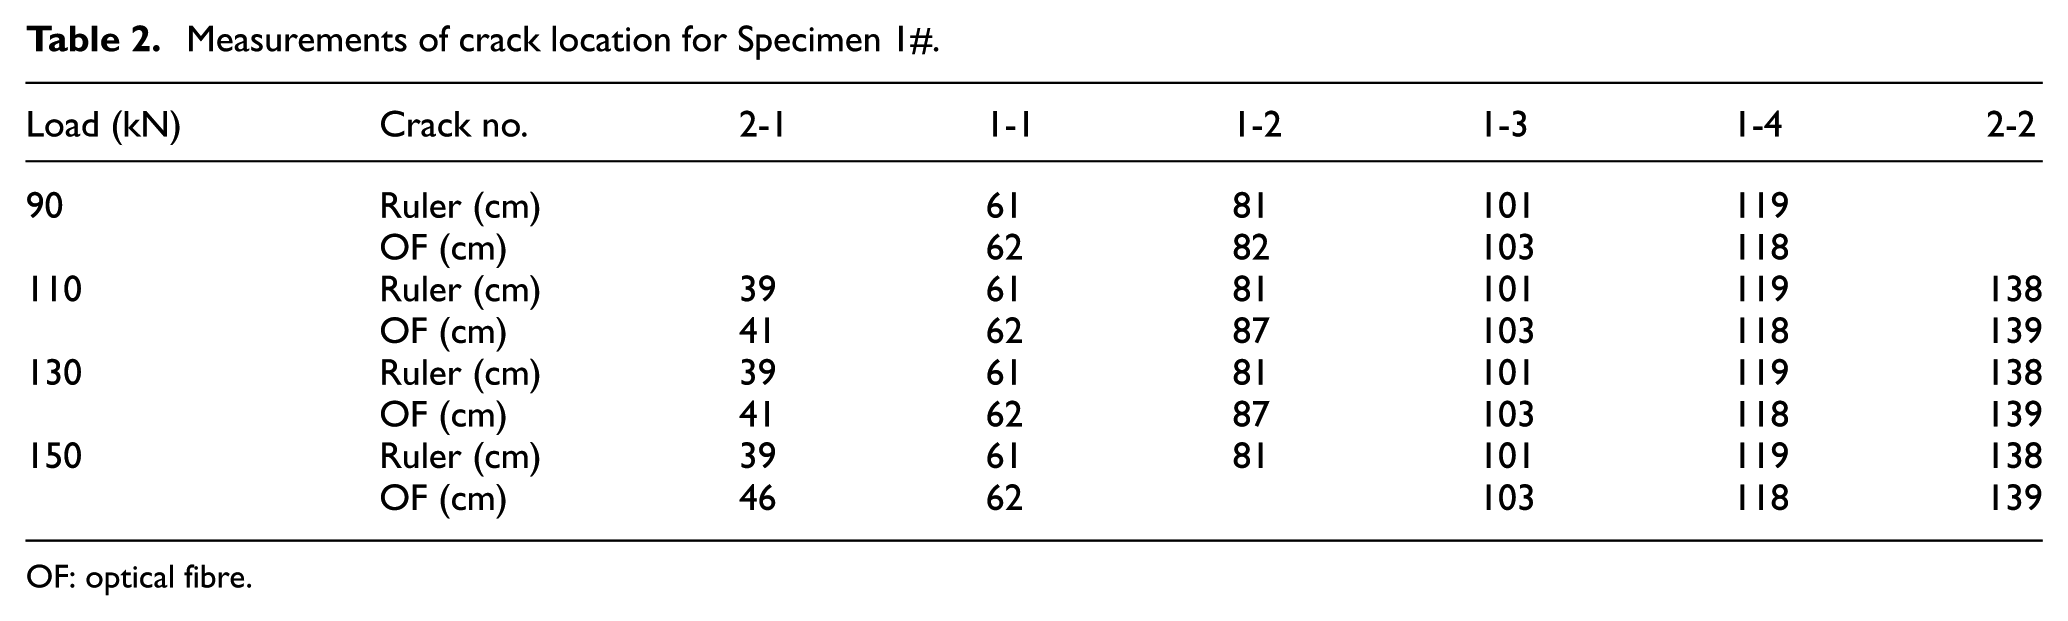
The sharp peak of the strain distribution will happen at the location where the crack initiates as shown in Figure 13. The spatial information for these peaks reveals the crack location and all the results are listed in Tables 2–4 for Specimens 1#, 2# and 3#, respectively. In the tables, the value measured by the ruler is considered as the true value. For crack number A-B, ‘A’ means the time-series of the cracks, while ‘B’ is the number for the cracks found at the same time. Some crack numbers are taken as examples to explained how the crack number is arranged. For Specimen 1# the cracks 1-1, 1-2, 1-3 and 1-4 initiated at the same applied load, namely 90 kN, while the cracks 2-1 and 2-2 initiated at another applied load, namely 110 kN. The number of cracks increased largely especially after the steel rebar yielding and the distance between the cracks is so small that the cracks could not be identified from the strain distribution measured by the OFs due to its spatial resolution. The cracks mentioned here are the cracks developed within the epoxy resin grout. And these cracks are at the same position where the main concrete cracks develop.
Measurements of crack location for Specimen 1#.
OF: optical fibre.
Measurements of crack location for Specimen 2#.

OF: optical fibre.
Measurements of crack location for Specimen 3#.

OF: optical fibre.
From the results in these tables, the OFs can detect the main crack locations as exactly as the ruler. All the measurement errors are smaller than 10 cm and the largest value is 7 cm for crack 2-1 of Specimen 1# at 150 kN. From the statistical results of errors for all the measurements in Figure 15, more than 75% of the errors are in the range from −3 to 3 cm. The measurement errors show no obvious relationship with the increase in the load. However, the measurement accuracy will be decreased when some new cracks develop among the monitored cracks. If the cracks distribute too close or the distance between cracks is less than 10 cm, the measurement accuracy will decrease greatly, as the best spatial resolution of the applied PPP-BOTDA is only 10 cm. Therefore, the smart BFRP bar failed to detect crack 1-2 at 150 kN as shown in Table 2.

Statistical results of the location monitoring errors.
Besides the crack location, the crack width can also be assessed with the smart BFRP bar as explained in the above paragraph. All the results of the main cracks for the three specimens are listed in Tables 5–7. The value measured by the crack detector (CD) is considered as the true value. The crack width evaluation from the OF is close to the results from the CD especially before the steel rebar yielding. However, the measurement error should not be neglected as the largest negative relative error (RE) is even as much as −54%, while the largest positive one is 108%. These larger measurement errors often happen at relatively larger loads when several additional cracks develop between the concerned main cracks. These additional cracks will make the local strain too complicated to be accurately measured due to the spatial resolution of PPP-BOTDA. Although the accuracy needs some improvement, it is still useful for the random structure damage evaluation. Of course, some work should be done to improve the measurement accuracy.
Measurements of crack width for Specimen 1#.

CD: crack detector; OF: optical fibre; RE: relative error.
Measurements of crack width for Specimen 2#.

CD: crack detector; OF: optical fibre; RE: relative error.
Measurements of crack width for Specimen 3#.

CD: crack detector; OF: optical fibre; RE: relative error.
Displacement
The strain results were taken into equation (8) to obtain the displacement results of the beam. The displacement results at the middle span of the beam are shown in Figure 16 to verify the proposed method. In the figure, the results from the OF are close to the results from DT especially for Specimen 3#. With a prestress applied on Specimen 3#, the cracks distribute more uniformly and the width is relatively smaller compared with the other two specimens. It may be the partial reason why the measurement accuracy is better for the experimental beam 3#. The largest relative measurement errors are −44%, −53% and −25% for the three specimens, respectively. The poor measurement accuracy for nonuniform strain within the spatial resolution is one of the main causes to explain the errors. However, the results from the two smart bars of Specimen 2# show a good coherence with each other. From the load–displacement curve, the changes in the slope indicate the damage information of the structure, namely, concrete crack, epoxy grout crack and steel bars’ yielding, respectively.

Displacement measurement results for (a) Specimen 1#, (b) Specimen 2# and (c) Specimen 3#.
Inner force
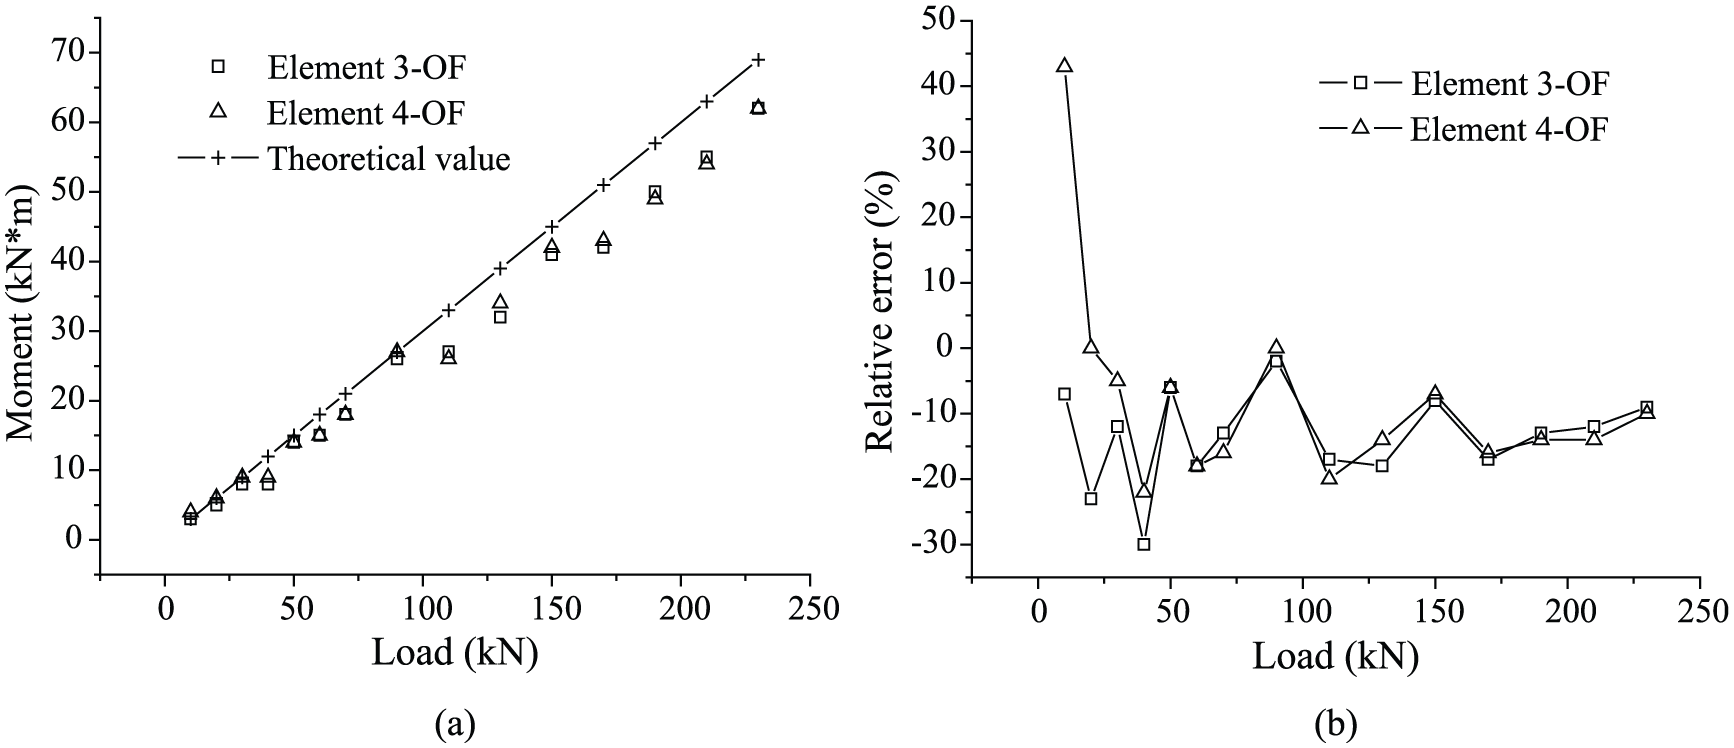
Bending moment is the key parameter of the inner force for the beam structure. As the largest bending moment happens in the middle span, the results of Elements 3–4 are taken to explain the method as shown in Figures 17–19, respectively. In the figures, the results from the OFs are close to the theoretical value with some errors. However, most of the REs are within the range from −25% to 0% especially after concrete cracking, meaning that a relatively exact and stable evaluation of the bending moment is possible with this new type of smart BFRP bars. The worst accuracy happens at smaller loads and the maximal absolute value of the REs even surpasses 100%. The poor accuracy of the PPP-BOTDA for small strain measurement is the main reason. However, most concrete beams work normally with cracks. Therefore, the strain of the reinforcing bar at the weakest section will be large enough to be measured and the evaluation accuracy will be promised to some extent.

Bending moment measurements for Specimen 1#: (a) absolute value and (b) relative errors.
Bending moment measurements for Specimen 2#: (a) absolute value and (b) relative errors.
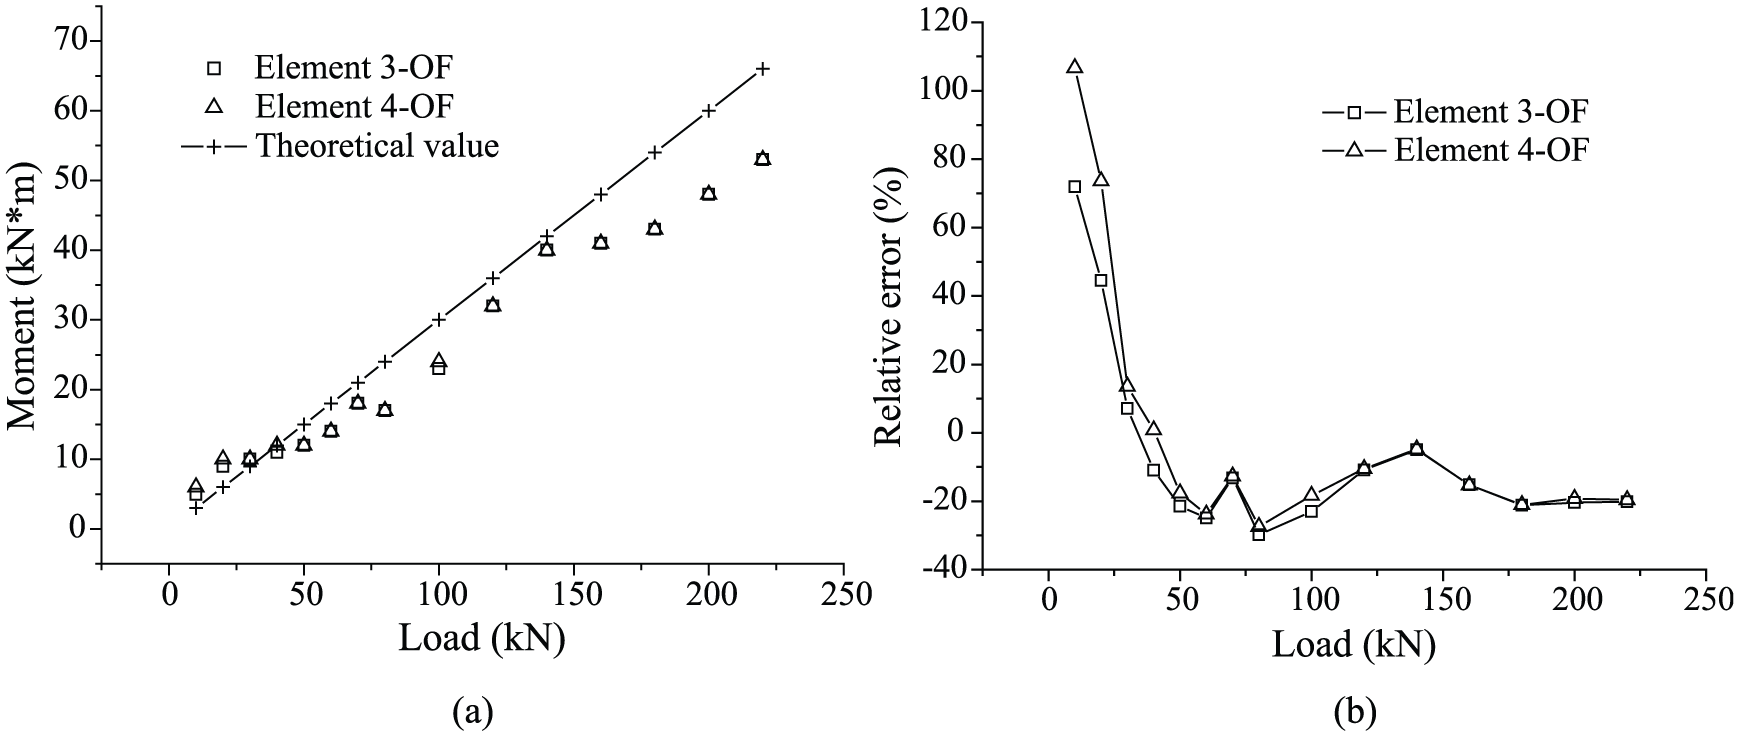
Bending moment measurements for Specimen 3#: (a) absolute value and (b) relative errors.
Results and analysis of structural strengthening
As a new type of FRP material, the smart BFRP bar is characterized by high ultimate strength and large ultimate strain. However, the elastic modulus is relatively low, about 25% of that of the steel rebar. Therefore, the smart bar will contribute little to the structural strengthening especially before the yielding of the steel rebar if there is no prestress applied. The conclusion is confirmed by the results of Specimens 1# and 2# as shown in Figure 20 and Table 8, as there are no obvious changes in the beam stiffness before the yielding of the reinforcing steel bars, and the yielding loads are nearly the same. In Table 8, Phases I, II, III and IV mean concrete cracking, epoxy resin cracking, the yielding of steel rebar and the ultimate of the specimen, respectively. To improve the strengthening effect, a prestress, about 20% of the ultimate strength of the smart BFRP bar, was applied on Specimen 3#. Compared with the other two specimens, the strength of concrete cracking and steel bars’ yielding for Specimen 3# are increased about by 17% and 20%, respectively. At the same time, the beam stiffness is improved to some extent especially before the yielding of the reinforcing steel bars.

Load–displacement curve.
Results of structural strengthening (kN).
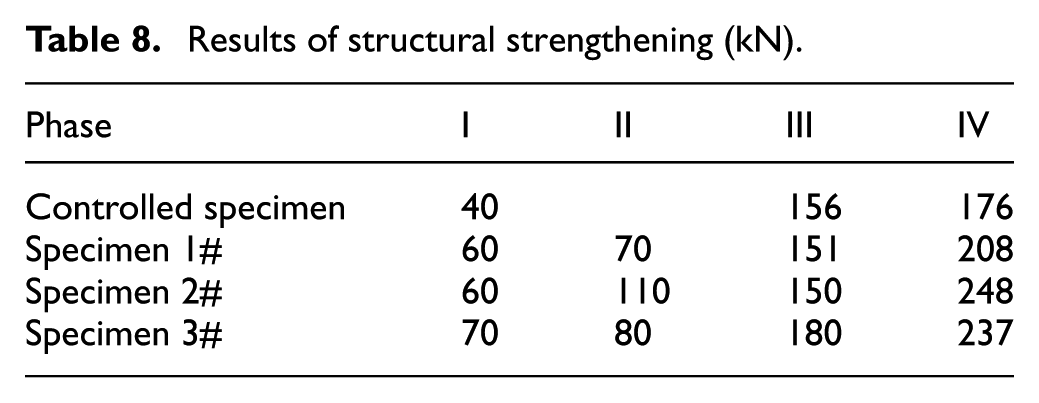
Compared with the control specimen, the strength of concrete cracking is increased by 50% for Specimens 1# and 2# as well. It is mainly caused by the coating of the epoxy resin grout, as the epoxy resin grout has an elastic modulus of about 30 GPa and an ultimate tension strain of nearly 600 µε. However, it shows little effect on the ultimate strength, because the epoxy resin grout has already fractured before the ultimate state. Compared with the control specimen, the ultimate strengths are improved by 17.6%, 40.4% and 34.2% for the three specimens, respectively. The improvement is mainly caused by the embedment of smart BFRP bars. Moreover, the retrofitted beams could still keep some notable stiffness after the yielding of steel rebars. It means much importance for stopping or postponing the structures collapse, sending out warning and making it possible to repair the structures after a severe damage.
Another good result is obtained from the experiments that there is no slip failure for all the specimens. However, it often happens when the CFRP is applied to strengthen the RC structures. At the ultimate state, the concrete in the compressive zone was crushed while the smart BFRP bars still worked well, as shown in Figure 21. The ductility of the strengthened beam shows no obvious change. In other words, the failure model keeps the same as the controlled specimen. The number or the initial prestress of the smart BFRP bars can be changed to get different structural strengthening effects. However, it should not be increased too much to change the failure model. A large ductility is important for civil engineering structures.

Ultimate state for (a) Specimen 1#, (b) Specimen 2# and (c) Specimen 3#.
Conclusion and remarks
In the author’s another article, 21 a new type of smart BFRP bar has been proposed and its sensing and mechanical properties have also been investigated, while in this article it is focused on how to use the smart BFRP bar to strengthen and monitor the existing RC structures, namely, constructing the methods of increasing the structural ultimate strength, monitoring the structural strain distribution, detecting the concrete cracks and assessing the structural displacement and inner force. With the research in this article, some conclusions and remarks can be obtained as the follows:
With the smart BFRP bar, one innovative retrofitting system can be constructed for the RC structures. In the system, the ultimate strength and the stiffness after steel rebar yielding can be increased due to the high strength and ultimate strain of the smart BFRP bar. Meanwhile, the structure strain distribution can be measured with the smart BFRP bar, with which some key parameters can be assessed, such as crack location, crack width, displacement and inner force.
From the experiment results, the proposed retrofitting system can be implemented by embedding the smart BFRP bar into the concrete cover with or without prestress. Both self-sensing and strengthening effects are verified in the experiments. From the obtained strain distribution, the main cracks are located with an error within 10 cm. The crack width is well assessed especially before the steel rebar yielding. The displacement is also evaluated with the strain measurement, in which the accuracy is higher for Specimen 3# as the cracks distribute more uniformly and the crack width is relatively smaller due to application of some prestress. With the proposed method, the bending moment is calculated with the measured average element strain and most of the errors are within 25%. However, the self-sensing effects indeed have been obviously influenced by the strain measurement accuracy especially after concrete cracking.
The proposed retrofitting system shows good structural strengthening effects especially after the yielding of the reinforcing steel bars with a notable secondary stiffness and an expected increase in the ultimate strength. Moreover, the additional application of prestress on the smart BFRP bars can further improve the strengthening effects, namely, increasing the beam stiffness, the load for concrete cracking and the ultimate strength.
With the verified performance of both structural strengthening and self-sensing, the new proposed retrofitting system based on the smart BFRP bar presents a broad perspective of practical applications in the concrete structures. However, some further research should be implemented to make the study more useful and applicable. First, the strain measurement accuracy of the smart BFRP bar should be improved especially for complicated strain measurement. There are two potential ways to solve the problem. One is to improve the spatial resolution of the PPP-BOTDA, and another is to improve the sensor structure, such as long-gauge sensor. Second, the long-term sensing performance should also be considered as the structural damage may happen after several years of servicing. Third, the verification test should be implemented in actual engineering structure under field loading.
Furthermore, the issue of uncertainty in the properties of the FRP, such as fracture, debonding and fatigue, should be considered as well in the actual application of the proposed system as it will affect the retrofitting quantity especially when some prestress is applied on the FRP. The residual strain of the FRP during the manufacturing process will influence the quantity of SHM, as it will decrease the measurement range and may shorten the life of the OF sensor. The proposed system can become more useful under consideration of the mentioned uncertainty.
Footnotes
Academic Editor: Philip Park
Declaration of conflicting interests
The author(s) declared no potential conflicts of interest with respect to the research, authorship, and/or publication of this article.
Funding
The author(s) disclosed receipt of the following financial support for the research, authorship, and/or publication of this article: This work was financially supported by National Natural Science Foundation of China (grant no. 51508364), Natural Science Foundation of Jiangsu Province (grant no. BK20150333) and University Natural Science Foundation of Jiangsu Province (grant no. 14KJB580009).