
Abstract
This article predicts the relationship between chip shrinkage coefficient and cutting parameters such as cutting speed and uncut chip thickness in a cutting process of A6061 aluminum alloy. To this end, shrinkage coefficient–based finite element method was first estimated using the Johnson–Cook (J-C) and Bao–Wierzbicki (B-W) material fracture models. After that, experimental measurements of the chip shrinkage coefficients were performed at the same cutting conditions to compare with simulation data and confirm the accuracy of material damage models. By a simultaneous evaluation of the effects of cutting parameters on the chip shrinkage coefficient, the B-W model was found to match well with the experiment. So that, the B-W model was then utilized to verify the effect of various cutting speeds and uncut chip thicknesses on the chip shrinkage coefficient and cutting force. Finally, using the least square method, the relationship between chip shrinkage coefficient and cutting force was obtained. The above-mentioned relationship is believed to be useful in determination of optimal cutting conditions in high-speed machining.
Keywords
Introduction
High-speed machining (HSM) is an innovative technique, which plays an important role in modern manufacturing. During HSM process, chip formation mechanism can considerably influence most of the cutting parameters, such as cutting force, temperature, tool wear and life, and surface quality. Thus, an in-depth investigation of the chip formation and its effects on the characteristics of high-speed cutting process is very important. This is because understanding of the above-mentioned issues would aid for improving the design of cutting tool and selecting optimum conditions, especially in advanced applications such as high-speed milling.1,2 This study deals with the relationship between chip shrinkage coefficient and cutting force in a high-speed cutting process.
Due to the complexity of the chip formation process, in particular, at high cutting speeds, finite element method (FEM) has been frequently used as an alternative solution. A large number of studies on chip formation process are based on the Johnson–Cook (J-C) fracture model. 3 The J-C model incorporates the involvement of von Mises yield criterion, equivalent plastic strain, strain rate, and temperature. Based on the J-C model, the fracture occurs only when the material is plastically flowing. 4 Several authors have employed different fracture models for simulation of material cutting process such as constant fracture strain model, 5 Wilkins model, 6 modified Cockcroft–Latham model,7,8 or power law. 9 In general, all the models can give consistent predictions in cutting forces, chip thickness, and shear angle with adequate accuracy. However, the application of the J-C model is of great interest. One of the most advantages of using the J-C model is that a database of material fracture for a number of structural materials has been provided and user can directly implement them in the commercial finite element software. 2
The empirical Bao–Wierzbicki (B-W) model, however, indicates that the fracture of a ductile material is strongly dependent on the stress triaxiality. The B-W fracture model is distinguishable from the other models by the fact that a ductile material would never fail if the stress triaxiality is less than −1/3. 10 So far, the B-W fracture model has been often adopted for general purpose of material testing.11,12 Application of this model for simulation of metal cutting process is limited in literature. Recently, Liu et al. 13 evaluated different fracture models using finite element simulation. From the simulation results of 2024-T3 aluminum alloy, they concluded that the best prediction of chip removal behavior of ductile metals is obtained using the B-W fracture model with consideration of rate dependency, temperature effect, and damage evolution.
Regarding studies about chip shrinkage coefficient, only few researches have been published. Anayet et al. 14 experimentally studied the instabilities of the chip formation process during end milling of Ti6Al4V alloy. They reported that the chip shrinkage coefficient varied within 5% under the cutting speed increasing from 20 to 100 m/min. Afonasov and Lasukov 15 investigated the elementary chip formation in the machining of hard materials. From the experimental measurement, they obtained the relationship between cutting conditions and deformation characteristics of the chip element, such as longitudinal shrinkage, shear angle, and chip continuity.
In general, the previous researches mainly focused on determination of cutting force and chip formation mechanism in relation to cutting conditions such as cutting speed, depth of cut, and feed rate. Chip shrinkage coefficient can be a prominent parameter for monitoring and controlling the metal cutting process, since changes in that coefficient reflects changes in the cutting parameters or quality of surface finishes. However, the study on the relationship between chip shrinkage coefficient and cutting parameters has been limited in the literature.
This study aims to obtain the relationship between chip shrinkage coefficient and the cutting parameters in HSM of A6061 aluminum alloy. Simulations are performed using FEM based on the J-C and B-W models to estimate the chip shrinkage coefficient. Experimental measurement of the chip shrinkage coefficient is also performed in the case of high-speed milling of A6061 aluminum alloy. From the simulation and experimental results, the appropriate fracture model is selected for further determination of the chip shrinkage coefficient and cutting force, which are then expressed as explicit functions of cutting speed and uncut chip thickness.
Materials and experimental procedures
Properties of machining material
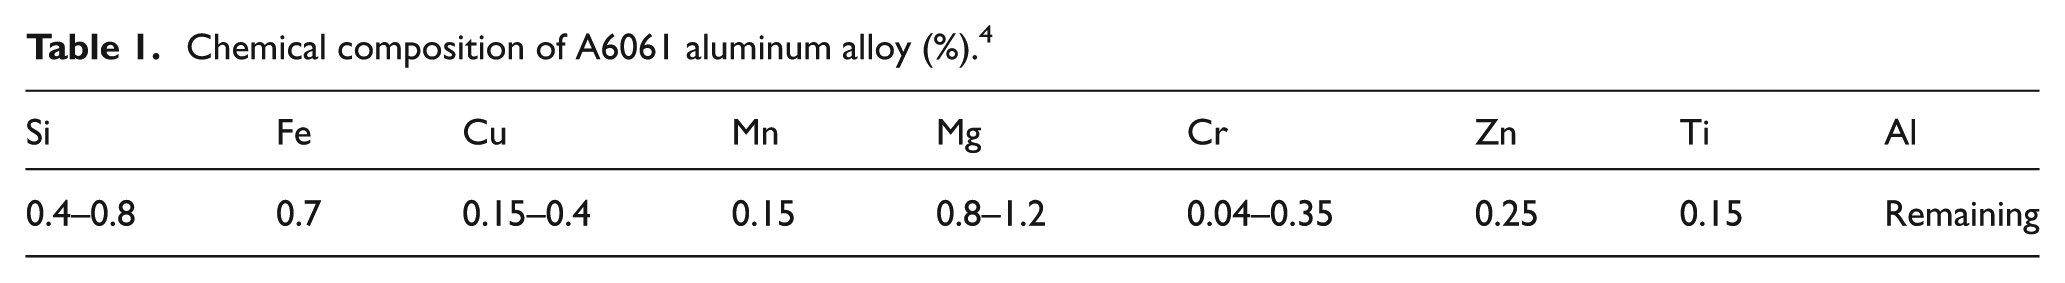
The workpiece material of A6061 aluminum alloy is used in this study. The chemical composition and physical properties of this material are shown in Tables 1 and 2, respectively. The curve-fitting equation of tensile flow stress

Chemical composition of A6061 aluminum alloy (%). 4
Physical properties of workpiece material.

Figure 1 shows the tensile stress–strain curve determined by equation (1) for A6061 aluminum alloy.

Tensile stress–strain curve of A6061 aluminum alloy. 6
Material fracture model
This section introduces the J-C and B-W fracture models. The two models describe the fracture criterion applying for metal. To apply these models, a number of constants should be determined normally by experiment, which reflects the involvement of material properties. In addition, these models can be applicable for a wide range of common materials such as steel, pure copper, or aluminum alloy.16–18
The J-C fracture model
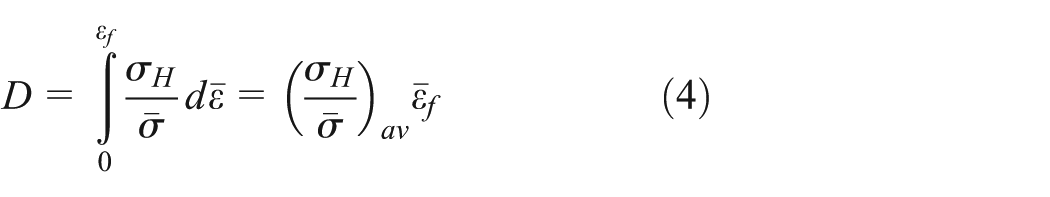
The J-C fracture model is based on a hypothesis that fracture occurs when the accumulated plastic strain reaches a critical value. The model and formulation of damage parameter (D) has been well described in the literature3,19 and briefly summarized below. Failure is assumed to occur when D is equal to 1.0. D can be determined with an assumption of linear damage accumulation 3 as

where

where
The J-C fracture model parameters for A6061 aluminum alloy.


Equivalent strain of A6061 aluminum alloy using the J-C model.
The B-W fracture model
The B-W fracture model indicates that fracture occurs at a point in a body when the accumulated plastic strain reaches a critical value. The accumulated equivalent plastic strain or damage parameter based on the B-W model is calculated by 10
where
The equivalent strain to fracture can be expressed by the curve fit formulas given as follows 10

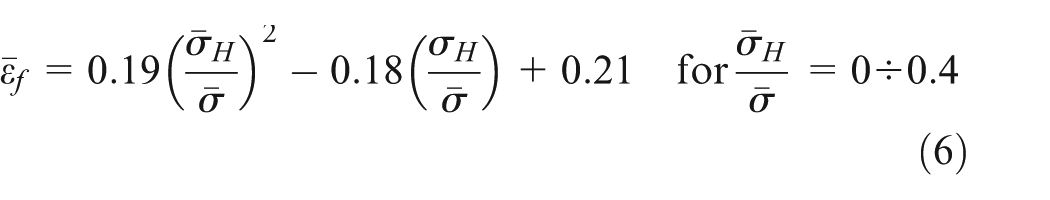
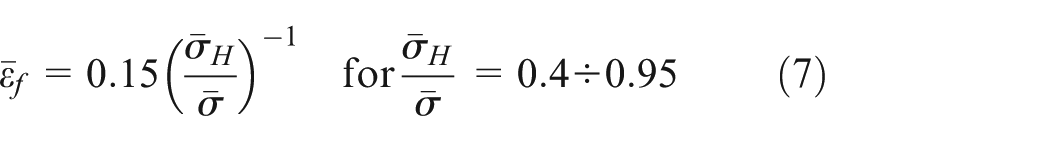
Figure 3 shows the variation of the equivalent strain to fracture as a function of stress triaxiality calculated using equations (6)–(8) and applying for A6061 aluminum alloy.
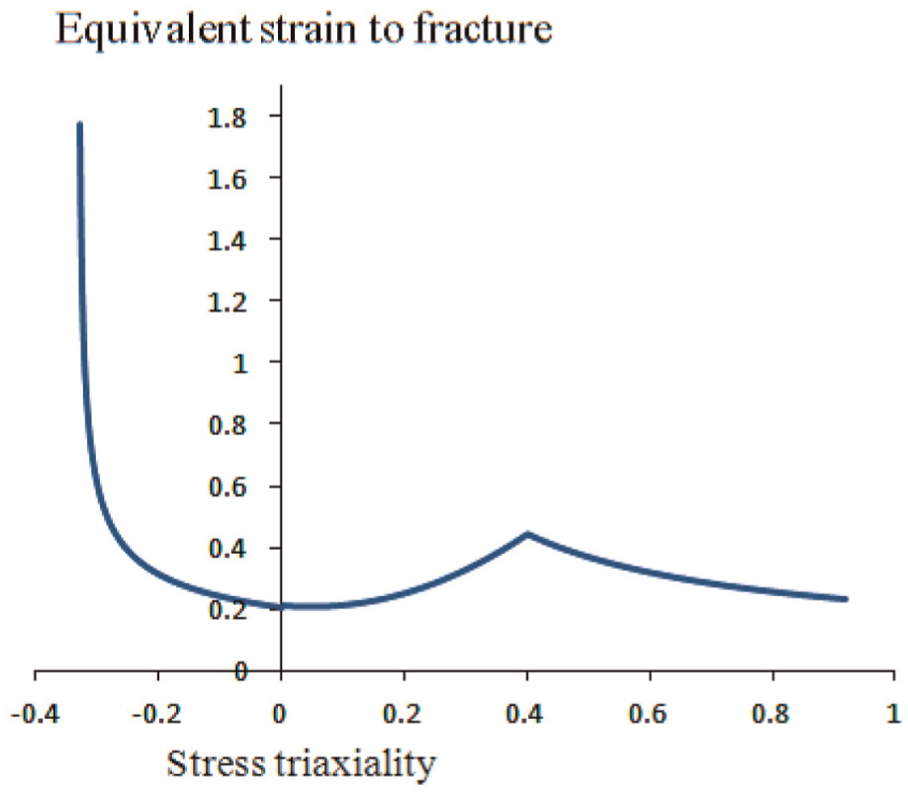
Fracture curve of A6061 aluminum alloy based on the B-W model.
Experimental and simulation design
Simulation model
The commercial software Abaqus/Explicit 6.13.1 is employed for simulation of cutting process for A6061 aluminum alloy. Figure 4 shows a two-dimensional (2D) finite element model for the cutting problem. The workpiece is modeled by four-node bilinear elements with reduced integration (CPE4R), while rigid element is used to model the cutting tool.

Finite element model of cutting problem.
The model comprises four geometrical parts as shown in Figure 4. Part 1 represents the cutting tool. The uncut chip portion is represented by part 2, which is coupled to the workpiece support (part 4) by the passage zone of tool-tip (part 3). Part 3 plays a role of sacrificial layer, which directly interacts with cutting tool. This layer is modeled by a mesh of three elements with total thickness larger than the cutting edge radius. A major part of the chip is formulated from the elements in the uncut chip portion. Another part arises from the elements in the sacrificial layer if they are not completely damaged. The remaining elements in the damaged zone, which are completely damaged, will be removed. The criterion for complete damage is the damage parameter D = 1.0 for the J-C model. For the B-W model, complete damage occurs when the accumulated equivalent plastic strain reaches a limiting value equal to 1. The simulation model will give numerical results for von Mises stress, plastic strain, stress triaxiality, and the cutting forces for 5 ms of machining time.
Experimental set-up
Figure 5 shows the experimental set-up of milling process. Experiment is conducted on a three-axis VMC0641 vertical machine center (spindle motor power of 7.5/11 kW; maximum spindle speed of 8000 r/min; travel distances of the operating platform in X, Y, and Z axes of 610, 410, and 410 mm, respectively; and maximum feed rate of 36 m/min). Dry milling condition is performed for A6061 aluminum alloy using carbide inserts milling tool of 60 mm diameter (TNMG331-TSNS 530). The geometric parameters of cutting tool are assumed unchanged during simulation and described in Table 4. The chips generated during milling process will be collected for the length and mass measurement. The chips’ masses are measured using Sartorius balance (model ENTRIS224-1S, maximum weighing capacity of 220 g and increments in 0.0001 g). The chips’ lengths are measured using flexible measuring tape (fabric tape length of 150 cm and width of 8 mm).
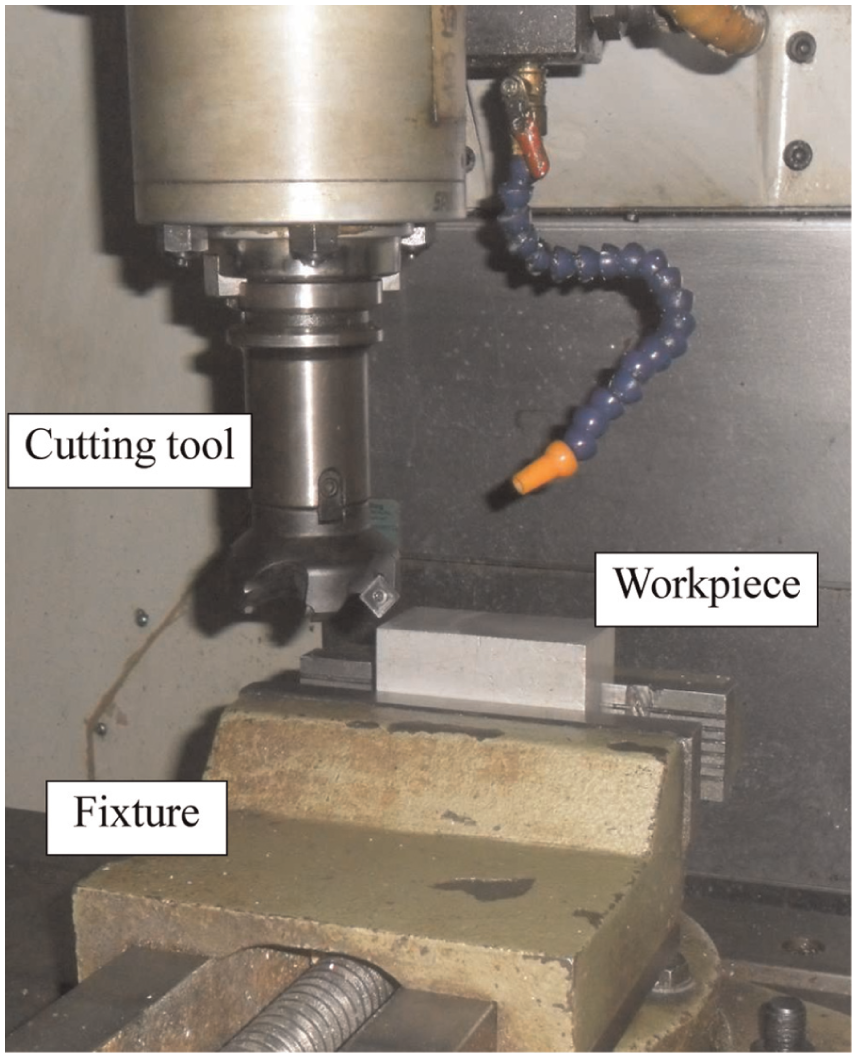
Experimental set-up.
Parameters of tool geometry.

Determination of chip shrinkage coefficient (K)
The chip shrinkage coefficient is defined by ratio between the uncut chip length (l0) and the actual chip length (lp). Then, formula for K can be written as 14
In practice, because the uncut chip lengths are unknown, another method to estimate K based on experimental is 21

where Q is mass of the chip (g), ρ represents the chip material density (g/cm3), S is feed rate (mm/min) of cutting process, and t represents the cutting depth (mm).
In this study, K is first evaluated using equation (8), where the uncut and actual chip lengths are derived from the simulation data of milling process for A6061 aluminum alloy. In addition, experimental measurement of chip mass and length, as well as the cutting parameters are used for determination of K based on equation (9). The simulation and experimental results for K will be presented in the next section.
Results and discussion
Chip formation in milling of A6061 aluminum alloy
Simulation
Figure 6(a) and (b) shows the simulation of chip formation using the J-C and B-W models. It can be seen that using B-W model, the maximum von Mises stress in mesh elements is higher and the equivalent plastic strain is lower than that of J-C model. Therefore, it can be expected that the fracture of material may occur earlier when using B-W model. To see more details, Figure 7(a) indicates the position of mesh element (M) to be damaged during cutting. Figure 7(b) shows the evolution of equivalent strain as a function of the stress triaxiality at the examined mesh element (M) (herein, fracture strain path). The fracture curves of A6061 aluminum alloy using the B-W and J-C models are also demonstrated in Figure 7(b) for comparison. From Figure 7(b), the fracture strain path intersects with the B-W model fracture curve first. In other words, based on the B-W model, fracture occurs earlier than that of the J-C model.

Simulation of chip formation using (a) J-C and (b) B-W models.

(a) Simulated fracture strain path and (b) fracture curves using the B-W and J-C models.
Experiment
Figure 8 shows chips produced in milling of A6061 aluminum alloy at different uncut chip thicknesses. Continuous chips are generally formed due to ductility characteristics of the workpiece material. However, the longitudinal dimensions (length) of chips are relatively small due to the interrupted milling, which occurs when the tool is not in constant contact with the workpiece. Figure 8 indicates that increasing uncut chip thickness reduces the length but increases the width of produced chips.

The chips produced in milling of A6061 aluminum alloy at different uncut chip thicknesses (V = 565.5 m/min, S = 250 mm/min): (a) t = 1.0 mm, (b) t = 1.5 mm, (c) t = 2.0 mm, and (d) t = 2.0 mm.
Figure 9 demonstrates the produced chip under different cutting speeds of milling process. From Figure 9, the effect of cutting speed on the chips is not clearly visible in terms of overall chip dimensions such as length or width.
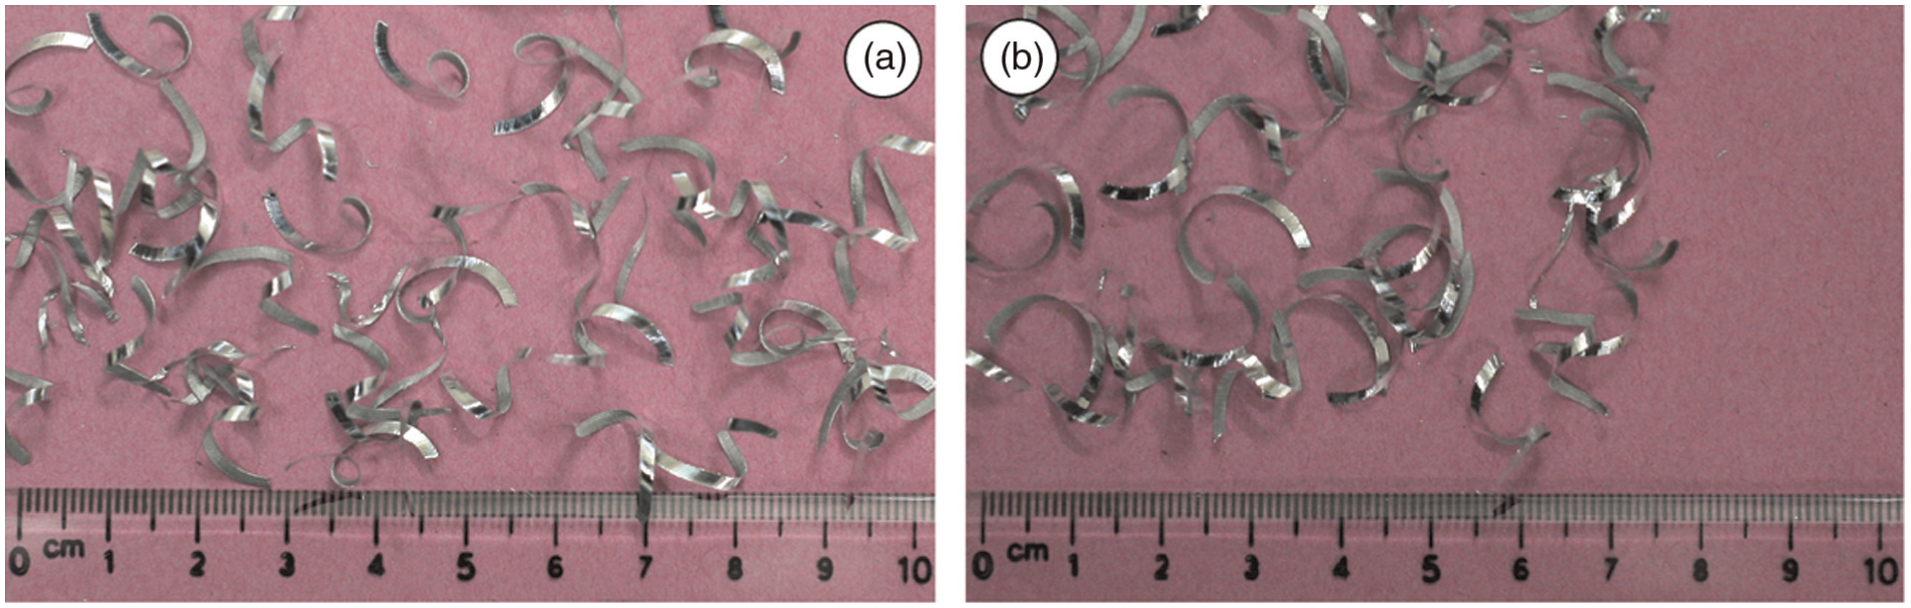
The chips produced in milling of A6061 aluminum alloy at different cutting speeds (t = 1.0 mm, S = 250 mm/min):(a) V = 471 m/min and (b) V = 659.4 m/min.
Comparison of experimental and simulation results for K
In order to investigate the influence of cutting parameters on K, experiment and simulation on milling process of sample A6061 aluminum alloy are conducted. The uncut chip thickness is set to t = 1 mm. The cutting speed is selected varying from 376 to 659 m/min.
Figure 10 compares the simulation results of K using the J-C and B-W models and experimental measurement. From Figure 10, both the J-C and B-W models seem to underestimate K for the entire range of speed compared to experimental results. In case of V = 376 m/min, the B-W model gives a better prediction of K compared with experimental measurement than that of the J-C model. However, values of K predicted by the two models are nearly identical with increasing cutting speed. Figure 10 also demonstrates the error percentage between simulation and experimental results as

Comparison of K determined by simulation using J-C and B-W models and experiment.
The dependence of K on V and t
The effects of V and t on K are investigated using finite element simulation. Table 5 shows the simulation results of K with different values of V and t.
Simulation results of K with different values of V and t.
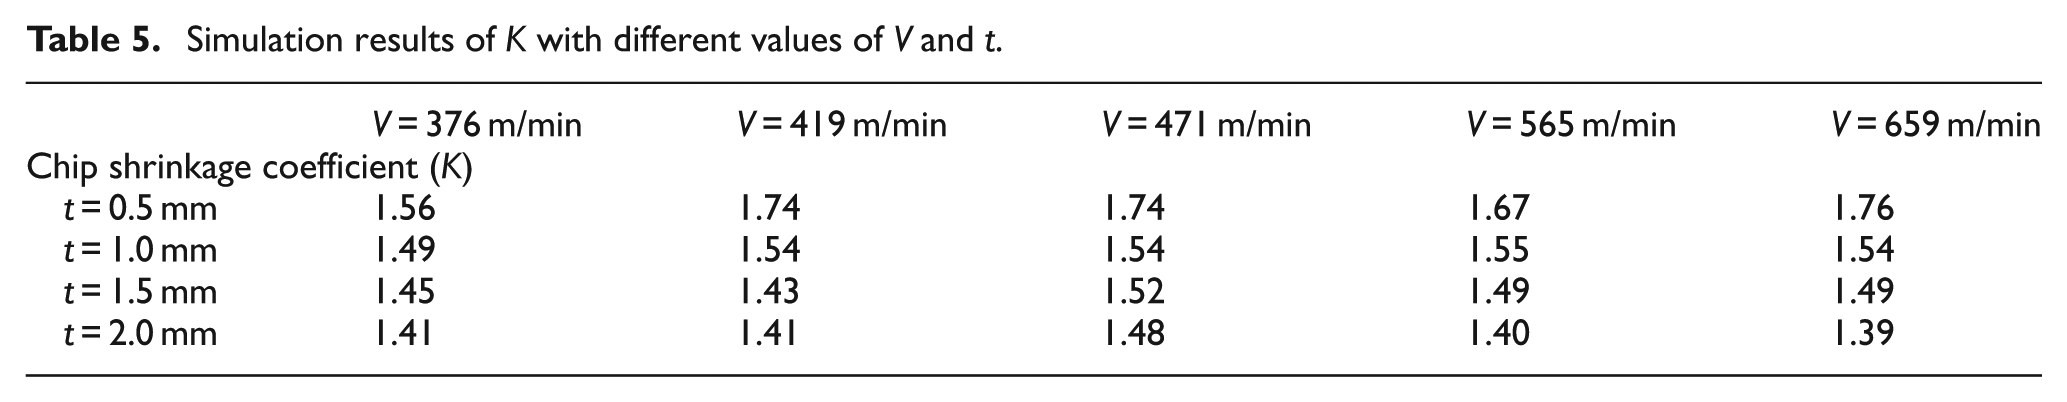
From simulation results in Table 5, a formula for K as a function of V and t will be constructed using curve-fitting method. The dependence of K on V and t is described by the following equation

where a1, a2, and a3 are the constants to be determined. By curve-fitting tool in MATLAB, the constants a1, a2, and a3 are found as 1.642, −0.008, and −0.139, respectively.
Figure 11 shows the variation of K in relation to V and t using equation (10). From Figure 11, K shows a minor change with increasing V from 419 to 659 m/min, which is in turn consistent with the results presented in Figure 9. However, t demonstrates a significant effect on K. With increasing t from 0.5 to 2.0 mm, K is reduced from 1.9 to 1.4. Therefore, a thinner chip will have a greater shrinkage coefficient than that of a thicker one.
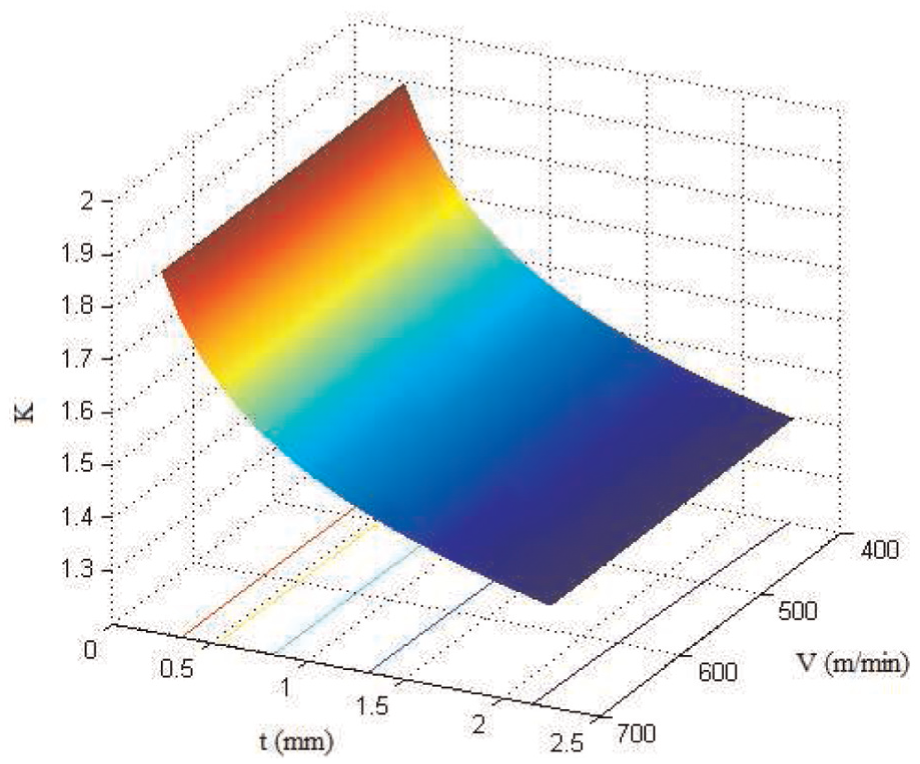
The calculated K using curve-fitted formula.
Prediction of cutting forces (F)
The dependence of F on V and t
Four different values of V and t are chosen as the cutting conditions to estimate the cutting force, for example, 419, 471, 565, and 659 m/min and 0.5, 1, 1.5, and 2 mm, respectively. Table 6 indicates the average F as a function of V and t. From simulation results, a formula for F as a function of V and t will be constructed similarly to the above-mentioned formula of K. F is assumed to satisfy the following relationship with V and t

where b1, b2, and b3 are the unknown constants to be determined. Similar to the constants in equation (10), curve-fitting tool in MATLAB is used to find the constant in equation (11). Then, those constants b1, b2, and b3 are determined to be equal to 35.235, 0.037, and 1.026, respectively.
Average value of F in relation to V and t.

Using equation (11), cutting force F is plotted against V and t as illustrated in Figure 12. From Figure 12, t has a predominant effect on F, whereas the effect of V is minor. This is because when t increases, amount of material being removed per unit time also increases. Therefore, F has to increase proportionally to adapt for the increase in energy requirement.

The calculated F using curve-fitted formula.
The relationship between F and K
In order to investigate the relationship between K and F, equations (11) and (12) will be used. By eliminating V and t, the relationship between K and F is found as shown in Figure 13. It is seen that K reduces with increasing F. Therefore, with the same cutting speed and uncut chip thickness, the material with higher strain rate can reduce the cutting force and then the required cutting power.

The relationship between K and F.
Conclusion
The simulation of cutting process using finite element simulation based on the B-W and J-C fracture models has been analyzed. Experimental study of cutting process in milling of A6061 aluminum alloy has been performed for verification of the simulation model and prediction of the chip shrinkage coefficient in relation to cutting conditions. The main outcomes of this study are as follows:
The chip shrinkage coefficients predicted by B-W and J-C models for A6061 aluminum alloy are almost identical in the case of high-speed cutting. Under low-speed cutting, the B-W model gives a better prediction.
The smaller uncut chip thickness results in the higher chip shrinkage coefficient and vice versa.
The uncut chip thickness has a great influence on the chip shrinkage coefficient and cutting force, whereas the effects of cutting speed are negligible.
Explicit formulas for the relationship between chip shrinkage coefficient with cutting speed, cutting force, and uncut chip thickness are derived.
Footnotes
Academic Editor: Shan-Tung Tu
Declaration of conflicting interests
The author(s) declared no potential conflicts of interest with respect to the research, authorship, and/or publication of this article.
Funding
The author(s) received no financial support for the research, authorship, and/or publication of this article.