
Abstract
An inter-vehicle relationship test bench which can simulate the relative motion of the adjacent vehicle ends is introduced. The test bench is driven by 14 actuators. A three-dimensional model including track, train, and test bench is established to solve the control instructions of the 14 actuators. The posture of the train running on the track is converted to the control instructions of the actuators based on the theory of space coordinates position and pose transformation. A virtual prototype model of the test bench is established before bench test to check the control instructions of the actuators and solve the relative position and posture of the adjacent vehicle ends. After determining the safety and reliability of the test, the bench test is carried out to measure the relative position and posture of the adjacent vehicle ends and compare with the results of the simulation. The error of the test and simulation is small, which proves the correctness of the test. The test proves that the inter-vehicle relationship test bench has the ability to simulate the actual running state of two adjacent vehicle ends and can provide design reference for the design of the inter-vehicle connections of new vehicle model.
Keywords
Introduction
In the train model, two adjacent vehicles are coupled with each other by inter-vehicle connections. 1 The inter-vehicle connections make the train has a strong coupling effect between the adjacent vehicles and can restrain the relative movement of the adjacent vehicle ends, including the vertical, lateral, pitching, and yawing movements of the vehicles. 2 The coupler, buffer, damper, vestibule diaphragm, electric connecting line, bridge line, and brake hose are important components installed on the vehicle ends. It is very important to study the motion of the above parts in vehicle design and optimization.
T Geike 3 established the linear and nonlinear coupler models and analyzed the influence of the parameters on the maximum coupler force. C Cole and YQ Sun 4 studied the effects of the parameters of the coupler force and coupler buffer on the train. WH Ma et al. 5 studied the static and dynamic impedance characteristics of the buffers on the dynamics performances of heavy haul train. M Ansari et al. 6 studied the effects of the stiffness and damping of the couplers on the longitudinal freight train dynamics. Ling et al.7,8 established a three-dimensional (3D) train-track coupling model with detail models of inter-vehicle connections and studied the effect of inter-vehicle connections on the vehicle performance by comparing with the results of single vehicle-track coupling model. The above researches are carried out by simulation analysis and difficult to simulate the actual operation of the train. YB Wang et al. 9 proposed a design scheme of the inter-vehicle relationship comprehensive test bench based on the Stewart parallel robot to simulate the movement of the train on the test bench. But only one end of the test bench can move, and the other end of the test bench was fixed on the foundation. Therefore, an inter-vehicle relationship test bench 10 is developed in this article. The test bench provides 12-degree-of-freedom (DOF) movement for two adjacent vehicle ends based on two 6-DOF platforms to realize the simulation of the running state of the train negotiating horizontal curve, vertical curve, and composite curve and check the relative position relations of inter-vehicle connections.
This article introduced the structure of the inter-vehicle relationship test bench and the method to solve the control instructions of the 14 actuators to drive the test bench. A virtual prototype model of the inter-vehicle relationship test bench was established before bench test to determine whether the generated control instructions can be applied to the bench test and obtain the position and posture of the adjacent vehicle ends by simulation. The bench test is carried out after confirming that the test was safe and feasible. The position and posture of the adjacent vehicle ends are measured and compared with the simulation results to verify the correctness of the test.
Structure of the inter-vehicle relationship test bench
As a multifunctional test equipment, the inter-vehicle relationship test bench can reproduce the vehicles negotiating horizontal curve, vertical curve, and composite curve. The relative motion relationship among the coupler, vestibule diaphragm, buffer, electric connecting line, bridge line, and brake hose installed at the end of the vehicle could be inspected on the test bench. It can also provide the basis for the installation locations and dimension designs of inter-vehicle connections for the development of new vehicles.
The inter-vehicle relationship test bench consists of 2 6-DOF platforms, 14 actuators, and 2 vehicle end simulators. Each 6-DOF platform is hinged with seven actuators (including four vertical actuators, two longitudinal actuators, and one lateral actuator). The bottoms of all the actuators are hinged with the base platform of the test bench. Two cast iron columns are installed on each 6-DOF platform, and the column is fixedly connected with the aluminum frame. Multiple manipulators are arranged on the aluminum frame, and the vehicle end simulator is fixed on the aluminum frame through the manipulators, which can rotate freely in 360° to meet the installation of different types of vehicle end walls. The vehicle end simulator is spliced together by multiple sheet metal parts in sequence according to the dimensions of actual vehicle end wall. Different vehicle ends can be simulated by changing the amount or rotation angle and the installation position of the sheet metal parts. The coupler, buffer, vestibule diaphragm, electric connecting line, bridge line, brake hose, and the sensors used for measuring the relative position and posture of the vehicle ends are installed between the two vehicle end simulators. The two 6-DOF platforms are driven by coordinated control of the motion of the 14 actuators. The two vehicle end simulators are installed on the two 6-DOF platforms, respectively, and move along with the two 6-DOF platforms to simulate the actual motion state of the adjacent vehicle ends when trains run on the railway. The actuators are numbered as follows: taking the vertical actuator installed at the southeast corner as a starting point, all the vertical actuators installed on 1# platform are numbered “1_1,”“1_2,”“1_3,” and “1_4” according to counterclockwise direction, respectively. The longitudinal actuators installed on the south and north of 1# platform are numbered “1_5” and “1_6,” respectively. The lateral actuator is numbered “1_7.” The numbers of 2# platform are symmetrical with 1# platform about the transverse symmetrical plane of the test bench. All the numbers are shown in Figure 1.

Structure of the inter-vehicle relationship test bench.
Model for solving the control instruction of actuators
According to the requirement for simulating the actual motion of the adjacent vehicle ends, the motion state of two 6-DOF orthogonal parallel motion platforms need to be coordinated controlled. JY Yao et al.11,12 proposed an output feedback nonlinear control and a nonlinear robust controller synthesized via the backstepping method and verified the high-performance nature of the proposed control strategy. Z Chen et al. 13 developed the integrated control design for multilateral teleoperation systems and achieved the guaranteed robust stability, the excellent synchronization, and transparency performance. WC Sun et al.14–17 proposed several control strategies to solve the problem of vehicle active suspension control under different conditions and proved the effectiveness of the control strategy. The hydraulic loading system of 6-DOF platform is a complicated control system. The zero phase feed forward tracking controller is designed to improve the control performance of single cylinder system and eliminate the phase difference and amplitude difference of the system. The radial basis function (RBF) neural network tuning proportional–integral–derivative (PID) control is adopted to coordinate the motion of the actuators, so that the loading accuracy is higher, and the expected load target of the 6-DOF platform can be achieved. The expansion amounts of all actuators are taken as the reference input signals for all electro-hydraulic servo actuators. The piston rod of each actuator tracks the reference signal to drive the two 6-DOF platforms. Therefore, the analysis of kinematics inverse solution of the 12-DOF parallel platform is the premise and key technology to realize the reproduction of the vehicle ends motion on test bench.
In order to solve the control commands of the actuators, a 3D model including track, train, and test bench is established. The track model is described by FRENET frame. 18 The train model includes three vehicles and the inter-vehicle connections. Each vehicle is equipped with a car body, two bogie frames, and four wheelsets. The model of inter-vehicle connections consists of couplers, inter-vehicle dampers, and tight-lock vestibule diaphragms. The train is coupled with the track by wheel–rail contact force. The track, train, and test bench are considered as a system to solve the expansion amounts of the 14 actuators by spatial coordinate transformation and inverse kinematics solution.
Track model
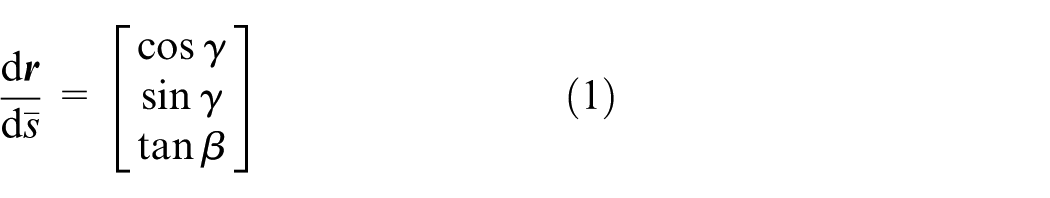
Track is a typical space curve, which can be described with FRENET frame
18
in differential geometry. Assuming that the center line of the track
The center line of the track can be taken as the synthesis of horizontal curve and vertical curve, and the horizontal curve can be described with curvature

where
Usually, a track cant is set in horizontal curve segment, then the rolling angle and vertical coordinates will change. The change of vertical coordinate can be expressed as

where h is the track cant,
The vertical curve causes the change of the vertical coordinate of the left and right tracks at the same time. The change of vertical coordinate caused by vertical curve is
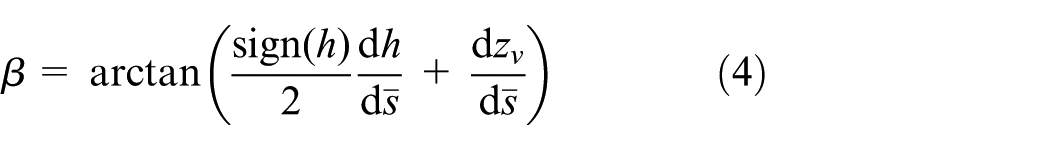

where
All the information of the track can be calculated according to the above formula by giving the radius of curvature, track cant, and vertical coordinates of the vertical curve of every point on the center line of the track.
Train model
A train with three vehicles is presented in this article. The adjacent vehicles of the train are connected with inter-vehicle connections. Each vehicle is equipped with a car body, two bogie frames, and four wheelsets with a total of seven rigid bodies including 42 DOFs. Each component of the vehicle has 6 DOFs: longitudinal displacement (X), lateral displacement (Y), vertical displacement (Z), rolling angle (φ), pitching angle (β), and yawing angle (ψ). The primary suspension system connects the bogie frames to four wheelsets. The secondary suspension system connects the car body to the bogie frames. The primary suspension system consists of the coil springs, axle-box bushings, and vertical dampers. The secondary suspension system consists of the air springs, yaw and lateral dampers, lateral bump-stops, anti-roll bar, and traction rod. The 3D spring-damper elements were used to represent the primary and secondary suspension systems. The multi-linear spring and damping elements were used to represent the nonlinear characteristics of the suspension systems, including the vertical dampers, yaw and lateral dampers, and the lateral bump-stops.
The adjacent vehicles connect with each other by inter-vehicle connections to restrain the relative motion of the adjacent vehicle ends, including the vertical, lateral, pitching, and yawing motions of the vehicles. Among the inter-vehicle connections, the couplers, inter-vehicle dampers, and tight-lock vestibule diaphragms affect the dynamic behavior of the train greatly. The tight-lock coupler is installed on the end of the vehicle to make the adjacent vehicles connected with each other and transfer the traction, braking force and ease the longitudinal impact force. The whole tight-lock coupler can rotate around the coupler yoke in the horizontal and vertical directions. Considering the nonlinear stiffness characteristic of the draft gear, a bilinear spring element is used to represent the draft gear. The forces of the coupler can be described as

where
The inter-vehicle dampers can not only reduce the longitudinal impact of the train but also restrain the pitching and yawing motions of the vehicles to improve the lateral stability and ride comfort of the train. The inter-vehicle dampers are modeled using bilinear spring-damper elements hinged to the edges of the base of the adjacent vehicle ends and can only stretch out and draw back along the axial direction. The nonlinear damping and the nonlinear stiffness are considered in this model. The forces of the inter-vehicle dampers acting on the adjacent vehicle ends can expressed as


where
In order to prevent sand, wind, and rain into the car body and improve the noise reduction performance of the vehicles, the tight-lock vestibule diaphragms are installed on the ends of the adjacent vehicles. The tight-lock vestibule diaphragms must satisfy the requirement of aerodynamics and acoustics of the train and should have good longitudinal scalability and lateral and vertical flexibility at the same time to bear the vibration and shock between two adjacent vehicles. In this model, the tight-lock vestibule diaphragms are simplified as 3D linear spring elements.
The motion equations of the nth vehicle can be expressed as

where
Wheel–rail contact model
The train is coupled with the track by wheel–rail contact force. The wheel–rail contact model includes the calculation model of wheel–rail contact geometry relationship, wheel–rail normal force, and wheel–rail creep force. The trace line method 19 can be applied to solve the wheel–rail contact geometry relationship. Based on the basic principle of the trace line method, a new wheel–rail spatial contact geometry model is used to calculate the wheel–rail contact geometry relationship.20,21 The instant motion and deformation of the rails and the separation of wheel and rail are considered in this model.
The Hertzian nonlinear elastic contact theory is used to calculate the wheel–rail normal force, which reads

where
When solving the wheel–rail creep force, Kalker’s 22 linear creep theory is used to calculate small amounts of creep and small spin. But the theory is not suitable for large creep rate and large spin. Therefore, a modified model is proposed by ZY Shen. By introducing a modification coefficient, Shen’s 23 model can be used to calculate the creep forces and creep moment for large creep rate and large spin.
The model of the track, train, and test bench
In order to reproduce the vehicle ends motion on the inter-vehicle relationship test bench, the track, train, and test bench should be considered as a system to solve the control instruction of actuators. The two 6-DOF platforms of the test bench are connected with the adjacent vehicles, respectively. The adjacent vehicles connect with each other by inter-vehicle connections. The car body connects with the bogie frames through the secondary suspension system. The bogie frames connect with the wheelsets through the primary suspension system. The wheelsets couple with the track by wheel–rail contact. The model of the track, train, and test bench is shown in Figure 2.

The model of the track, train, and test bench.
The global coordinate system O–XYZ and car body coordinate systems Oi–XiYiZi (i = 1, 2, 3) and its corresponding orbital coordinate systems 24 oi–xiyizi are created as shown in Figure 2. oi are the intersection points of cross section of car bodies and the center line of the track. Along the tangent of the center line of the track to the forward directions are xi axis, perpendicular to the orbit plane to the upward directions are zi axis, and yi axis are selected according to the right-hand rule. Oi are mass center of the car bodies. The directions of the forward movement of the car bodies are Xi axis, directions perpendicular to the bottom of the car bodies are Zi axis, and Yi axis are selected according to the right-hand rule as well. The base platform coordinate system Osj–XsjYsjZsj (j = 1, 2) and its corresponding orbital coordinate systems osj–xsjysjzsj are created as shown in Figure 2. osj are the midpoints of the curve o1o2 on the center line of the track. The selection of xsj, ysj, zsj axis has the same principle as the selection of xi, yi, zi, respectively. Point Osj coincides with point osj. The axially forward directions of the longitudinal actuators of the base platforms at the initial positions are Xsj axis. The axially upward directions of the vertical actuators are Zsj axis. Ysj axis are selected according to the right-hand rule.
The azimuth of the orbital coordinate system is determined by three Euler angles: rolling angle

Suppose that P is the arbitrary point on the car body, as shown in Figure 2. The position vector of point P in the global coordinate system can be expressed as

where
Since the method of solving the control instructions of the actuators in 2# test bench is the same as that of 1# test bench, 1# test bench is used as an example to illustrate the method. The two 6-DOF platforms of 1# test bench are fixedly connected with 1# and 2# car body, respectively. Therefore, the directions of the coordinate axis of 1#, 2# platform body coordinate system are in the same directions with the coordinate axis of 1#, 2# car body coordinate system. The origins of 1#, 2# platform body coordinate system are defined as the intersection point of the longitudinal symmetry plane of the longitudinal actuators and the axis of the lateral actuator. The position vector of 1# (2#) platform body coordinate system origin in 1# (2#) body coordinate system is


where
The coordinate matrixes of the actuators upper hinge points of 1#, 2# platforms in the global coordinate system can be expressed as


where
The coordinate matrixes of the actuators lower hinge points of 1#, 2# platforms in the base platform coordinate system can be expressed as


where
From the previous analysis, we can know that the origin of the base platform coordinate system Os1 coincides with the origin of the orbital coordinate system os1. In order to simulate the relative motion of two adjacent vehicle ends on the test bench, the base platform coordinate system should follow the movement of its corresponding orbital coordinate system and the bottom plane of the base platform should always be parallel to the horizontal plane. In other words, the base platform coordinate system only rotates around the zs axis of the orbital coordinate system. The rotation matrix is

where
The coordinate matrixes of the actuators lower hinge points of 1#, 2# platforms in the global platform coordinate system can be expressed as


where
The expansion amounts of the 14 actuators of 1#, 2# platform can be expressed as


where j = 1, 2, …, 7,
Solving the control instruction of actuators
The expansion amounts of the 14 actuators can be obtained based on the above theoretical analysis and taken as the reference input signals for the electro-hydraulic servo actuators of the inter-vehicle relationship test bench. The test bench moves according to the input control signals to simulate the relative movement of the actual two adjacent vehicle ends on the test bench.
The line parameters used for simulation are 60 m straight line + 60 m transition curve + 60 m circle curve + 60 m transition curve + 60 m straight line. The radius of circular curve is 250 m. The running speed of the train is 90 km/h. The cant of the circle curve is 120 mm. Based on a large number of measured data, the power spectral density of the track irregularity is obtained, and the road level is divided into six levels. The association of American railroads (AAR) five track spectrum is suitable for small radius curve and selected as the track irregularity excitation. In order to observe the relative motion of the two vehicle ends, the speed of the test bench is adjusted to 0.01 times of the actual speed during the test. The starting and ending positions of the actuators obtained from the simulation are not in 0 point, while the actuators must start at 0 and end at 0 in bench test, the linear interpolation method is used to insert a section of data at the start and end sections of the expansion amounts of the actuators obtained by simulation to ensure that each cycle the actuators is started from 0 and return to 0 position. Figures 3 and 4 show the expansion amounts of the actuators of 1#, 2# platforms in a cycle of motion, respectively. A positive value indicates actuator extension, and a negative value indicates actuator shortened. Cycle test can be used in actual test.
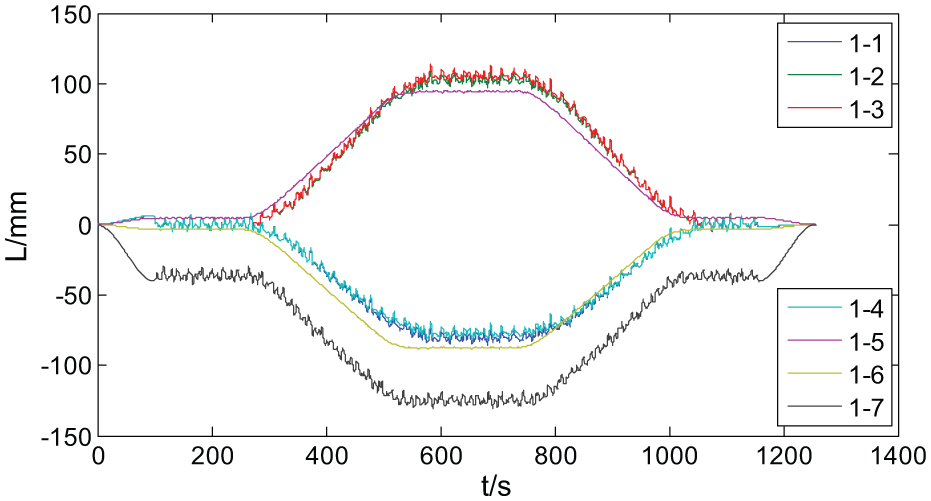
The expansion amounts of the actuators of 1# platform.

The expansion amounts of the actuators of 2# platform.
From Figures 3 and 4, we can know that the expansion amounts of the actuators are oscillating within a small value in the straight line and circle curve segments; in the first transition curve, the expansion amounts of the actuators move from the linear segment to the circular curve segment slowly and keep oscillation in a small range; in the last transition curve, the change tendencies of the expansion amounts of the actuators are opposite to the change trends of the first transition curve. The change tendencies of the actuators are consistent with the actual situation. The maximum expansion amount of the actuators is within ±150 mm and not exceeds the actuators stroke ±300 mm.
Simulation of the position and posture of vehicle ends
In order to ensure the safety and reliability of the test, it is necessary to establish a virtual prototype model of the inter-vehicle relationship test bench before bench test. Through the simulation, we can not only determine whether the generated test spectrum can be applied to the bench test but also obtain the position and posture of the adjacent vehicle ends to verify the correctness of the test results of the bench test.
The virtual prototype model of the inter-vehicle relationship test bench is shown in Figure 5. The two vehicle ends, two 6-DOF platforms, and the base platform are simplified as rigid bodies. The base platform is fixed on the ground, and the two vehicle ends are fixed with the two 6-DOF platforms, respectively. The 14 actuators are simplified as hydraulic cylinder-hydraulic rod models. The hydraulic rod can move along the axial direction of the hydraulic cylinder. The bottom of each hydraulic cylinder is hinged with the base platform, and the top of each hydraulic rod is hinged with the two 6-DOF platforms. The structure parameters of the model are the same as the actual test bench. The expansion amounts of the 14 actuators obtained above are used as displacement excitations to input to the 14 hydraulic cylinder-hydraulic rod models by one-to-one correspondence. The simulation time is consistent with the time of the test spectrum, and the sampling frequency is 125 Hz. The position and posture of 2# vehicle end relative to 1# vehicle end are solved after the simulation.

The virtual prototype model of the inter-vehicle relationship test bench.
1# vehicle position and posture measurement coordinate system Ots1–Xts1Yts1Zts1 and 2# vehicle position and posture measurement coordinate system Ots2–Xts2Yts2Zts2 are shown in Figure 5. Ots1 coincides with Ots2 and its position vector is determined by the position and posture measurement sensor installed on the vehicle ends. Xtsj, Ytsj, Ztsj (j = 1, 2) parallel to the longitudinal, lateral, vertical axis of 1#, 2# vehicle ends, respectively. The displacements of 2# vehicle end relative to 1# vehicle end along Xts1, Yts1, Zts1 axis are shown in Figures 6–8, respectively. The angles between Xts1, Yts1, Zts1 axis and Xts2, Yts2, Zts2 axis are shown in Figures 9–11, respectively. In order to compare with the test data, the results of the data in the figures are two cycles.

The displacement of 2# vehicle end relative to 1# vehicle end along Xts1 axis.

The displacement of 2# vehicle end relative to 1# vehicle end along Yts1 axis.

The displacement of 2# vehicle end relative to 1# vehicle end along Zts1 axis.

The angle between Xts1 axis and Xts2 axis.

The angle between Yts1 axis and Yts2 axis.

The angle between Zts1 axis and Zts2 axis.
Bench test and results analysis
The simulation confirmed that the test is safe and feasible and then the bench test is carried out. The test site is shown in Figure 12, the left picture (a) shows the left view of the test site, and the right picture (b) shows the installation position of the position and posture measurement device on the vehicle ends. The measurement device is arranged in the middle of the tight-lock vestibule diaphragms and includes two triangular frames. The two ends of the triangular frames are connected with the two vehicle ends, respectively. The two triangular frames connect with each other by two cross universal joints. Three photoelectric encoders are installed on the cross universal joints to measure the relative angle of two vehicle ends. The photoelectric encoder is composed of a grating disk and a photoelectric detection device, and the geometric displacement quantity is converted to impulse by photoelectric conversion. Three displacement sensors are installed on the triangular frames to measure the relative displacement of two vehicle ends. Guyed displacement sensor is composed of a magnetic stand and stretchable rope, and the mechanical displacement is converted to the voltage output of a linear or arbitrary function through the potentiometer element. The relative motion of the two vehicle ends is decomposed to realize independent measurement of the six components of the displacement and the rotation angle of 2# vehicle end relative to 1# vehicle end by the structure shown in Figure 12.

The test site.
The displacement sensors and the angle measuring sensors were collecting the data of the relative position and posture between the two vehicle ends during the test. The test results were compared with the simulation results to verify that the inter-vehicle relationship test bench had the ability to measure the position and posture of the adjacent vehicle ends. In order to verify the repeatability of the test, two cycles of the test was carried out. The displacements of 2# vehicle end relative to 1# vehicle end along Xts1, Yts1, Zts1 axis measured by experiment are shown in Figures 6–8, respectively.
Due to the three angles measured in the simulation were the angles between Xts1, Yts1, Zts1 axis and Xts2, Yts2, Zts2 axis, respectively, and the three angles measured in the test were the rotation angles of 2# vehicle end relative to 1# vehicle end around Xts1, Yts1, Zts1 axis, the three angles measured in the test needed to be transformed into the angles between Xts1, Yts1, Zts1 axis and Xts2, Yts2, Zts2 axis, respectively. Assume that the unit vectors of coordinate axes of the local coordinate system of 1# vehicle end are

After the movement, the unit vectors of coordinate axes of the local coordinate system of 2# vehicle end can be expressed as

where n = 1, 2, 3.
The angles between Xts1, Yts1, Zts1 axis and Xts2, Yts2, Zts2 axis can be expressed as

In order to compare with the results of simulation analysis, the angles between Xts1, Yts1, Zts1 axis and Xts2, Yts2, Zts2 axis obtained from the above formula are shown in Figures 9–11, respectively.
Through comparison and analysis, we can draw the following conclusions: on the whole, the curve of the test results and the simulation results have the same trend; the relative errors of the angles between Xts1, Yts1, Zts1 axis and Xts2, Yts2, Zts2 axis are within 5%; the relative errors of the displacements of 2# vehicle end relative to 1# vehicle end along Xts1, Zts1 axis are slightly big, but the displacements of 2# vehicle end relative to 1# vehicle end along Xts1, Zts1 axis are small, when the train is moving at constant speed, the relative motion between the two adjacent vehicle ends in the longitudinal direction and the vertical direction have little influence on the performance of the train; the lateral relative motion of the adjacent vehicle ends has a great influence on the performance of the train, and the maximum relative error of the displacement of 2# vehicle end relative to 1# vehicle end along Yts1 axis is 5.3%. The above analysis shows that the test results are in good agreement with the simulation results, which proves that the inter-vehicle relationship test bench has the ability to test the position and posture of the adjacent vehicle ends.
In the inspection of the relative motion of the inter-vehicle connections, the swing angle of the coupler relative to the vehicle end, the angle between the adjacent vehicle end walls (or vestibule diaphragms), the lateral dislocation distance between the adjacent vehicle end walls, and the minimum distance from the contour line of one vehicle end wall to adjacent vehicle end wall need to be investigated.
The swing angle of the coupler
The position and posture of 2# vehicle end relative to 1# vehicle end measured by the test take 1# vehicle end as a reference, that is to say, the local coordinate system of 1# vehicle end is considered as the static coordinate system, so the coordinate of the hinge point between the coupler and 1# vehicle end in the local coordinate system of 1# vehicle end remains unchanged. The coordinate of the hinge point between the coupler and 2# vehicle end in the local coordinate system of 1# vehicle end needs to be solved by inverse kinematics solution. The position vector of the hinge point between the coupler and 1# (2#) vehicle end in the local coordinate system of 1# (2#) vehicle end is

The swing angles of the coupler relative to 1#, 2# vehicle ends can be expressed as


where
The swing angles of the coupler relative to 1#, 2# vehicle ends are shown in Figures 13 and 14, respectively. The maximum swing angle of the coupler relative to 1# vehicle end is 2.98°, and the maximum swing angle of the coupler relative to 2# vehicle end is 3.18°.

The swing angle of coupler relative to 1# vehicle end.

The swing angle of coupler relative to 2# vehicle end.
The angle and the lateral dislocation distance between the adjacent vehicle end walls
The Xts1,Xts2 axis of the local coordinate system of 1#, 2# vehicle ends are perpendicular to 1#, 2# vehicle end walls, respectively, so the angle between Xts1 axis and Xts2 axis is equal to the angle between the adjacent vehicle end walls. As shown in Figure 9, the maximum angle between the adjacent vehicle end walls by the test is 5.82°. The lateral dislocation distance between the adjacent vehicle end walls is the relative displacement between two adjacent vehicle ends in lateral direction. The test result is shown in Figure 7, and the maximum lateral dislocation distance between the adjacent vehicle end walls is 73 mm.
The minimum distance from the contour line of 2# vehicle end wall to 1# vehicle end wall
The minimum distance between two adjacent vehicle ends is the minimum distance from the contour line of one vehicle end wall to the adjacent vehicle end face. The contour line of the vehicle end wall can be expressed as data series

where
The coordinate vector of the corresponding points on the contour line of 1# and 2# vehicle end wall can be expressed as

The distances from the contour line of 2# vehicle end wall to 1# vehicle end wall can be expressed as

The movement positions of the vehicle end walls are shown in Figure 15. The red line represents the contour line of 1# vehicle end wall, and the blue lines represent the contour lines of 2# vehicle end wall at t = 0, 200, 400, 600, 800, 1000, and 1200 s. The minimum distance from the contour line of 2# vehicle end wall to 1# vehicle end wall is 488.9 mm.
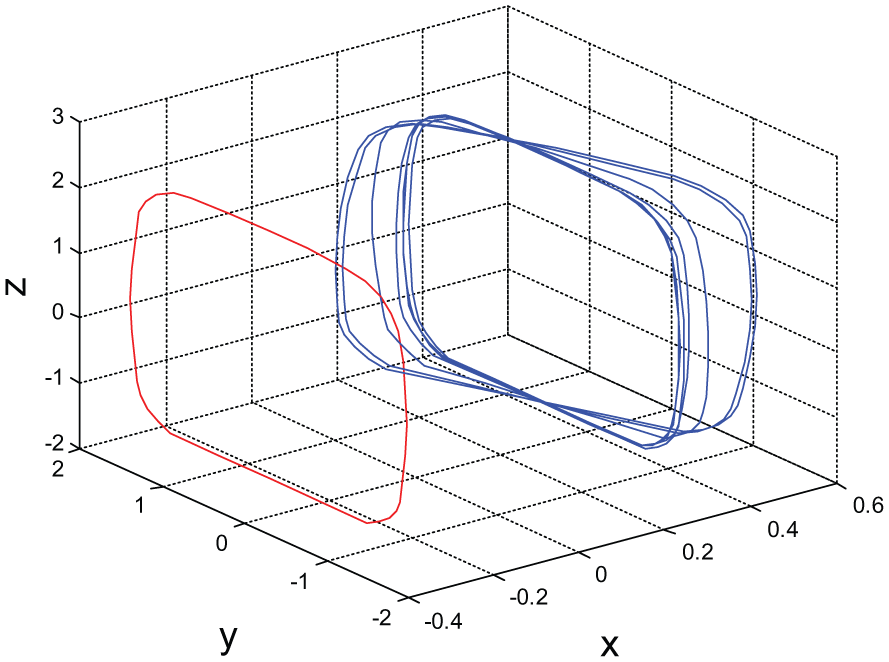
The motion attitude of vehicle end wall.
Through the above analysis, when the train runs on the line set in this article, the swing angle of the coupler relative to the vehicle end, the angle between the adjacent vehicle end walls, the lateral dislocation distance between the adjacent vehicle end walls, and the minimum distance from the contour line of 2# vehicle end wall to 1# vehicle end wall were within a safe range, which proved that the train can negotiate the line set by this article safely. In order to investigate the curve negotiation performance of the train, the line conditions can be set to different conditions. In addition, the test of this article can also provide design reference for the design of the inter-vehicle connections of new vehicle model.
Conclusion
The structure of inter-vehicle relationship test bench was presented in this article. In order to solve the control commands of the actuators, a 3D model including track, train, and test bench was established. The running state of the train was converted to the expansion amounts of the 14 actuators by spatial coordinate transformation and inverse kinematics solution. A virtual prototype model of the inter-vehicle relationship test bench was established before bench test and verified that the generated test spectrum can be applied to the bench test. The position and posture of the adjacent vehicle ends were measured by bench test and compared with the simulation results to verify the correctness of the test. The analysis of the test data proved that the train can negotiate the line set by this article safely. The inter-vehicle relationship test bench has the ability to simulate the actual running state of two adjacent vehicle ends and can provide design reference for the design of the inter-vehicle connections of new vehicle model.
Footnotes
Academic Editor: Zheng Chen
Declaration of conflicting interests
The author(s) declared no potential conflicts of interest with respect to the research, authorship, and/or publication of this article.
Funding
The author(s) disclosed receipt of the following financial support for the research, authorship, and/or publication of this article: This work was supported by the National Natural Science Foundation of China (51205164) and the National Natural Science Foundation of China (51478204).