
Abstract
TB17 is an ultra-high-strength titanium alloy, a material typically difficult to machine. The surface quality and integrity of titanium alloy TB17 are poor after machining, which can seriously affect its service performance and restrict its fields of application. Therefore, the optimization of high-speed milling process parameters for the new ultra-high-strength titanium alloy TB17 was investigated based on multiple performance characteristics, including surface roughness, surface microhardness, and surface residual stress. The Taguchi method with grey relational analysis was utilized for the experiments. Additionally, analysis of variance was employed to evaluate the most influential factors for surface integrity in the high-speed milling of titanium alloy TB17. The results of the analysis using the Taguchi-Grey relational analysis method indicate that the preferred combination of high-speed milling process parameters are as follows: the cutting fluid condition of H-1 fine grinding fluid, using a milling speed of 100 m/min, a feed per tooth of 0.02 mm/z, an axial depth of cut of 1 mm, a radial depth of cut of l.5 mm, a rake angle of 18°, a clearance angle of 12°, and a helix angle of 60°. Moreover, the analysis of variance reveals that milling speed has the greatest effect on the surface integrity in the high-speed milling of the TB17 titanium alloy, and the contribution percentages for each factor are as follows: the cutting fluid condition (3.98%), milling speed (25.89%), feed per tooth (8.96%), axial depth of cut (1.29%), radial depth of cut (13.71%), rake angle (17.17%), clearance angle (6.62%), and helix angle (15.64%).
Keywords
Introduction
Titanium alloys have been widely applied in the aviation, aerospace, military, automotive, and chemical industries due to their attractive properties, such as high strength-to-weight ratio, excellent heat treatment capability, and exceptional resistance to corrosion and creep.1–4 As a typical ultra-high-strength titanium alloy, TB17 has been developed for structural elements in the aviation industry demanding high specific strength and specific stiffness. Thus, TB17 can achieve a greater weight-loss effect. 5 However, titanium alloys are generally defined as a difficult-to-machine material because of the low thermal conductivity and high chemical activity. The heat produced during the machining process can be prevented from spreading due to the low thermal conductivity, which leads to an increase in the temperature in the cutting area. In addition, the high chemical reactivity of titanium alloys results in strong adhesion between the workpiece material and the cutting tool. The factors given above will accelerate the tool wear and decrease the surface integrity in the machining process. Hence, improvement of the surface integrity in machining titanium alloys has been an urgent problem to be solved.6–9
Certain valuable studies have been conducted in recent years to investigate the surface integrity of machining titanium alloys. Yang et al. 10 found that the milling speed had a significant effect on the surface integrity of Ti-6Al-4V. The results of measurement of the surface roughness, the residual stresses in the feed direction, and the axial depth of cut direction indicated that a milling speed from 320 to 380 m/min could produce better and more stable values compared to the results obtained from 80 to 120 m/min. Variation in subsurface microhardness was observed down to 160 µm below the machined surface at 320 to 380 m/min and down to 200 µm at 80 to 120 m/min. A higher material removal rate and better surface integrity could be achieved at a milling speed of 320 to 380 m/min rather than at 80 to 120 m/min. Yao et al. 11 investigated the influence of cutting parameters on surface integrity through milling Ti-10V-2Fe-3Al. The results showed that the surface roughness decreased while surface residual compressive stress increased when the cutting speed was 100 or 140 m/min compared with 60 m/min. Furthermore, the feed per tooth had a greater impact on surface integrity compared to the milling speed. Wyen et al. 12 studied the influence of cutting edge radius on surface integrity in the up and down milling of Ti-6Al-4V. Their research revealed that residual compressive stress increased significantly with the cutting edge radius in the process of up milling, whereas, there was no uniform trend in down milling. Li et al. 13 established two optimization objectives in terms of different industrial demands. Optimization objective I aimed to minimize the number of tools consumed and the production time per piece, and objective II aimed to minimize surface roughness, the absolute value of residual stress, and the production time per piece. Additionally, production cost and surface quality were optimized simultaneously based on the coupling of the two optimization objectives. The research of Yao et al. 14 demonstrated that all machined surfaces were in a state of residual compressive stress under the experimental conditions, and the surface residual compressive stress increased with the increase in the milling parameters. With a milling speed of 60 m/min, a feed per tooth of 0.02 mm/z, an axial depth of cut of 10 mm, and a radial depth of cut of 0.2 mm, only compressive residual stress existed in the machined surface and subsurface. Ji et al. 15 proposed a prediction model of residual stress in minimum quantity lubrication (MQL) machining as a function of the tool geometry, cutting parameters, MQL application parameters, and material properties. In addition, the prediction model was validated by the orthogonal cutting experiments for the TC4 alloy. Styger et al. 16 described a finite element evaluation to characterize the relationship between different constitutive models and residual stress induced by machining for titanium alloy Ti6Al4V. Ratchev et al. 17 successfully predicted the residual stress induced by machining at different depths of cut and cutting speeds for the Ti6Al4V alloy based on a dynamic thermomechanical finite element model for turning. Su et al. 18 presented a model to predict the residual stresses generated from the milling process. Cutting force and cutting temperature predictions were both incorporated into the model, and their parameters were used to define the thermomechanical loading experienced by the workpiece. Finally, milling experiments were carried out on Ti-6Al-4V to validate the reliability of the model. Bhopale et al. 19 applied response surface methodology coupled with teaching-learning-based optimization (TLBO) technique to optimize process parameters for deflection, surface roughness, and microhardness of plate in ball-end milling process of Inconel 718 cantilevers. The comparison of experimental and model results indicates that the model is of high prediction accuracy. Guillemot et al. 20 studied the effect of lead angle of the tool, cusp height and feed per tooth on the micro-geometry, residual stresses, and strain hardening in ball-end finishing milling of high-strength bainitic steel. They also proposed a fast procedure to make a first characterization of the surface integrity. Arif et al. 21 studied the different morphologies of machined surface and chip achieved at various cutting speeds, and established a connection between them. They presented a qualitative means to rapidly characterize the machined surface integrity in dry end milling of titanium alloy based on chip morphology. Mehfuz and Ali 22 investigated the effect of feed rate, capacitance and voltage on the average surface roughness, maximum peak-to-valley roughness height, tool wear ratio, and material removal rate. The models based on desirability function approach were established to optimize multiple-response. Tosun 23 optimized the drilling parameters for surface roughness and burr height by Grey relational analysis, which can effectively improve the surface roughness and burr height in the process of drilling.
Although many scholars have studied the surface integrity in the machining process of medium-strength titanium alloys, such as Ti6Al4V, few studies have considered high-strength titanium alloys and ultra-high-strength titanium alloys. Therefore, investigation of the surface integrity of milling TB17, a typical ultra-high-strength titanium alloy, is essential. At present, the optimization of process parameters to obtain the desired surface quality has become a topic of great interest. However, the current studies have many limitations. The optimization methods, such as uniform design experimentation and factorial design experimentation, are suitable only for fixed experimental conditions, lacking applicability and generality. Furthermore, previous studies have mainly been concerned with the separate optimization of cutting parameters, tool geometry, or cutting fluid condition, and they have not typically considered comprehensively optimizing the surface integrity in the machining process.24–27
The aim of this study is to investigate the surface integrity of the high-speed milling of the new ultra-high-strength titanium alloy TB17. The Taguchi-Grey relational analysis method, a relatively effective approach to design experiments and achieve multi-objective optimization, has been utilized to optimize the process parameters, including milling parameters, tool geometry, and cutting fluid condition, and to simultaneously analyze the influence of process parameters on surface integrity. Analysis of variance (ANOVA) has been employed to determine the degree of influence of the different process parameters on surface integrity. This article will provide meaningful guidance for selecting preferred process parameters in the high-speed milling of titanium alloys.
Experimental setup
Work material
The high-speed end milling experiments were carried out on a vertical machining center-VMCL 850, where the maximum spindle speed can reach up to 12,000 r/min. The experimental setup and machined surface are shown in Figure 1. The workpiece material utilized in this study was the new ultra-high-strength titanium alloy TB17, which was in a state of forging. The microstructure of titanium alloy TB17 is shown in Figure 2. The main chemical compositions of titanium alloys TB17 and Ti-6Al-4V are compared in Table 1. The mechanical properties of titanium alloys TB17 and Ti-6Al-4V at room temperature are compared in Table 2. 2 The specimens were standardized at a size of 60 mm × 60 mm × 10 mm. The uncoated cemented carbide cutting tools-YG8 with 12 mm diameter and four flutes were used in the experiments, and new cutting tools were applied to each test.

(a) Experimental setup and (b) machined surface.
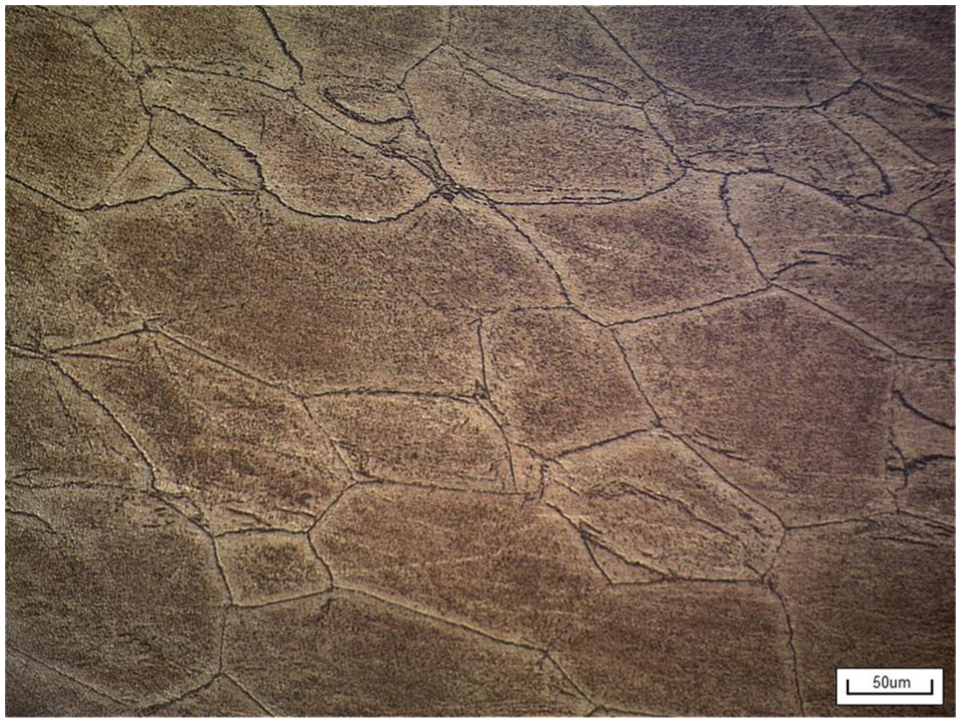
Microstructure of titanium alloy TB17.
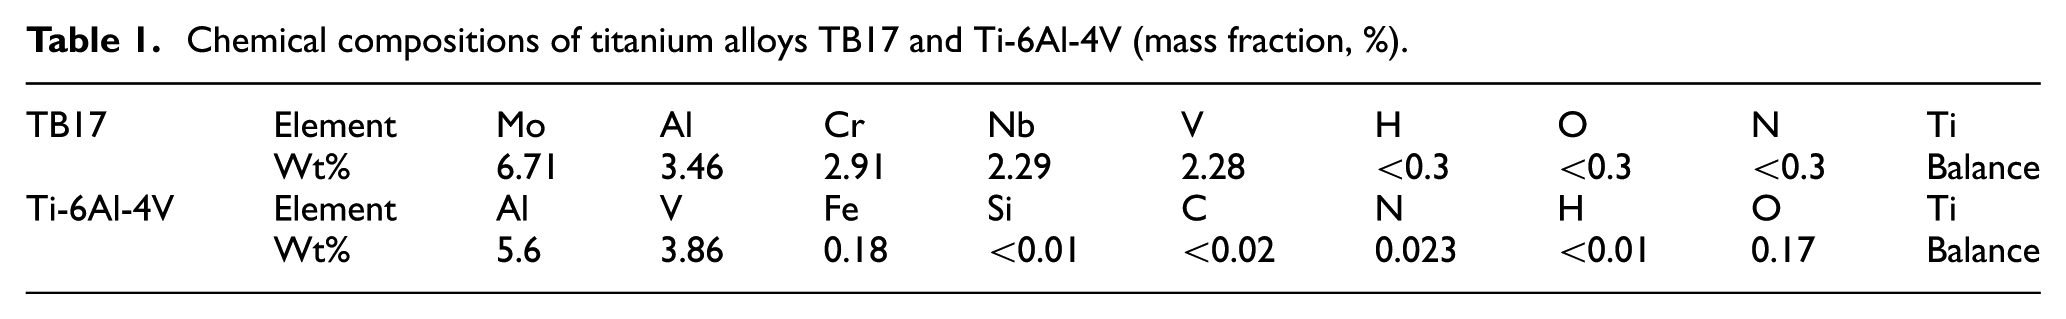
Chemical compositions of titanium alloys TB17 and Ti-6Al-4V (mass fraction, %).
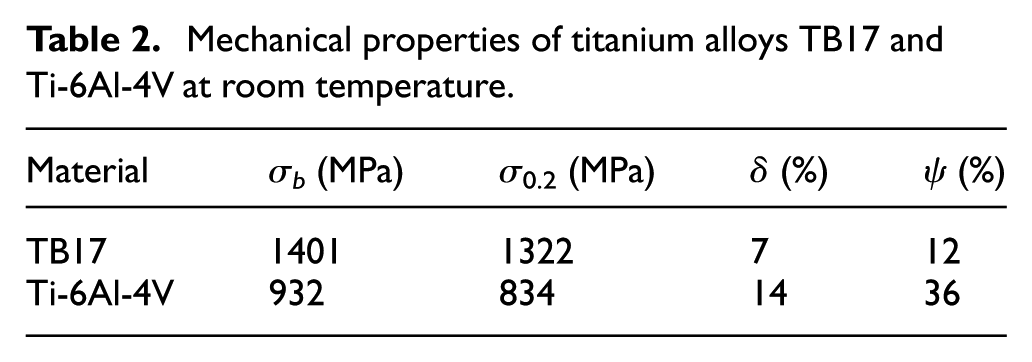
Mechanical properties of titanium alloys TB17 and Ti-6Al-4V at room temperature.
Design of experiments
This study focused on eight controllable factors (cutting fluid condition, milling speed, feed per tooth, axial depth of cut, radial depth of cut, rake angle, clearance angle, and helix angle) and three response variables (surface roughness, surface microhardness, and surface residual stress).24,28 Each factor has three levels, except for cutting fluid condition, which has two levels. An overly small cutting consumption will reduce the processing efficiency of titanium alloy TB17; however, the strength and hardness of titanium alloy TB17 are overly high, excessive cutting consumption will reduce the tool life. Higher processing efficiency and lower tool wear are considered in the choice of milling speed and feed per tooth simultaneously. The choice of axial and radial depth of cut is based on the practical engineering application. The choice of tool geometry parameters can fully meet the needs of production and the universality of tool manufacturing. Therefore, referring to the relevant literatures and considering the actual processing requirements, the cutting parameters were chosen as shown in Table 3. Meanwhile, the L18 (2 × 37) orthogonal array was used to form an experimental plan, which is presented in Table 4.
Controllable factors and their levels.

Taguchi L18 (2 × 37) orthogonal array.

Measurements of surface integrity
Surface roughness, surface microhardness, and surface residual stress were measured in this research. The measurement of surface roughness in the feed direction was conducted by a portable roughness measuring instrument (TR200). The cut-off length was set to be automatic, and the evaluation length was five times the cut-off length used for the measurement of surface roughness. Surface roughness is of significant importance for surface integrity. In total, 10 measuring points were selected along the feed direction for each machined specimen and their average value was recorded as a surface roughness parameter. Surface microhardness was measured by the HV-1000 microhardness tester using a 500-g load that lasts 15 s. The measurement of surface microhardness was performed six times for each machined specimen and the average value was used to characterize the surface microhardness. Surface residual stress was measured using the blind-hole method in the JHYC-16 static strainmeter. The strain gauge is pasted on the surface of the specimen, and then, a hole is drilled to the depth of 2 mm. Then, the release of surface residual stress will be transformed into the surface strain. In addition, the surface residual stress can be calculated by strain variation. Measurements (1–3) were performed on each sample, and the effective data were taken as the surface residual stress parameters. All residual stresses on the machined surfaces performed as compressive stresses in this study.
Experimental results and discussion
Analysis of the signal-to-noise ratio
The signal-to-noise (S/N) ratio is an effective analytical means to represent a quality characteristic in the Taguchi method, and the preferred level of process parameters is symbolized by the largest value of the S/N ratio. The S/N ratio can be categorized into three types: the lower-the better, the nominal-the better, and the higher-the better. In this study, a lower surface roughness, higher surface microhardness, and higher surface residual compressive stress are expected to be achieved. Thus, the lower-the better S/N ratio was selected for surface roughness, and the higher-the better S/N ratio was applied in the study of surface microhardness and surface residual compressive stress.
The S/N ratio with the lower-the better characteristic can be expressed as follows

The S/N ratio with the higher-the better characteristic can be expressed as follows

where yi is the average measured value of the ith experiment and n is the number of the repeated experiment.24,25,29
Table 5 shows the experimental results of surface roughness, surface microhardness, and surface residual stress as well as, the corresponding S/N ratios using equations (1) and (2).
Experimental results and S/N ratios.

S/N: signal-to-noise ratio.
Cutting force and cutting heat are produced in the milling process, and the quality of the machined surface is influenced by both of them. The impact of machine and cutting tool on the whole machining system becomes larger with the increase of cutting force. Then, the load condition of tool will be poor, and it results in the increase in surface roughness of machined surface. The increase of cutting heat will cause thermal deformation of the process system, aggravating tool wear, and which also increases the machined surface roughness. Besides, the increase of cutting force will produce a strong plastic deformation, which will increase the degree of grain fibrosis, crystal lattice distortion, and grain elongation. Thus, work hardening effect can be enhanced. However, the degree of work hardening will weaken because the material can be softened due to the cutting heat. Moreover, the material on the surface has a plastic deformation while the internal material stands elastic deformation under the action of cutting force. After the machining, the internal material will have elastic recovery, which will be restricted by the surface material. So, the material in the machined surface is pressured and obtains compressive stress. Meanwhile, a mass of cutting heat can make the volume expansion of the surface material larger than that of the internal material. Therefore, the volume shrinkage of the surface material is greater than that of the internal material after cooling. The shrinkage of the surface material can be limited by the internal material, and then tensile stress in the machined surface will be generated. In a word, surface integrity in the milling process is the result of superposition of cutting force and cutting heat. 30
According to the data in Table 6, the best combination of process parameters to attain lower surface roughness is as follows: the cutting fluid condition of H-1 fine grinding fluid (Level 2), a milling speed of 140 m/min (Level 2), a feed per tooth of 0.02 mm/z (Level 1), an axial depth of cut of 0.5 mm (Level 1), a radial depth of cut of 1 mm (Level 1), a rake angle of 18° (Level 3), a clearance angle of 16° (Level 2), and a helix angle of 30° (Level 1). In addition, feed per tooth has the greatest effect on the surface roughness among the eight parameters considered. The mean S/N ratio value for surface roughness initially increases and then decreases with increases in the clearance angle because of two contrasting effects. Furthermore, increasing the clearance angle can reduce the friction and cutting deformation, which can reduce the cutting heat and cutting force. Therefore, the quality of the machined surface can be improved and the surface roughness will decrease. However, due to the ultra-high strength and hardness of TB17 titanium alloy, the increase in the clearance angle will aggravate tool wear and can lead to increase in the machined surface roughness. Figure 3 shows eight graphs of the mean S/N ratios of each controllable factor at their levels for surface roughness.
Mean S/N ratios for surface roughness of each factor at their levels.

S/N: signal-to-noise ratio.
Main effect graph of S/N ratio for surface roughness.
As shown in Table 7, the preferred process parameters for surface microhardness are as follows: the cutting fluid condition of H889 synthetic metal working fluid (Level 1), a milling speed of 100 m/min (Level 1), a feed per tooth of 0.06 mm/z (Level 3), an axial depth of cut of 1.5 mm (Level 3), a radial depth of cut of 2 mm (Level 3), a rake angle of 18° (Level 3), a clearance angle of 20° (Level 3), and a helix angle of 30° (Level 1). In addition, all process parameters have no significant influence on surface microhardness. However, the radial depth of cut is a more influential parameter relative to the other parameters considered. The mean S/N ratios of surface microhardness associated with each controllable factor at their levels are plotted in Figure 4.
Mean S/N ratios for surface microhardness of each factor at their levels.

S/N: signal-to-noise ratio.

Main effect graph of S/N ratio for surface microhardness.
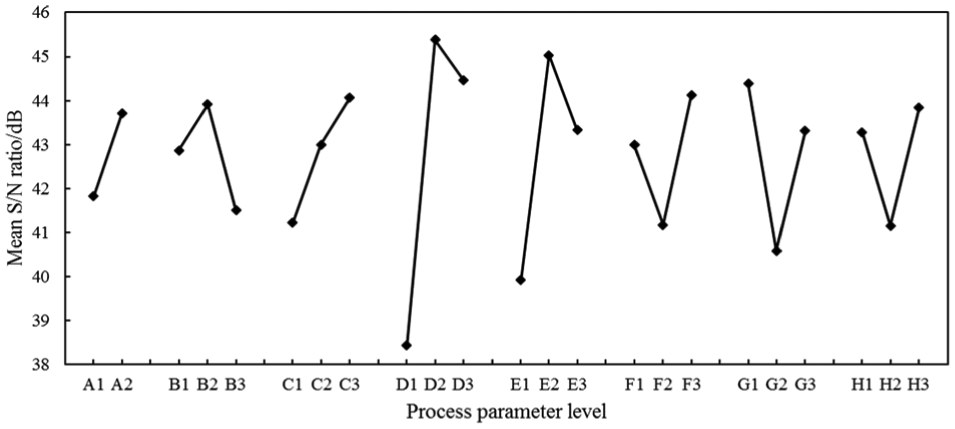
As shown in Table 8, the preferred combination of process parameters for the surface residual stress is as follows: the cutting fluid condition of H-1 fine grinding fluid (Level 2), a milling speed of 140 m/min (Level 2), a feed per tooth of 0.06 mm/z (Level 3), an axial depth of cut of 1 mm (Level 2), a radial depth of cut of 1.5 mm (Level 2), a rake angle of 18° (Level 3), a clearance angle of 12° (Level 1), and a helix angle of 60° (Level 3). Furthermore, the axial depth of cut is the most important factor affecting the surface residual stress among the eight parameters. The mean S/N ratios for surface residual stress of axial depth of cut and radial depth of cut initially increase and then decrease because cutting force and cutting heat both increase with increase in the axial depth of cut and radial depth of cut. Mechanical stress caused by the cutting force is beneficial to the generation of residual compressive stress, whereas thermal stress caused by cutting heat is beneficial to the generation of residual tensile stress. In general, the results achieved are comprehensively affected by mechanical stress and thermal stress. Similarly, the effects of the tool rake angle, clearance angle, and helix angle on surface residual stress are the results of simultaneous parameter variation and tool wear. Figure 5 shows the mean S/N ratios of surface residual stress related to each controllable factor at their levels.
Mean S/N ratios for surface residual stress of each factor at their levels.

S/N: signal-to-noise ratio.
Main effect graph of S/N ratio for surface residual stress.
Grey relational analysis
In this study, the high-speed milling process parameters of titanium alloy TB17 were optimized with Grey relational analysis, which is an efficient methodology for overcoming the complex correlations among the multiple quality characteristics. First, the experimental results are normalized to be in the range between 0 and 1; this is known as data pre-processing. Then, there are three types of data pre-processing for the Grey relational generation.
In this experiment, the data pre-processing of surface roughness, which possesses the lower-the better quality characteristic, can be expressed as follows

The data pre-processing of surface microhardness and residual stress, which possess the higher-the better quality characteristic, can be expressed as follows

where i is the experiment number, from 1 to 18; k represents the kth performance characteristic;
Second, after the Grey relational generation, the Grey relational coefficient


where
The weights of multi-performance characteristics are different from each other due to the variety of surface integrity properties. To obtain more accurate results, the weight coefficients of various performances can be determined by the entropy weight method (EWM) combined with the analytic hierarchy process (AHP). However, for simplicity, the weight coefficients are assumed to be equal in this study. 34 Thus, the Grey relational grade is the average value of the Grey relational coefficients, which can be used to transform the optimization of the multi-response characteristics into the optimization of a single response. Then, the preferred level of the process parameters can be selected by the level with the highest Grey relational grade. The Grey relational grade is defined as follows

where n is the number of performance characteristics (in this study, n = 3).24,25,31
The normalized values of surface roughness, surface microhardness, and surface residual stress are shown in Table 9. The Grey relational coefficients and Grey relational grades are given in Table 10. The higher Grey relational grade shows that the corresponding combination of process parameters becomes closer to the preferred level. In other words, a higher Grey relational grade results in better quality characteristics.25,29 Experiment number 12 possesses the highest Grey relational grade with the order of 1. Consequently, A2B1C3D2E2F1G1H3 is the preferred combination of process parameters for access to the best surface integrity among the orthogonal experiments.
Normalized values of experimental results.

Grey relational coefficients and Grey relational grades.

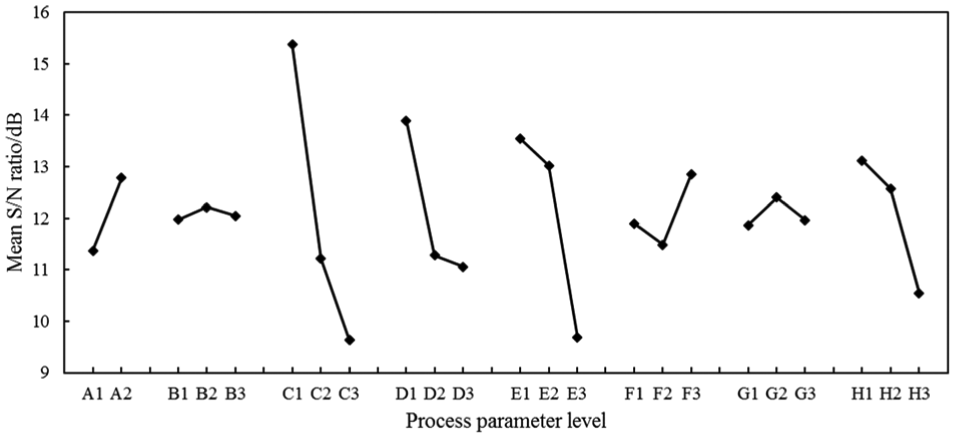
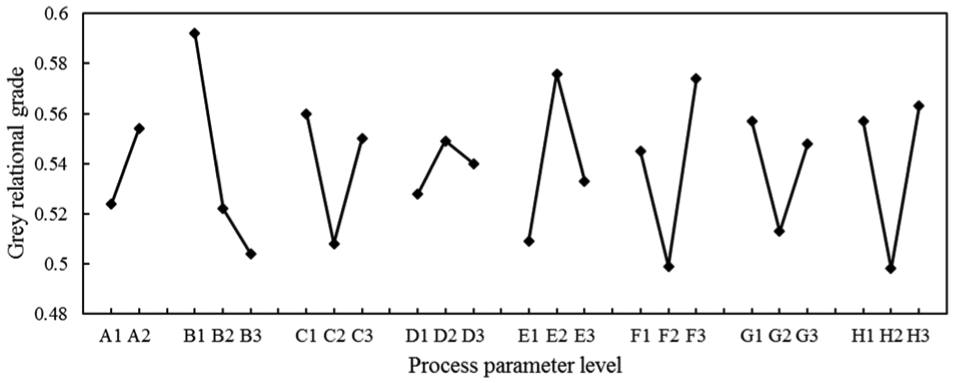
The mean values of the Grey relational grades of process parameters for each level based on Table 10 are shown in Table 11. The effects of each factor in relation to multiple quality characteristics of the Grey relational grade are plotted in Figure 6. Table 11 and Figure 6 illustrate that the preferred process conditions to attain the best multiple quality characteristics for surface integrity in high-speed milling of TB17 titanium alloy are A2B1C1D2E2F3G1H3, that is, the cutting fluid condition of H-1 fine grinding fluid, a milling speed of 100 m/min, a feed per tooth of 0.02 mm/z, an axial depth of cut of 1 mm, a radial depth of cut of 1.5 mm, a rake angle of 18°, a clearance angle of 12°, and a helix angle of 60°.
Main effects of process parameters on the Grey relational grade.

Total mean of the Grey relational grade = 0.539.
Effects of each process parameter on the Grey relational grade.
ANOVA
ANOVA is a mathematical assessment method to analyze the contribution percentage of each controllable factor on the process response. The main purpose of ANOVA is to illustrate which process parameter significantly influences the performance characteristics. A larger contribution percentage indicates that the factor is more significant in influencing the performance characteristics.24,25,28
The ANOVA results for the Grey relational grade are presented in Table 12. According to Table 12, the rank order of contribution percentages of each process parameter in high-speed milling is as follows: (1) milling speed (25.89%), (2) rake angle (17.17%), (3) helix angle (15.64%), (4) radial depth of cut (13.71%), (5) feed per tooth (8.96%), (6) clearance angle (6.62%), (7) cutting fluid condition (3.98%), and (8) axial depth of cut (1.29%). Thus, the contribution percentage of error is 6.74%. A comparison of the contribution percentages for each process parameter illustrates that the error, milling speed, rake angle, helix angle, radial depth of cut, and feed per tooth strongly influence the Grey relational grade, whereas the clearance angle, cutting fluid condition, and axial depth of cut are less significant. Furthermore, the milling speed is the most effective factor for the surface integrity.
ANOVA results for the Grey relational grade.

DF = Degrees of Freedom.
Confirmation experiments
The confirmation experiment is the final step to predict the performance characteristic with the preferred combination of process parameters and to verify the practicality and repeatability of the optimization method used in this study.24,25,33 The estimated Grey relational grade at the preferred condition can be calculated as follows

where Xm is the total mean of the Grey relational grade, Xi is the mean Grey relational grade at the preferred level, and n is the number of the process parameters that significantly affect the multiple performance characteristics.24,25,33,35
The comparison between the predicted Grey relational grade using the preferred process parameters, the experimental Grey relational grade using the preferred process parameters and the experimental Grey relational grade using the initial process parameters is presented in Table 13. The result of the confirmation experiment indicates that although the surface microhardness and surface residual compressive stress decrease slightly from 459.89 to 458.63 HV and from 432.12 to 385.09 MPa, respectively, the surface roughness is considerably improved from 0.345 to 0.201 µm. Furthermore, the Grey relational grade is improved by 0.003 from the initial process parameters to the preferred process parameters. More importantly, the difference between the predicted Grey relational grade (0.709) and the experimental Grey relational grade (0.740) is 0.031, which demonstrates a great agreement between the predicted result and actual result. In summary, the Grey relational analysis based on the Taguchi method is a useful way to optimize the process parameters for the high-speed milling of titanium alloy TB17.
Results of confirmation experiment for the Grey relational grade.

Improvement in the Grey relational grade = 0.003.
Conclusion
In this article, the process parameters influencing the surface integrity in high-speed milling of the TB17 titanium alloy are optimized and analyzed using the Taguchi-Grey relational analysis method. The research method used in this article is efficient and credible and verified by confirmation experiments, which can provide meaningful guidance for selecting process parameters in the high-speed milling of titanium alloys. The conclusions of this study are as follows:
According to the S/N ratio, the preferred process parameters for reducing surface roughness are found to be the cutting fluid condition of H-1 fine grinding fluid, a milling speed of 140 m/min, a feed per tooth of 0.02 mm/z, an axial depth of cut of 0.5 mm, a radial depth of cut of 1 mm, a rake angle of 18°, a clearance angle of 16°, and a helix angle of 30°. For surface microhardness, the preferred process parameters are obtained at the cutting fluid condition of H889 synthetic metal working fluid, a milling speed of 100 m/min, a feed per tooth of 0.06 mm/z, an axial depth of cut of 1.5 mm, a radial depth of cut of 2 mm, a rake angle of 18°, a clearance angle of 20°, and a helix angle of 30°. Similarly, the preferred combination of process parameters for surface residual stress is the cutting fluid condition of H-1 fine grinding fluid, a milling speed of 140 m/min, a feed per tooth of 0.06 mm/z, an axial depth of cut of 1 mm, a radial depth of cut of 1.5 mm, a rake angle of 18°, a clearance angle of 12°, and a helix angle of 60°.
The preferred combination of process parameters for obtaining satisfactory surface integrity in the high-speed milling of titanium alloy TB17 based on Grey relational analysis is as follows: the cutting fluid condition of H-1 fine grinding fluid, a milling speed of 100 m/min, a feed per tooth of 0.02 mm/z, an axial depth of cut of 1 mm, a radial depth of cut of 1.5 mm, a rake angle of 18°, a clearance angle of 12°, and a helix angle of 60°. However, the deficiency of this study is that the weight coefficient is not considered when calculating the Grey correlation grade. Therefore, how to determine the weight coefficient more scientifically will be an important issue to be addressed in future research. Furthermore, only surface roughness, hardness, and residual stress were measured. The microstructural damage may be totally different; therefore, it is not a true measure of surface integrity. The three measures are only one of the few used to measure surface integrity.
The ANOVA indicated that milling speed is the most influential factor for surface integrity, and the contribution percentages of different process parameters are as follows: cutting fluid condition (3.98%), milling speed (25.89%), feed per tooth (8.96%), axial depth of cut (1.29%), radial depth of cut (13.71%), rake angle (17.17%), clearance angle (6.62%), and helix angle (15.64%).
A confirmation experiment was performed to verify the effectiveness of the Taguchi-Grey relational analysis method. The proposed approach in this article is indeed a reliable method to optimize process parameters and improve surface integrity in high-speed milling of new ultra-high-strength titanium alloy TB17.
Footnotes
Academic Editor: Crinela Pislaru
Declaration of conflicting interests
The author(s) declared no potential conflicts of interest with respect to the research, authorship, and/or publication of this article.
Funding
The author(s) disclosed receipt of the following financial support for the research, authorship, and/or publication of this article: This work was financially supported by the Aviation Science Foundation of China (grant no. 20153021001).