
Abstract
Collision risk index is important for assessing vessel collision risk and is one of the key problems in the research field of vessel collision avoidance. With accurate collision risk index obtained through vessel movement parameters and encounter situation analysis, the pilot can adopt correct avoidance action. In this article, a collision risk index estimation model based on support vector machine is proposed. The proposed method comprises two units, that is, support vector machine–based unit for predicting the collision risk index and the genetic algorithm–based unit for optimizing the parameters of support vector machine. The model and algorithm are illustrated in the empirical analysis phase, and the comparison results show that genetic algorithm-support vector machine model can generally provide a better performance for collision risk index estimation. Meanwhile, the result also indicates that the model may be not so good when we take a higher value of collision risk index. So, the distinguishing threshold of collision risk level should be adjusted according to actual situation when applying this model in practical application.
Introduction
Background
Collision, grounding, and striking on rocks are the common accidents when vessels are navigating. Once accident happened, the serious casualties, property loss, and environmental pollution are inevitable. Especially for the vessels such as oil tanker, liquefied petroleum gas (LPG), liquefied natural gas (LNG), chemical tanker, and nuclear ship, vessels collision will lead to serious marine environmental pollution and irreparable ecological disaster. For example, on 8 March 1967, oil tanker Torry Canyon ran aground near the southeast coastal areas of Britain. This accident led to crude oil leak of 100 thousand tons and the clean-up costs reached up to 10 million ponds. On 6 March 1978, super oil tanker Amoco Cadiz ran aground near the French Brittany seas, causing 220 thousand tons of crude oil leaking and polluting 180 km French seacoast. The clean-up costs reached up to 100 million dollars, fishery damages to 3000 thousand, and travel damages to 60 million dollars. So, vessel accident, especially dangerous cargo vessel accident, not only results in casualties and property loss but also brings marine environment and marine organism with serious ecological disasters. At present, how to avoid and reduce the damage caused by vessel accident has been becoming an extremely significant problem.
In navigation safety research field, vessel collision avoidance is an important problem to be solved. In which, as the basis index of assessing vessel encounter situation, collision risk index (CRI) is essential for the pilot adopting correct avoidance action and for the engineers developing intelligence vessel collision avoidance system. In fact, CRI is influenced by many factors, such as distance of close point of approaching (DCPA), time to close point of approaching (TCPA), azimuth of coming vessels, vessels velocity, and the situation of visibility distance. Therefore, how to calculate the CRI index according to the vessels movement and encounter situation is a challenging task.
Literature review
In the past decades, CRI has been studied under the Convention on the International Regulations for Preventing Collisions at Sea (COLREGs) since 1972. The main methods include DCPA and TCPA weighting measure method,1–7 fuzzy comprehensive evaluation method,8–13 artificial neural network (ANN) method,14–19 and other new methods.20–25
At the beginning of the research on the vessel collision risk, based on initial DCPA and TCPA data, researchers focus on the factor’s weight determination and their application with distributed regularity. For instance, Kearon 1 proposed a CRI estimation method through parameters weighting and then the collision risk was determined with practical experiences of collision at sea.
However, from the perspective of practice, the process of collision risk judgment has the features of fuzzy and ambiguity. How to evaluate CRI based on actual pilot decision process is an important problem need to be resolved. Therefore, AN Cockeroft 8 applied fuzzy reasoning theory to the presented collision avoidance model. At that time, this method is an advanced technique, but there are still certain difficulties in determining the membership function. Based on fuzzy comprehensive evaluation method, Kim and Kim 12 presented a CRI model considering the factors of DCPA, TCPA, the target ship distance, locations, speed ratio, and touch angle. But, the factors such as human, vessels, and environment are not included. On this basis, Zhou and Wu 10 improved this model and introduced the vessel type and tonnage, pilot skill and visibility, and other factors into this research field. In consideration of the nonlinear and complexity characteristic for CRI estimation, Chen 14 proposed a CRI estimation model combining ANN with fuzzy reasoning theory. This method has the traits that fuzzy logic can be understood easily and ANN has extremely strong adaptive capacity.
With the development of research on vessel collision risk avoidance, accurate CRI level classification plays more and more important roles for the effective ship collision avoidance strategy making. Chin and Debnath 20 proposed a binomial model based on DCPA and TCPA, which classifies vessels’ encounter situation into serious and low-risk situation. And then CRI was calculated by ordered probability unit regression model, in which collision risk is considered as continuous variable and effected by DCPA and TCPA monotonously. Ren et al. 5 raised a linear model which considered several variables such as vessel type, velocity and route as the basic input vector for evaluating collision risk. Furthermore, on the basis of this method, considering TCPA and relative bearing between two vessels, an evaluation method based on multiplication of basic collision risk, TCPA, DCPA, and angle is proposed in this article.
In summary, the scholars have profoundly studied in CRI. The research about employing fuzzy comprehensive evaluation to CRI determination is more than others. Fuzzy comprehensive evaluation is used to calculate relative movement parameters between vessels according to initial data of vessel (such as DCPA and TCPA) and then the parameters are used as the evaluation index for CRI calculation through fuzzy inference rules or fuzzy membership functions. However, this method still has some certain limitations when the calculation is complicated. Since there are many factors affecting CRI determination (such as velocity and direction), relationship between the factors and CRI has the characteristics such as nonlinearity, stochasticity, and ambiguity. So, how to solve the problem from multiple attribute decision making process is a big challenge task.
Support vector machine (SVM) is a relatively new kind of learning machine which has been applied successfully to estimation. 26 Considering the parameters will greatly affect the performance of SVM, some researchers attempted to determine the parameter values for their problems. Hou and Li 27 attempted to determine the parameters in SVM by use of evolution strategy with covariance matrix adaptation. Hsu et al. 28 applied grid search to determine the adaptive values for the parameters in SVM. Heuristic algorithms have been successfully used in many complex problems.29–31 Thus, this article also applies a common heuristic algorithm, 32 genetic algorithm (GA) to determine the appropriate parameters for SVM.
The purpose of this article is building a CRI estimation model based on SVM, which is used to solve the complicated nonlinear mapping problem between CRI and dynamical vessel parameters. The article is organized as follows: in section “CRI estimation based on fuzzy comprehensive evaluation,” the impacting factors description and calculation based on fuzzy comprehensive evaluation are demonstrated. In section “Estimation model of CRI based on SVM,” CRI estimation model based on SVM is proposed and the parameters are optimized with GA method. In section “Simulation analysis,” the presented model is tested and results are discussed. Finally, the conclusions are given together with suggestions for further study.
CRI estimation based on fuzzy comprehensive evaluation
Influence factors analysis
In the process of vessel collision avoidance, CRI can be used to measure the danger degree of collision. DCPA and TCPA are usually considered as the most effective index for determining the value of CRI. As shown in Figure 1, DCPA and TCPA can be obtained by geometric calculation of vessel collision avoidance.

The diagram of vessel collision geometry.
Given the own ship coordinate, direction, and velocity as
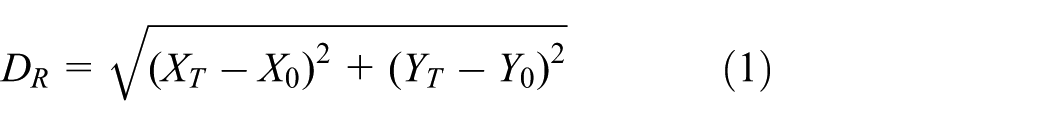

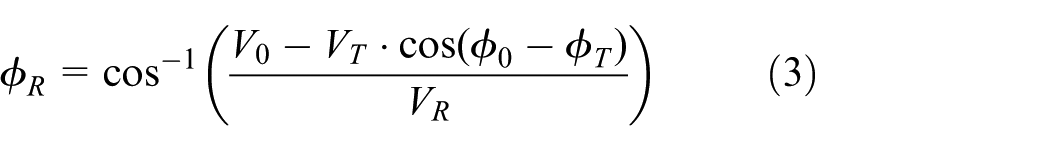


where DR denotes the relative distance between the owner and target ships, VR denotes the relative velocity,
When DCPA equals 0, it means that if the two vessels maintain the current velocity and direction, the collision will happen after a certain period at one point. DCPA > 0 indicates that there is a certain distance between two vessels when both of them are encountering. But there may still exist collision risk. If TCPA takes a larger value, the danger degree of collision cannot be induced only by DCPA. If DCPA equals 0 or less than a given value, the smaller the value of TCPA, the larger the degree of collision danger, and vice versa. So, in collision avoidance practice, if DCPA is less than a safe distance and TCPA is smaller, there may be a risk of collision.
DCPA and TCPA are the most main and directive factors for judging the collision existing or not. On the other hand, DCPA and DR are the most practical factors in the actual practice. In order to obtain the degree of collision danger, only considering DCPA and TCPA or DCPA and DR is not enough. We should simultaneously consider the effect of other factors, such as relative orientation of two vessels and relative bearing.
CRI calculation
CRI has the characteristic of ambiguity and complexity. So it can be determined with fuzzy comprehensive evaluation theory. It can be represented as

where U is the membership matrix of target factor, W is weight matrix, and K is velocity ratio of two vessels, K = VT/V0.
1. Membership function of DCPA
The larger the value of DCPA, the smaller the degree of collision danger. The membership function of DCPA can be presented as

where d1 is the minimal safe encounter distance and d2 is the absolute safe encounter distance. The range of d1 and d2 can refer to the amended Goodwin observation data, as shown in Figures 2 and 3 and Table 1.

Situation of vessel collision avoidance.

Distribution figure of θT.
Observation value of d1 and d2.

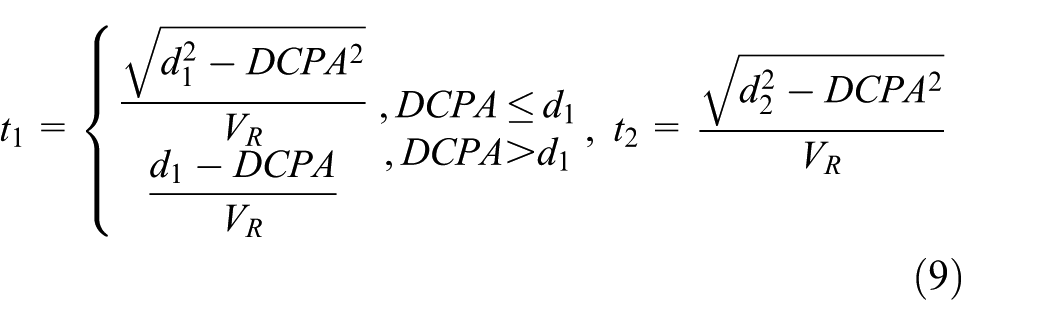
2. Risk membership function of TCPA
The risk membership function of TCPA can be represented as

where the range of t1 and t2 can be represented as
3. Risk membership function of DR
The smaller the DR, the smaller the distance between the target vessel and the own vessel, and the greater the degree of collision risk. The risk membership function of DR can be presented as

where D1 is the critical safe distance, which is usually equal to 12 times length of vessel. D2 is the distance in which pilots can adapt avoidance measure. The value of D2 is usually equal to R which is the radius of marine power model obtained by Davis

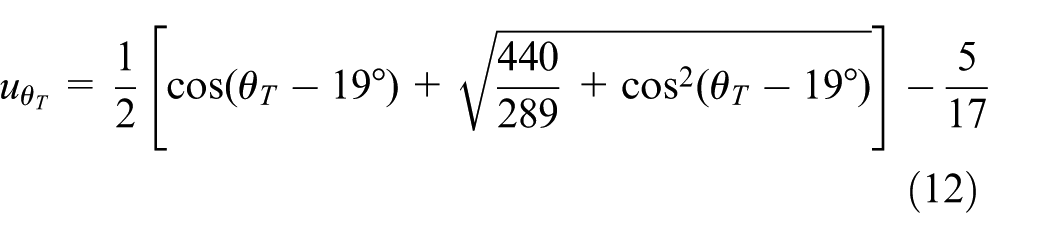
4. Membership function of θT
For the owner ship, target vessels at different position have different effect on the risk level of collision. Generally, the danger from right side is larger than the left side and the front is larger than the back. The membership function of θT can be represented as
5. Membership function of K
The membership function of K can be represented as
Estimation model of CRI based on SVM
In the actual practice of navigation, the vessel’s initial moving parameters and partial relative parameters can be obtained by onboard instrument. The pilots should identify the existing risk through fusing the information presented with these parameters. However, the relation between CRI and vessel’s moving parameters is complicated and nonlinear. Therefore, how to describe these characters and propose a corresponding model for CRI level classification is a big problem need to be solved.
As a new and promising technique for classification and regression problems, SVM can be adjusted to map the complex input–output relationship for the nonlinear system without dependent on the specific functions. Therefore, considering the actual needs in this research and the merit of SVM, this article applies SVM to the estimation of CRI.
Support vector regression
Given

The optimized regression function is the minimum and regularized generic function under certain constraints

where


The minimization of formula (17) is a convex quadratic optimization problem and then the problem can be inferred with the Lagrange multipliers

Then

Substituting the kernel function into formula (20), then

where K(
Structure of the SVM model
In the actual practice of navigation, pilots can directly obtain the owner vessel and the target vessel’s initial moving parameters such as ϕ0, ϕT, V0, and VT through onboard instrument such as Automatic Identification System (AIS). The relative bearing θT and distance DR can be obtained with radar sensor. Among the factors for risk level estimation, the length of vessel (LOA) is known in advance, the time for turning 90°, and shifting distance of gravity and advance can be determined by the owner vessel’s situation. The evaluation indexes of CRI, such as DCPA and TCPA, can be obtained by two encountering vessels’ original data. Therefore, in this article, the CRI estimation model based on SVM is proposed as Figure 4. In which, each of the parameters above are combined as an input vector

CRI estimation model based on SVM.
Parameter optimization
Although SVM is feasible for CRI estimation, there are some parameters, which greatly impact the performance of SVM, that need to be optimized in advance. In general, for radial basis function (RBF) kernel, parameters C, γ, and ε are very important for the SVM prediction performance. So, the parameter optimization is essential for improving the estimation accuracy. Furthermore, there are several parameter optimization methods such as cross-validation (CV), particle swarm optimization (PSO), and GA. In which, GA is a search heuristic that mimics the process of natural selection and is also tested by lots of researchers as an effective method to solve this kind of complex problems. So, this article proposes a GA-SVM model which applies GA for the parameter optimization. The key steps are as follows:
Chromosome coding. Assume that the parameters
Fitness function. In this article, considering that GA is always finding the maximum fitness of the individual chromosome, mean squared error (MSE) is adopted
where
Selection operation. In order to reduce the computation time, here we choose Roulette selection strategy as the selection operation and implement best part of the chromosome retention strategy (i.e. in each generation the partial individual who has highest fitness directly becomes the next-generation population). The strategies not only guarantee convergence of algorithm but also increase the pressure of selection and accelerate the convergence. The specific operational process is as follows: we set selection parameters PS and set PS/N (N is the scale of population) as threshold. The chromosome whose adaptation rate is bigger than the threshold can directly retain to the next generation without Roulette selection. Otherwise, if chromosome can be chosen to the next generation depends on the Roulette selection.
Crossover operation. The crossover operation produces offspring through exchanging two parent chromosomes’ gene. The specific crossover operation is as follows

where
Mutation operation. The number of mutation is controlled by the mutation rate

where
Termination condition. In this article, the search loop continues until
Simulation analysis
Performance measures
In this article, the range of CRI is set as [0, 1]. In order to evaluate the accuracy of the model, mean average error (MAE) and root mean square error (RMSE) are adopted, which are represented as


where n is the number of testing sample,
Data selection
In the case of situation that two vessels encounter under the environment of good visibility, COLREGS divides the encounter situation into three situations: head-on, crossing, and overtaking. When vessel is implementing collision avoidance, considering the different features coming from vessels on different bearing, and in order to satisfy the requirements of collision avoidance, the action situation can be divided into six situations (i.e. A, B, C, D, E, and F), just as shown in Figure 2. Considering it is difficult to obtain enough data which can comprehensively reflect all action situations, this article uses simulation data samples for the presented model test. In which, the input feature vector for SVM
In the process of generating sample randomly, in order to reflect the real encounter situation between vessels and guarantee the effectiveness of data set, the range of parameters in actual practice should be considered. According to the collision avoidance situation and the relationship between the relative bearing and the critical safety passing distance, under head-on and crossing conditions, the initial distance between two vessels preferably is 6 nautical miles (nm). So, the range of DR is set to [0, 7] nautical miles (nm). The velocity of vessel depends on the vessel type. Generally, the velocity of dry bulk vessels and oil tankers is slower, ranging from 13 to 17 knots, and the container vessels faster. The highest velocity can reach 20–23 Kn. But in fact, container vessels generally adapt economical speed (i.e. 18 Kn). Comprehensively considering the type of vessels and navigation situation, the range of V0, VT are set to [6, 20] nm/h and ϕ0, ϕT, and θT are set to [0°, 360°].
According to the range discussed above, samples data can be generated. In order to ensure the effectiveness of data set, samples date is collected from six encounter situations (A–F), in which each situation contains 50 groups’ data. So, it’s totally 300 groups’ data. And then we choose 50 groups data as testing sample.
Results analysis
In the test experiment, to properly optimize the three parameters

The parameter optimization results of SVM models: (a) CV-SVM, (b) PSO-SVM, and (c) GA-SVM.
Comparison with different parameter search results.

MAE: mean average error; RMSE: root mean square error; CV-SVM: cross-validation support vector machine; PSO-SVM: particle swarm optimization support vector machine; GA-SVM: genetic algorithm support vector machine.
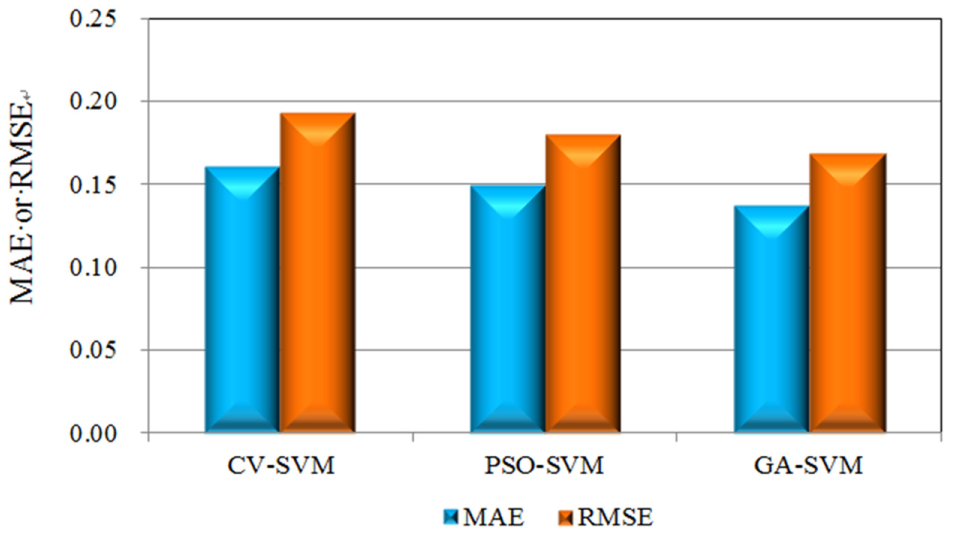
Error comparison of SVM models.
According to comparison results, it is obvious that the prediction accuracy of GA-based method is improved than cross validation (CV) method which is often adopted in SVM training process. Furthermore, for computational speed for parameters searching, the time consumption of CV-SVM model is shortest. However, by comparison with the aviation and road transportation, the velocity and encounter situation of vessels change slowly and the process of collision avoidance needs 1–2 h. So CRI estimation doesn’t have strict demand on time consumptions and in actual practice the parameters optimization model with high accuracy should be chosen.
MAE and RMSE demonstrate the error between the estimation value and the real value of CRI. They can be used to evaluate estimation accuracy. But on the contrary, they can’t indicate the estimative value is less than or more than the real value. The accurate results can directly affect the opportunity of taking collision avoidance plan. So, we give out the estimative value of CRI for 50 groups testing data in Figure 7. And the CRI scatterplot between the estimative value and real value is shown in Figure 8.
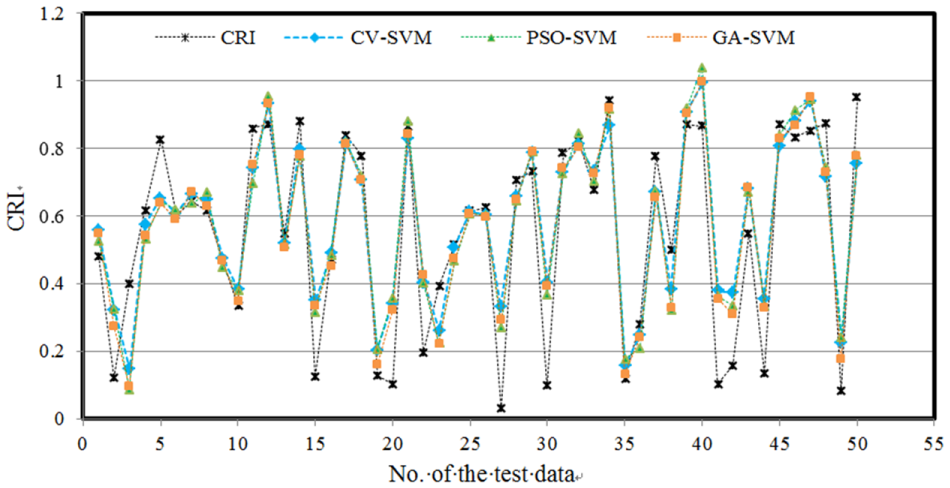
The estimative result of SVM models.

Estimation ability of the three models on CRI.
From Figure 7, we can see that 50 groups testing data probably cover all the CRI situation between 0 and 1. Figure 8 shows that when CRI is less than 0.43, the estimative value is more than the real value. And when CRI is not less than 0.43, the estimative value is less than the real value. Zhou and Wu
10
divided thevessel collision risk into three levels according to CRI: “low risk”
Conclusion
This article proposes a CRI estimation model based on SVM and applies GAs to optimize the corresponding parameters. And then the verification and analysis with simulation samples data are conducted by comparisons between CA-SVM, PSO-SVM, and GA-SVM models. Results show that the CRI estimation model based on SVM has higher accuracy and the accuracy of GA-SVM model is the best. However, the estimative value of SVM model is lower when CRI is higher. So, the rating threshold can be appropriately adjusted according to actual situation when applying this model to the judgment of vessel collision risk rating.
However, there are some unresolved issues to be discussed in the future work. First of all, this article applies simulation analysis to the training and testing of the model. In the future study, in order to test the accuracy and applicability of model in practical collision avoidance, actual vessel data should be applied to the model testing procedure.
Footnotes
Academic Editor: Gang Chen
Declaration of conflicting interests
The author(s) declared no potential conflicts of interest with respect to the research, authorship, and/or publication of this article.
Funding
The author(s) disclosed receipt of the following financial support for the research, authorship, and/or publication of this article: This work was partially supported by National Natural Science Foundation of China (Grant Nos 51509031 and 51578112), China Postdoctoral Science Foundation (Grant No. 2015M581329), Ministry of Housing and Urban-Rural Development (Grant No. K520136), and the Fundamental Research Funds for the Central Universities (No. DUT16QY42).