
Abstract
Due to the characteristics of structure, brushless direct current motor has a long lifetime, which makes it more difficult to obtain failure data. Accordingly, valid degeneration characteristics are required in life prediction. In this article, a novel method of condition monitoring and comparing is presented, which contributes to life prediction. Experiments were conducted for hundreds of hours to get degradation data of brushless direct current motor used in rotor of unmanned aerial vehicle. Furthermore, the vibration characteristics were analyzed by Hilbert–Huang transform to get energy spectrum. And, the differences in energy spectrum between two groups of sample collected were quantified by Euclidean distance. According to the scan under microscope, the oxidation was observed on surface of the used bearing, which leads to the changes in energy spectrum. The experimental results demonstrate that Hilbert–Huang transform energy spectrum can be effectively applied to monitor and evaluate the status of brushless direct current motor.
Introduction
Electronic commutation circuit is used in brushless direct current motor (BLDCM), instead of mechanical brush, which obviously reduces the incidence of wear and fatigue and improves its service life and reliability. However, the long life of BLDCM makes it difficult to collect enough failure data for prediction, and it is necessary to find appropriate degradation characteristics to represent the lifetime and status of BLDCM.
Considering about the regularity reflected on machinery during operating, vibration signal is employed as the most effective parameter to measure machinery operation process, including sufficient failure information comparing with other parameters. The research on relationship between vibration signals and working status has been deeply dived, and many papers about failures diagnosis based on vibration signals were published.1–3 The BLDCM used in unmanned aerial vehicle (UAV) is typical kind of rotating machinery, and its vibration signals data are analyzed to diagnose failures. Many other literatures about methods of extracting failure information from vibration signals, such as wavelet transform, Hilbert–Huang transform (HHT), are reviewed and investigated.
In general, the vibration of rotating machine is generated by rotor and transmitted by complex mechanical structure. The vibration signals captured are the result of modulation with a number of signals, which are nonlinear and non-stationary. And the information contained in signals may decay or even become invisible, which makes it more difficult for anomaly detection. For analysis of signals, Fourier transform is the main basic method. And, fast Fourier transform, proposed by Cooley and Tukey, 4 expanded the application of Fourier transform in 1960s. Compared with Fourier transform with disadvantages, such as low resolution, wavelet transform provides clear local information of non-stationary signals caused by rotating machinery. Actually, wavelet transform is a kind of Fourier transform with adjustable window, leading to the result that frequency range is decided by sampling frequency, irrelevant to signals. 5 HHT has satisfactory adaptability, applied to monitor status of buildings, 6 analyze vibration signals, 7 and predict natural calamities. 8
Although the previous studies have already proposed many approaches for fault diagnosis, most papers did not focus on the discussion and prediction of degradation trend but the identification of different types of faults. 9 Actually for pivotal components, like BLDCM in UAV, it is necessary to monitor and predict their status in advance so as to avoid serious accidents and pecuniary loss.
HHT and energy spectrum
HHT method
During the period between 1996 and 1998, NE Huang et al. 10 proposed a method of empirical mode decomposition (EMD) and introduced concept and analysis method of the Huang spectrum based on the Hilbert transform named HHT by NASA, denoted as HHT. EMD has many excellent properties including the adaptability, orthogonality and completeness, and it has been widely used in many areas. By adopting EMD, the vibration signal is decomposed into a number of intrinsic mode function (IMF) components. If the functions are IMF components, the following two criteria must be satisfied:
The number of zero points and extreme points, in the continuance of the signals, must be equal or no more than one point difference.
The mean of the upper envelope composed by the local maximum and lower envelope composed by the local minimum is zero at any time.
EMD method has two procedures as follows:
Search all local extreme points of the signal, and fit all local maximum by cubic spline to form upper envelope.
Fit all local minimum by cubic spline to form lower envelope. All data points are contained between upper and lower envelopes.
The average of upper and lower envelope is denoted as

If
4. Conversely, if h1 does not meet the principle of IMF, it should be decomposed by above steps continually until we get

After finishing the decomposition of the signal, every IMF is processed by Hilbert transform to generate the time–frequency distribution.
Hilbert energy spectrum based on HHT
As mentioned above, EMD can be used in describing how frequency components change with time and in generating the time–frequency distribution of signals. For the signal

where T is the time range of sampling. Hilbert energy spectrum demonstrates how the energy of signal
Experiments and data analysis
Experiments
In this article, BLDCM used in UAV is chosen to carry out testing, generating vibration signals. In order to simulate the working environment where BLDCM is normally used in UAV, the motor is designed to operate with rotor to obtain vibration signals. Specific fixture is designed to fix motor and transducers and is isolated from ground and other objects by sponge so as to avoid interference from external environment. The motor in experiments has the following specifications: volt: 26 V, rotational speed: 2300 r/min. Power is supplied to the motor by direct current (DC) power. The experiments are conducted at regular room temperature, and the humidity is not controlled.
Vibration signals are processed by acceleration transducer fixed on the fixture. Besides, vibration signals on three axes are captured in this experiment. The degradation effects of three sample groups from different axes are compared. Computer system is utilized to capture and record signals. The motor is run for 3 h in each time, so as to avoid the overheat of other relevant equipment because of long-term operation. Then, we monitor the temperature of motor in order to pursue the normal operation. The motor is controlled by computer with the help of electronic governor. In general, electronic governor is commanded by remote control in UAV. However, in the experiments, electronic governor is commanded by computer and single-chip microcomputer (SCM) for continuous and stable operation (Figure 1).
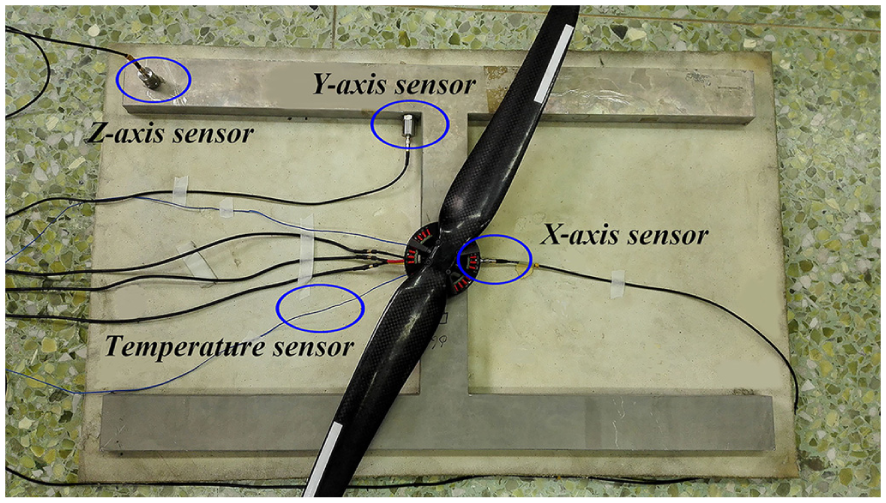
Experimental device.
Data analysis
We have collected all the signals in the whole process, in order to compare the motor’s vibration signals before and after a longtime running. The frequency of sampling is 2048 Hz, and the time length of each sample is 1 s. The time domain signals are shown in Figure 2. The results of EMD decomposition and instantaneous time–frequency spectrum are illustrated in Figures 3 and 4. According to Figures 2 and 3, it is found that the envelope of vibration signals before a longtime running is approximately sine. However, the envelope of vibration signals after a longtime running is uncertain. And in signals after, there is much more singularity than before a longtime running, and most of them are clear to identify in IMFs.

Time domain signals: (a) before and (b) after a longtime running.
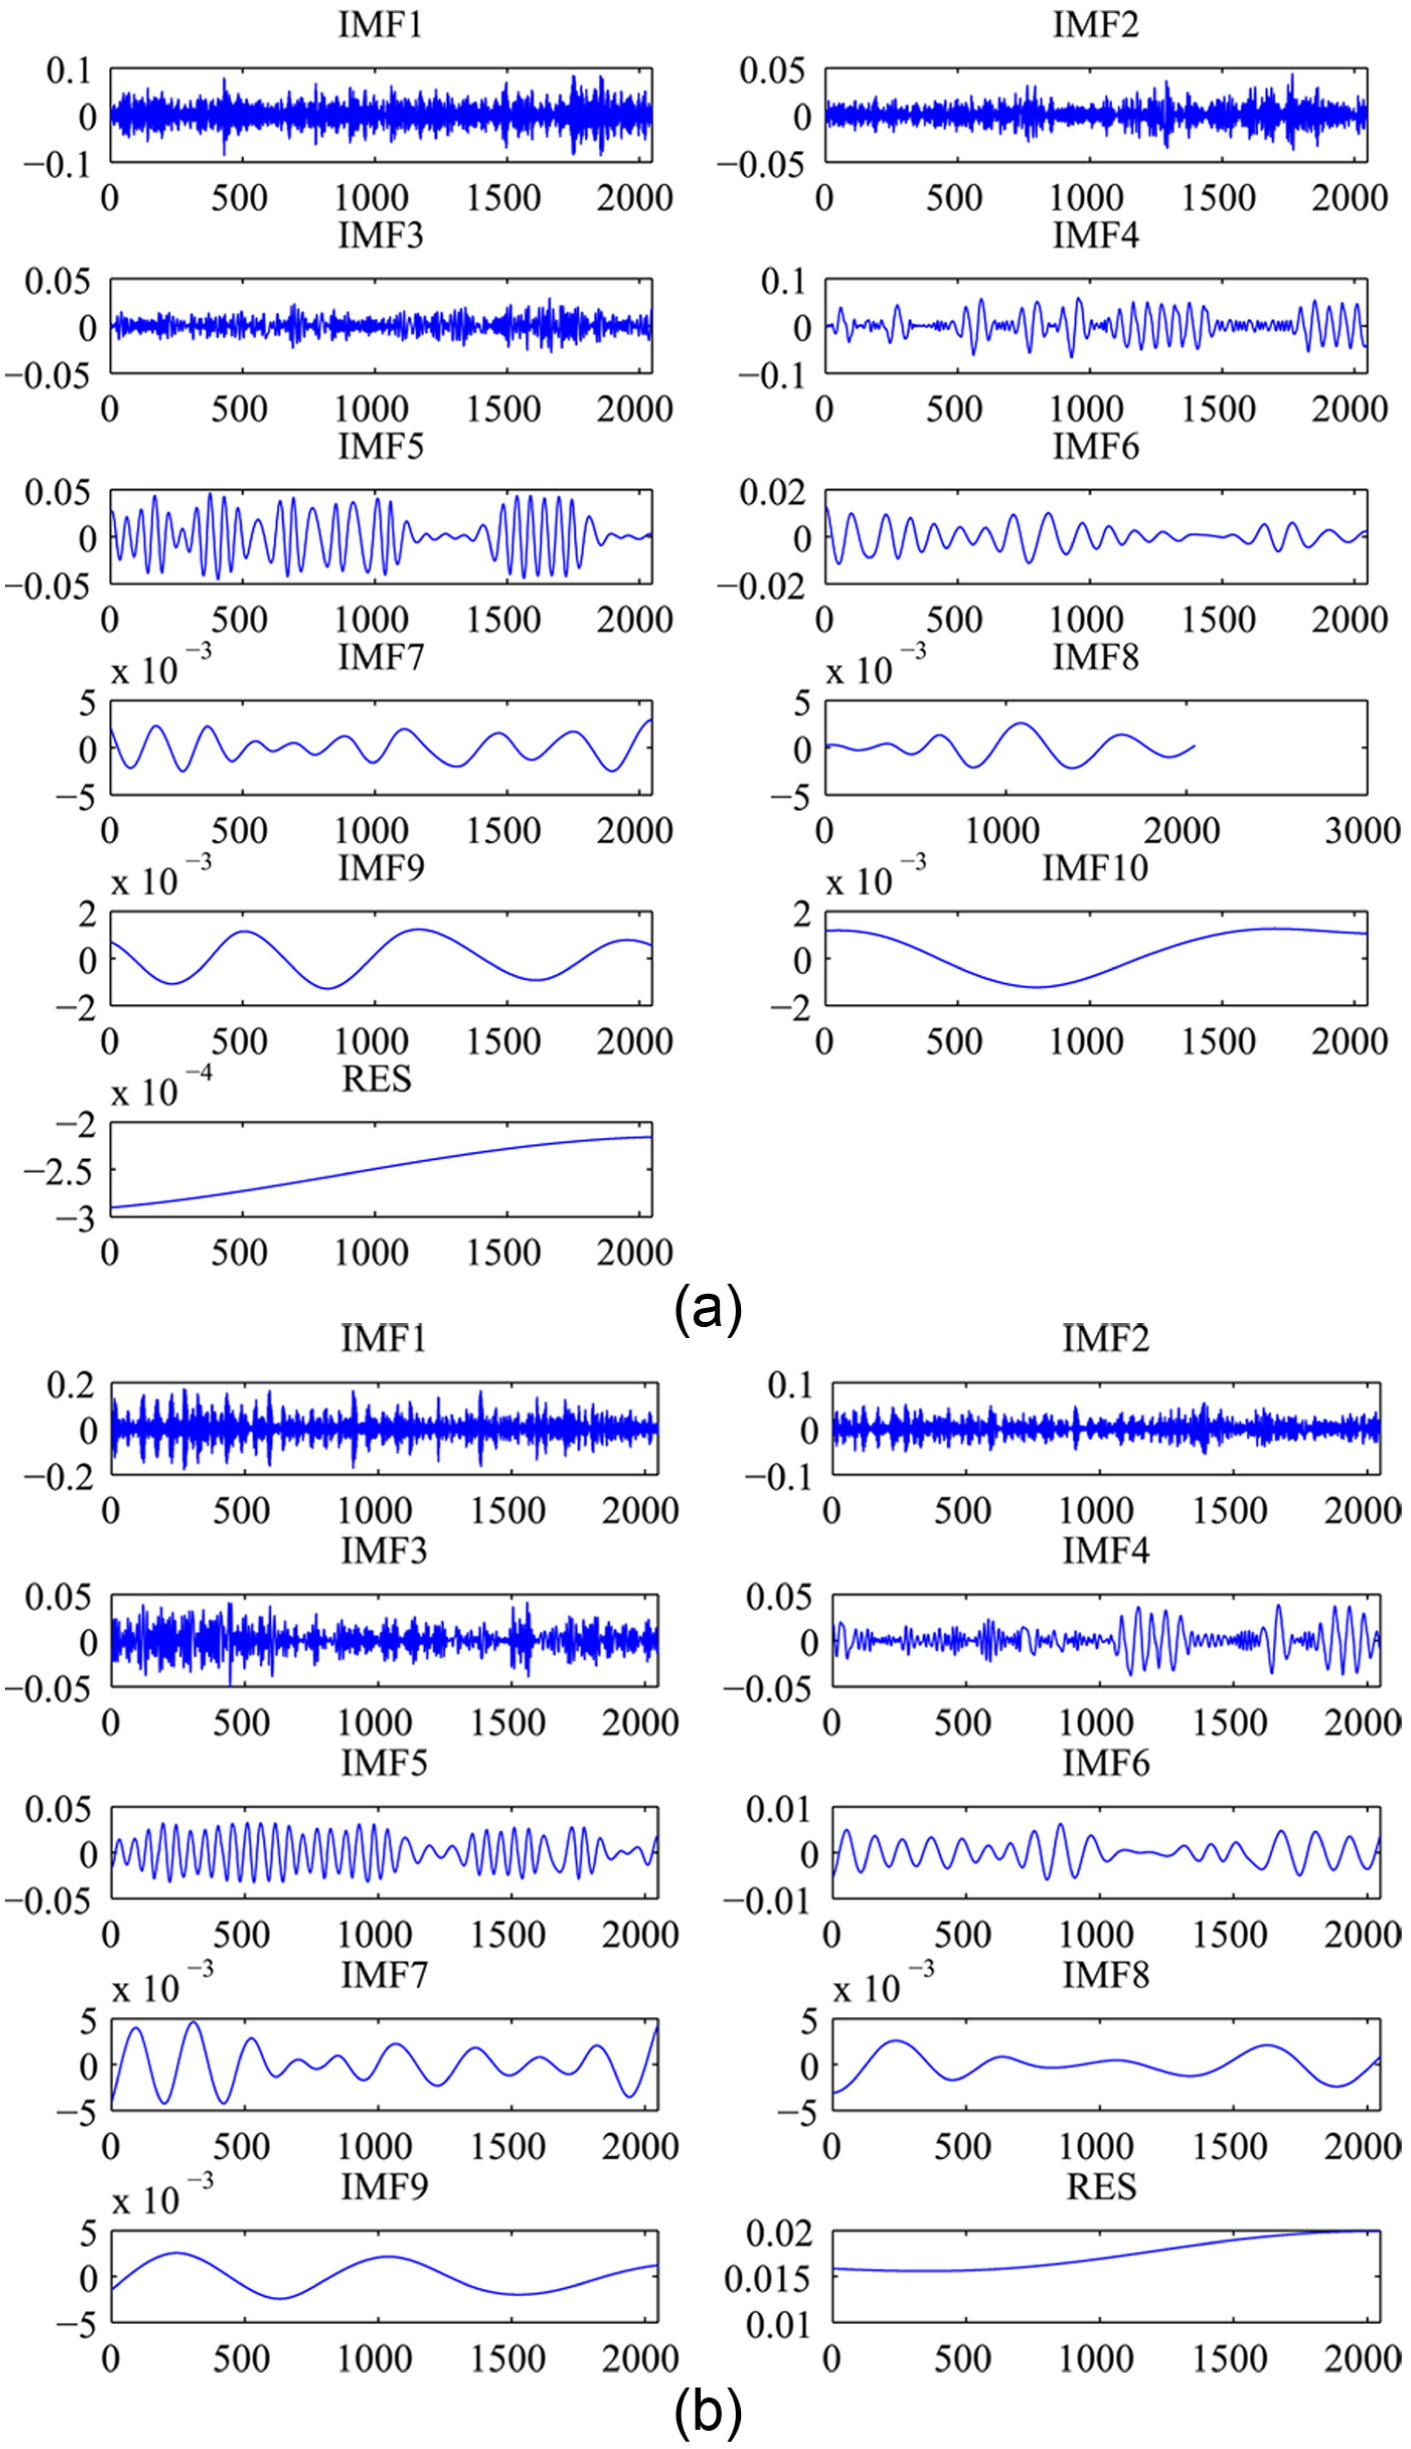
IMFs of signals: (a) before and (b) after a longtime running.

Time–frequency distribution of signals: (a) before and (b) after a longtime running.
Figure 4 indicates the following results:
The frequencies that vibration signal involves become comparatively discrete after the motor has been used for 350 h.
The distinctions between vibration signals collected before and after a longtime running are more severe in high frequency.
Comparison
In order to explore the causes of above results, we compared two vibration signal samples by HHT energy spectrum, which is shown in Figure 5.

Energy spectrum of signals: (a) before and (b) after a longtime running.
Figures 5 and 6 demonstrate the conclusions as follows:
The major component of the vibration signal is low-frequency sine in about 40 Hz.
The frequency domain of 600–1000 Hz is produced by noise.
The HHT energy spectrum demonstrates that the energy of low frequency declines, while the energy of high frequency increases.
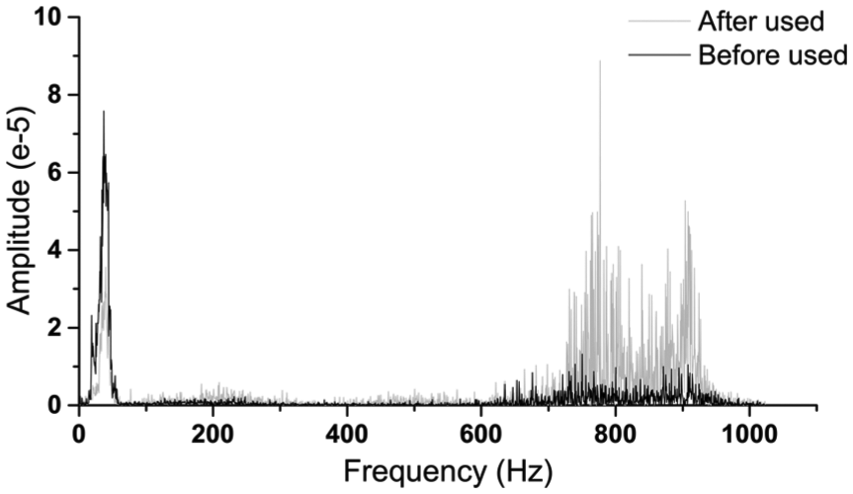
Comparison of energy spectrum of signals.
Two groups of samples are captured to avoid deviation caused by randomness. A total of 10 vibration signal samples are included in each group.

The energy matrixes are used to quantify the disparity between two groups of samples by Euclidean distance. Euclidean distance is the most common method applied in calculating distance, and it denotes the distance between two points in Euclidean spaces. For n dimensional vector

Figure 7 shows the distribution of Euclidean distance between samples collected before and after a longtime running. After operating for 350 h with rotor, the energy spectrum of vibration signals captured on BLDCM changes significantly. The frequency component correlated with rotating speed attenuates. And the increase in energy in high frequency is probably caused by oxidation, deformation, and fatigue of mechanical structure. To detect the degeneration, we scanned the surface of bearings before and after a longtime running by microscope and took pictures in 100 magnifications. As is shown in Figure 8, there are numbers of oxidation spots on the bearing used in motor after working for hundreds of hours. The growth of oxidation on the snap ring groove and surface of bearing affects the regular rotation, indicating that oxidation has influence on vibration signals. Correspondingly, vibration signals reflect the tiny weakness in mechanical structure.

Distribution of Euclidean distance.

Surface of bearing: (a) before and (b) after a longtime running.
Results
Based on the characteristics of time domain and time–frequency energy, we draw the following conclusions about the BLDCM:
Within the frequency range of 0–1024 Hz, two primary parts constitute the vibration signals of working BLDCM. One is low-frequency sine signal, which is consistent with the rotating speed. The other is high-frequency noise. The high-frequency noise evidently grows during operation, which reflects the degradation of mechanical structure.
Before a longtime running, the major component of signal energy is in low frequency as mentioned above, while the energy of noise enhances dramatically after working. According to the observation by microscope, it is mostly possible due to fatigue and oxidation, even deformation of mechanical structure.
This experiment demonstrates that HHT energy spectrum can be utilized to represent the changing performance of BLDCM during operation, and the characteristics of energy spectrum can be adopted to implement condition prediction and monitoring. However, the root causes of the variety reflecting on energy spectrum, and the quantitative relationship between vibration signal and the life, and the status of BLDCM still need to be studied, which will be our future work.
Footnotes
Academic Editor: Teen-Hang Meen
Declaration of conflicting interests
The author(s) declared no potential conflicts of interest with respect to the research, authorship, and/or publication of this article.
Funding
The author(s) received no financial support for the research, authorship, and/or publication of this article.