
Abstract
Current researches of hazard perception based on the conventional self-report, video scene, driving simulator experiments, and road studies all have their shortcomings. Accident interrogation record data not only have the benefits of the conventional self-report method (inexpensive and detailed), but also overcome the deficiencies of the self-report (impact of social desirability) to a great degree. In this article, the collision data, especially the accident interrogation record data on freeways in the City of Chongqing, China, are used to analyze the contributing factors to hazard perception, based on logistic regression and Cochran–Mantel–Haenszel test. The logistic method is used to study the correlation among these factors on hazard perception. In addition, the Cochran–Mantel–Haenszel test method is applied to factors that are not statistically significantly identified in logistic regression analysis. The results show that factors such as age, years of driving experience, gender, month, vehicle type, road alignment, and road surface have effects on hazard perception. The study results can be used to improve the drivers’ hazard perception abilities on freeways and can also help the highway administrators to formulate the related policies and regulations.
Keywords
Introduction
Drivers’ hazard perception is an ability to anticipate traffic situations, or to identify dangerous situations on roads, which has been regarded as an important aspect of explaining crashes or near-crashes. Drivers with strong hazard perception skills can reduce the probabilities of their involvement in collisions.
Hazard perception studies have been carried out widely by many researchers worldwide. They use self-reports, video scenes, driving simulators, and road studies for drivers’ hazard perception. The self-reporting method is simple and practical to study the hazard perception. It can test drivers’ hazard perception abilities and get contributing factors through the drivers’ self-description (e.g. questionnaires).1–5 However, it is a quite subjective method to evaluate the hazards, and it is mainly based on the respondents’ honesty and ability to give reasonably accurate and reliable answer, so there is an inevitable bias in the self-report analysis results. According to the social psychological research, 6 that bias is caused by the social desirability (mainly impression management). The video scene method is very popular in studying the hazard perception. The following steps are carried out using video scene experiments: eliciting subjective risk ratings from drivers in response to video scenes; assessing the types of hazardous situations identified by different groups of drivers; and having drivers perceive hazards in video footage and respond via button press.7–13 Simulator is an effective tool of hazard perception assessment. Based on the simulated traffic hazards, drivers’ hazard perception can be assessed and analyzed.14–20 However, drivers’ physical and psychological states are quite different during video scenes and simulator experiments relative to the scenes in real-world traffic. For example, drivers in video and simulator experiments do not have the realistic sense of risk, which may distort the research results. Road studies are a rising method to research the hazard perception recently.21–25 Although road studies can use objective data and make participants to have the sense of risk, the experiment environments of road studies cannot be controlled well (e.g. this method cannot present all the dangerous events). In addition, the cost of road studies is quite high when compared with other methods. On the whole, the self-report method encounters the impact of social desirability. Simulation and video scene methods cannot restore the real driving state. In road studies, experiment environments are difficult to control. And at most time, the desired traffic scenes are rarely encountered.
According to the above reviews, the self-report method has many advantages except for the subjective bias. If that bias is eliminated or reduced, the self-report method could be an economic and effective method to research the hazard perception. As known that, the subjective bias is mainly caused by the social desirability (mainly impression management). The source of self-report data is the principal factor to solve this problem. 3 The interrogation record of traffic polices is a very special kind of self-report, that is, after accidents the parties are required to demonstrate the accident details under the guidance of traffic police. Following are the characteristics of the accident interrogation record: First, in the interrogation records, almost all details of accidents are included. Second, the interrogation actions are in strictly private settings, which can reduce the impact of impression management to some extent. 3 Third, traffic police can supervise the self-report according to their investigation of the accidents (mainly based on road surveillance, accident reconstruction, etc.), which can further eliminate the impact of impression management. Therefore, the data of accident interrogation record from traffic police have special advantages to be used in hazard perception researches, which can overcome the deficiencies of the conventional self-report.
Based on the data of driver license, accident appraisal report, and the interrogation record of traffic police, this article combines the logistic regression method with the Cochran–Mantel–Haenszel (CMH) test to identify the main contributing factors associated with drivers’ hazard perception abilities on freeways. The collision data on freeways in the City of Chongqing, China, in 2012, were analyzed. First, the logistic regression method was used to analyze the relationship between contributing factors and hazard perception. Then, the CMH test method was applied to the statistically non-significant factors from logistic regression.
Study data and methodologies
In this study, we extracted 109 collision data on freeways in Chongqing, China in 2012 from three sources: driver licenses, accident appraisal reports, and the interrogation record of traffic police. The core questions of the interrogation record are shown in Table 1. In the interrogation actions, traffic police will ask questions to the parties regarding accident as shown in Table 1, and according to those questions, the parties will carry out the self-report about the accidents. In addition, the police will guide the parties’ self-report based on the information from other ways (road surveillance or accident reconstruction). Therefore, the self-report is quite reliable.
Questions of interrogation record by traffic police.

Collision data
In this article, the factors contributing to driver’s hazard perception abilities are studied. Those factors are classified into three categories: (1) driver-related factors including age, years of driving experience, and gender. The time and month of collisions, which may have effects on drivers’ physiological status, are also included in this category. (2) Vehicle-related factors including vehicle type and speed. The vehicle speed is inferred according to the description of parties. (3) Road-related factors including road alignment and road surface. Furthermore, the data of appraisal report and interrogation record have been validated by traffic polices, who compare them with other ways of information (road surveillance or accident reconstruction).
In summary, age, years of driving experience, gender, time, month, vehicle type, speed, road alignment, and road surface are factors to be studied in this article. From driver’s license, we can draw data such as driver’s age, years of driving experience, and gender. Combining the accident appraisal report with interrogation record, we can draw data of time, month, vehicle type, speed, road alignment, and road surface. Finally, we can judge or infer related information of drivers’ hazard perception characteristics through the information of interrogation record based on the rules as shown in Table 2.
Judging rules of collision types.

Drivers’ answers to #6 are classified into 0 (no hazards), 1 (transverse hazards), and 2 (longitudinal hazards).
Drivers’ answers to #10 are classified into 0 (nothing leads to drivers’ distraction) and 1 (something made drivers distraction).
Drivers’ answers to #12 are classified into 0 (shorter than dangerous following distance) and 1 (longer than dangerous following distance).
Drivers’ answers to #13 are classified into 0 (not perceiving hazards in time) and 1 (others).
Drivers’ answers to #14 are classified into 0 (almost taking no measures) and 1 (taking some measures).
In order to carry out the statistical analysis on the factors, the data were preprocessed. Collision reports were initially analyzed and coded by research assistants, who entered short descriptions of each factor along with the associated code. Then, these data were reviewed by the senior experts.
Driver’s age is classified into three groups: 1 (20–35 years old), 2 (35–50 years old), and 3 (50–65 years old). Driver’s gender has two codes: 1 refers to male and 2 refers to female.
In China, driving experience of 3 years is, in general, set up as the criterion to distinguish novice drivers and experienced drivers. 26 In other words, the drivers with 3 years or less driving experience are defined as novice drivers, and the drivers with more than that are treated as experienced drivers. In the study, novice drivers are coded as 1, and experienced drivers are coded as 2.
Time is classified into four groups: 1 (00:00–6:00), 2 (6:00–12:00), 3 (12:00–18:00), and 4 (18:00–24:00). Months are grouped as seasons. December, January, and February are coded as 1 (winter); March, April, and May are coded as 2 (spring); June, July, and August are coded as 3 (summer); and September, October, and November are coded as 4 (autumn).
Vehicle type is classified into three groups: 1 (light vehicle), 2 (medium vehicle), and 3 (heavy vehicle). Light vehicle refers to gross mass less than 6 ton, medium vehicle has gross mass of 6–14 ton, and heavy vehicle has gross mass of more than 14 ton. Speed data in the collision report were collected according to the description of parties.
The road alignment is classified into two groups: 1 (straight segments) and 2 (curves). The surface of road is classified into 1 (dry) and 2 (wet).
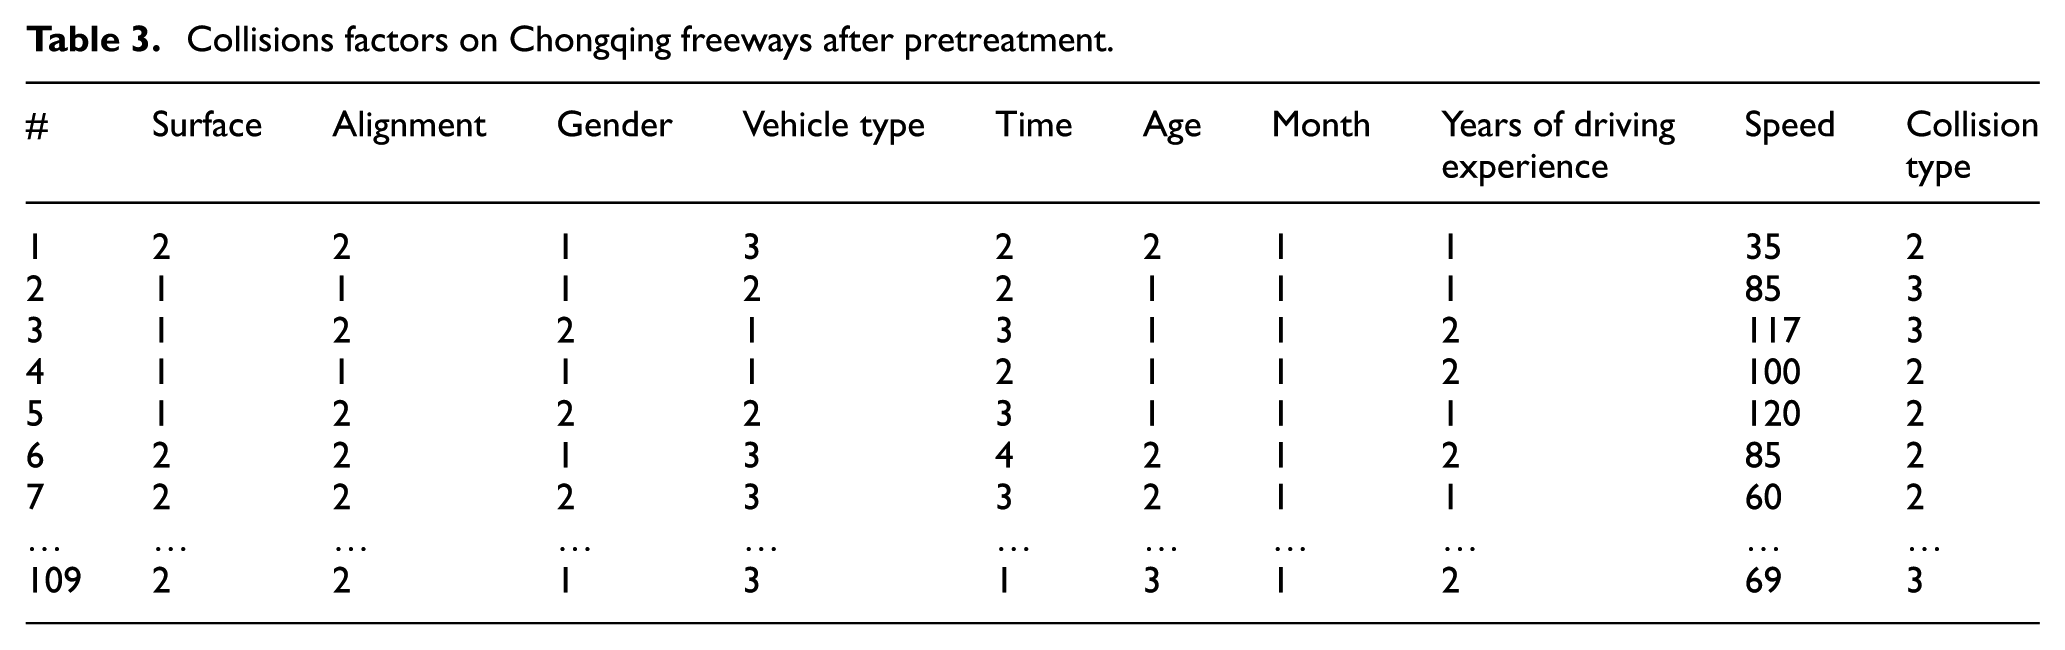
In the study, drivers’ hazard perception status is identified through the information of interrogation record. We mainly use drivers’ answer to Questions 6, 10, 12, 13, and 14 to get drivers’ hazard perception statuses during accidents. Hazards in collisions are classified into three groups: no hazards, transverse hazards, and longitudinal hazards. Longitudinal hazards refer to longitudinal dangerous events in collisions, for example, front vehicles carry out emergency braking. Transverse hazards refer to transverse dangerous events in collisions, for example, vehicles in adjacent lanes make change suddenly. No hazards represent that there is no prominent dangerous event in collisions. Collisions are coded as follows: 1 (no-hazard-perception collisions), 2 (transverse-hazard-perception collisions), and 3 (longitudinal-hazard-perception collisions). Transverse-hazard-perception collisions present accidents in which drivers did not get transverse hazards in time because of their poor hazard perception abilities. Longitudinal-hazard-perception collisions demonstrate accidents in which driver did not get longitudinal hazards in time because of their poor hazard perception abilities. All other accidents are in the category of no-hazard-perception collisions. In this article, collision types are identified through judging rules as shown in Table 2. After pretreatment, collisions factors on Chongqing freeways and their descriptive statistical results are shown in Tables 3 and 4, respectively.
Collisions factors on Chongqing freeways after pretreatment.
Description results of factors.

Methodologies
Previous studies had appropriately applied logistic regression methods to study road collisions. Binary logistic and multinomial logistic are the most popular logistic regression methods. The binary logistic regression is appropriate for the case when the dependent is a dichotomy (an event happened or not). Multinomial logistic is used in the analysis where dependents have more than two values. The dependent in this study is the type of hazard collisions, which has three types, so the multinomial logistic is chosen to analyze the data. The probabilities of hazard collisions are calculated as equations (1) and (2)


where P1 is the probability of no-hazard collisions; P2 is the probability of transverse-hazard collisions; P3 is the probability of longitudinal-hazard collisions; x1, x2, x3, x4, … are the independent factors (age, years of driving experience, gender, time, month, vehicle type, speed, road alignment, and road surface); α1 and α2 are intercepts; and β1, β2, β3, β4, … are regression coefficients.
CMH test allows the comparison of two groups on a dichotomous/categorical response. It is used when the effect of the explanatory variable on the response variable is influenced by controlled covariates. It is also often used in observational studies where random assignment of subjects to different treatments cannot be controlled, but influencing covariates can. In this article, some factors, influenced by other factors, have no significant results by logistic regression methods. In order to analyze those factors, CMH test, which can control interference factors, is used.
Logistic analysis
The multinomial logistical is used to analyze the relationship between hazard collisions and contributing factors. The dependent variable is the probabilities of hazard collisions, and independent variables such as speed, surface, alignment, gender, vehicle type, time, age, month, and years of driving experience are covariates.
Logistic analysis results
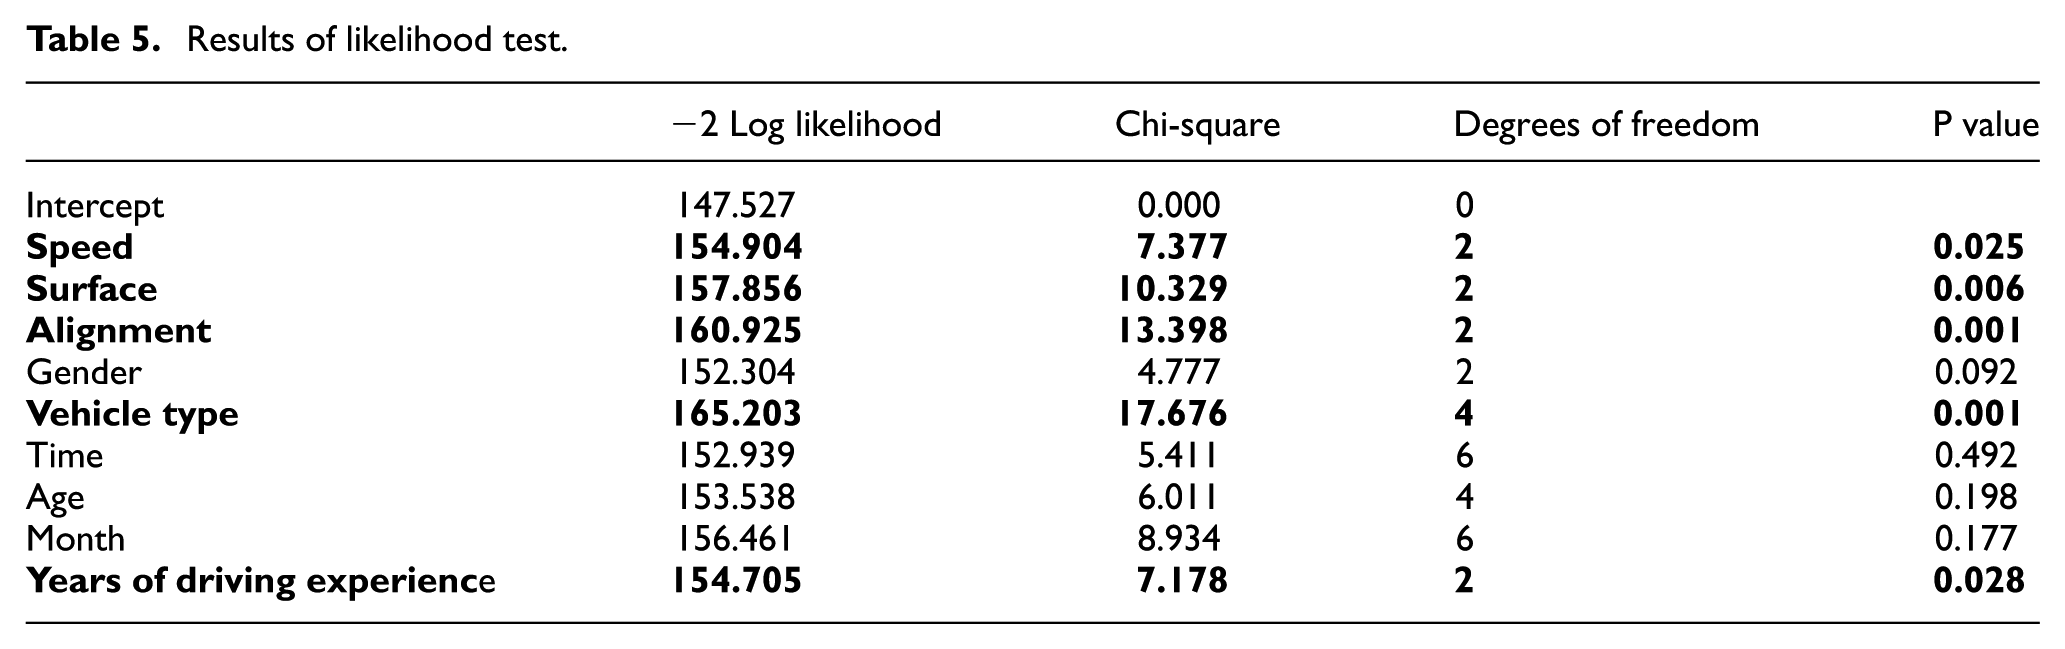
The results of likelihood test from logistical analysis are shown in Table 5. The factors such as speed, surface, alignment, vehicle type, and years of driving experience have significant impacts on the probabilities of hazard collisions, and factors such as gender, time, age, and month do not contribute to the probabilities of hazard collisions significantly. When P value is less than 0.05, there is a significant correlation between dependent variables and independent variables.
Results of likelihood test.
According to the likelihood test results, the logistical analysis results of significant factors on hazard collisions are listed in Table 6, where β represents the regression coefficients and P value refers to the significance of regression analysis. P values are obtained by wale test. When P value is less than 0.05, there is a significant correlation between dependent variables and independent variables. Odds ratio (OR) is equals to e β . In general, the probabilities of dependent variables increase along with OR values. The baseline of logistic regression is the probability of no-hazard collisions.
Results of logistical analysis.

Compared with no-hazard collision probabilities, Result 1 presents the logistic results for the transverse-hazard collisions. The results show that (1) the probability of transverse-hazard collisions decreases with vehicle speed, but the OR value is very close to 1 (OR = 0.936); (2) the probability of transverse-hazard collisions is higher on dry road than on wet road; (3) curves have higher probability of transverse-hazard collisions comparing with tangent section of road; (4) the lighter the vehicle is, the higher the probability of transverse-hazard collisions is; and (5) novice drivers are tend to be involved in transverse-hazard collisions than experienced drivers.
Compared with no-hazard collision probabilities, Result 2 lists the logistic results of longitudinal-hazard collisions The following conclusions can be drawn: (1) the probability of longitudinal-hazard collisions decreases with vehicle speed, but the OR value is quite close to 1 (OR = 0.944); (2) drivers on the dry pavement have higher probability of longitudinal-hazard collisions than on wet road surface, but the result is not statistically significant (P = 0.058); (3) tangent section of road has more risk of longitudinal-hazard collisions than curves, although the result is not statistically significant (P = 0.854); (4) light vehicle is more risky of longitudinal-hazard collisions than heavy vehicle; and (5) experienced drivers have lower probability of longitudinal-hazard collisions than novice drivers.
Discussions of logistic analysis
The OR values of speed are close to 1 both in Result 1 and Result 2 (Table 4), which indicate the effects of speed on probabilities of no-hazard, transverse-hazard, and longitudinal-hazard collisions are insignificant. A study by Aljanahi et al. 27 and Wang et al. 28 showed that higher speed would increase the risk of collisions. It is probably because speed equally increases the risk of no-hazard, transverse-hazard, and longitudinal-hazard collisions.
Wet pavement has less risk of transverse-hazard collisions than dry pavement, and it might be due to the more cautious driving in wet condition. 29 However, wet pavement’s effects on longitudinal-hazard collisions are not statistically significant, and that may be because of the powerfully negative impact of the wet surface on the vehicles’ longitudinal maneuverability (e.g. speed up and brake).
Curves have more risk of transverse-hazard collisions than straight segments. Previous study showed that drivers’ gazing points would move from the two sides of the road to the middle region in curves. 30 In addition, some transverse areas are invisible, which contributes to the risk of transverse-hazard collisions. Therefore, curves have negative effects on drivers’ abilities of transverse hazard perception, but their impacts on drivers’ abilities of longitudinal hazard perception are not significant.
Light vehicles have higher probability of longitudinal-hazard and transverse-hazard collisions. In other words, drivers in heavy vehicles have stronger ability of longitudinal and transverse hazard perception. Drivers in heavy vehicles have a further and wider vision. Further and wider visions make drivers receive more information ahead, which help drivers percept and deal with longitudinal and transverse hazards.
Novice drivers have higher probabilities of transverse-hazard collisions and longitudinal-hazard collisions than experienced drivers. It means that novice drivers have less ability of transverse hazard perception and longitudinal hazard perception. The previous study by Pradhan et al. 31 showed that novice drivers failed to look at critical elements on the road, and they scanned the road less widely than experienced drivers. 32 In addition, inexperience drivers tend to underestimate the potential hazard during driving because of their lacing similar driving experience. 33
CMH test analysis
Time, gender, month, and age are not significant factors in logistic regression results. The CMH test is used to investigate those factors’ relationship with hazard collisions. When vehicle types are controls, age and gender have significant CMH test results. When road surface conditions are controlled, month has a significant CMH test result. Time has no significant CMH results when other factors are controlled.
CMH test result
In the CMH test of age, collisions are classified by vehicle types. The cross-tabulation and test results are shown in Tables 7 and 8, respectively. Table 8 shows that age is a significant factor on hazard collisions for the drivers of light vehicles. Table 7 shows that 20- to 35-year-old drivers have the most transverse-hazard and longitudinal-hazard collisions, 35- to 50-year-old drivers have the most transverse-hazard collisions, and 50- to 65-year-old drivers have the most no-hazard collisions.
Cross-tabulation of age, hazard collisions, and vehicle type.

CMH test of age.

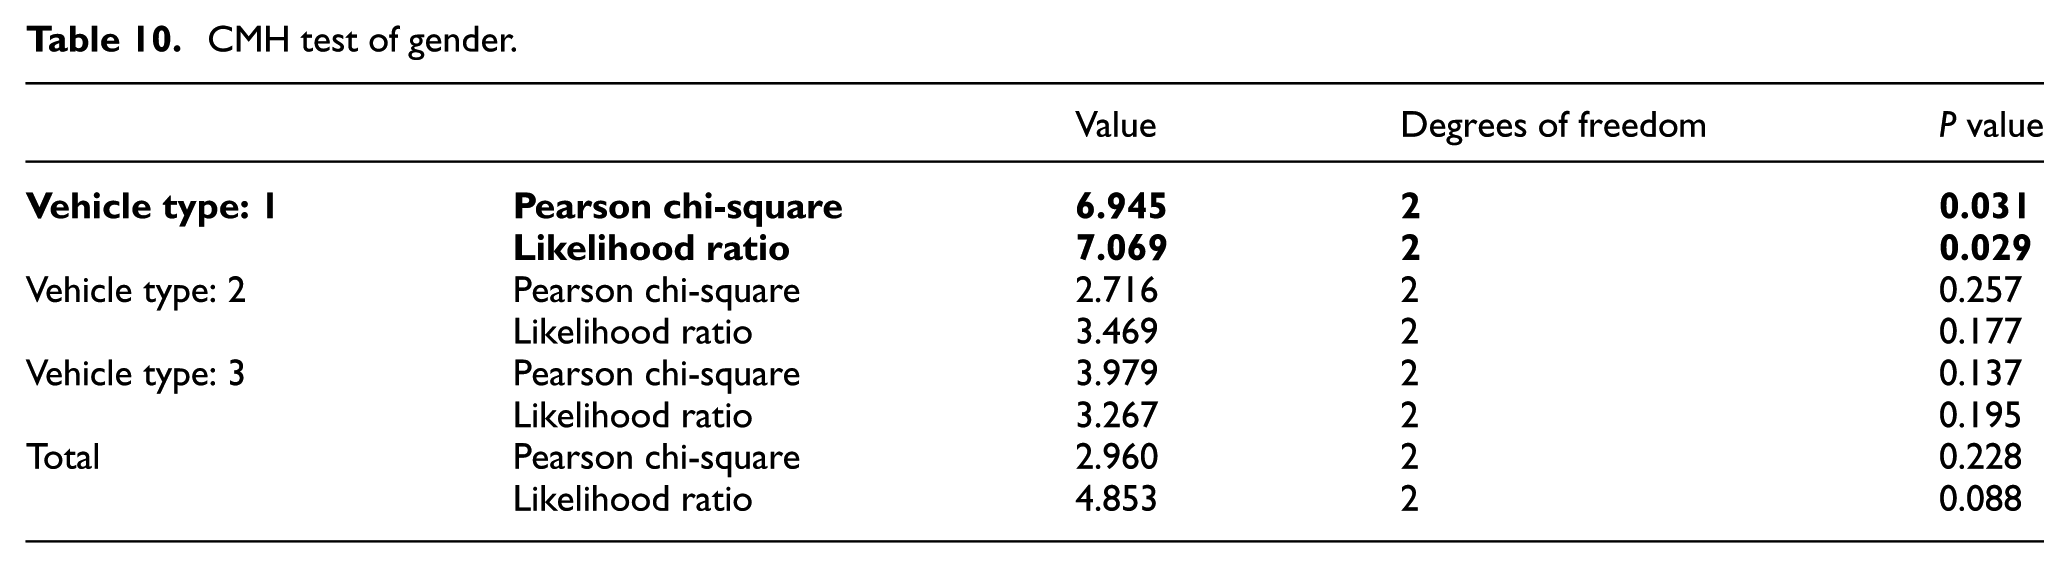
Similarly, collisions are classified by vehicle types in the CMH test of gender. The cross-tabulation and test results are shown in Tables 9 and 10, respectively. Gender is a significant factor on hazard collisions for drivers of light vehicles. Table 9 shows that male drivers have the most transverse-hazard collisions and female drivers have the most longitudinal-hazard collisions in the light vehicle involved collisions.
Cross-tabulation of gender, hazard collisions, and vehicle type.

CMH test of gender.
Month is also examined in the CMH test, and collisions are classified by road surface conditions. The cross-tabulation and test results are shown in Tables 11 and 12, respectively. Month is a significant factor on hazard collisions when road surface is wet. Table 12 shows that winter has the most transverse-hazard collisions, and spring, summer, and autumn have the most no-hazard collisions.
Cross-tabulation of month, hazard collisions, and surface.

CMH test of month.

Discussions of CMH test results
Age is not significant in the logistic regression. When the vehicle type is controlled, the CMH test indicates that age is significant. The test results show that there is a significant difference in hazard collisions among different ages for light vehicle collisions. Among the light vehicle collisions, 20- to 35-year-old drivers tend to have longitudinal-hazard and transverse-hazard collisions; 35- to 50-year-old drivers tend to have transverse-hazard collisions; and 50- to 65-year-old drivers tend to have no-hazard collisions, which indicate young drivers’ abilities of hazard perception are weaker than old drivers’. In traditional researches, drivers are generally classified into three categories: young-inexperienced, experienced, and old. In that case, some studies found that young-inexperienced and old drivers present different characteristics in accidents or near-accidents. The former is because of their poor skills of detecting hazard and insensitivity to potentially hazardous locations. And the latter is mainly due to the age-related limitations (e.g. physical, visual).
In this article, factors of age and driving experience are studied separately. In the result of the age factor analysis, it seems nothing special for young drivers because their tendency of longitudinal-hazard and transverse-hazard collisions is the same. For the middle age and old drivers, it shows that the old drivers tend to have no-hazard collisions. That is because in old drivers’ opinions, they can detect hazard timely, but their age-related limitation (e.g. slow reaction) may lead to the driving risk. Furthermore, most of the drivers in the groups of old and middle age are experienced drivers, so the effects of driving experience can be largely eliminated. Therefore, the gap between middle age and old is caused by the age-related limitation.
Gender is not significant in the logistic regression analysis; however, the CMH test indicates that gender is significant when the vehicle type is controlled. The test results show that there is a significant difference between male and female drivers in light vehicle hazard collisions. Male drivers tend to have transverse-hazard and female drivers tend to have longitudinal-hazard collisions. Male drivers have weak transverse hazard perception and female drivers have weak longitudinal hazard perception abilities. However, Wetton et al. 34 found that there was no difference in hazard perception between male and female drivers as their study did not distinguish transverse hazards from longitudinal hazards.
Month has no significant impact on hazard perception in the logistic regression. The CMH test indicates that month is significant when the road surface is a control variable. According to the test results, there is a significant difference in hazard collisions between spring, summer, autumn, and winter on wet roads. Winter tends to have more transverse-hazard collisions; spring, summer, and autumn tend to have no-hazard collisions.
Conclusion and recommendations
For reducing the effects of the subjective bias using the conventional self-report method, the accident interrogation record data are used to study the hazard perception. The conventional self-report has many advantages except for the subjective bias (mainly due to social desirability). In this article, the accident interrogation record data are used to research the hazard perception, which not only has the benefits of the self-report method (inexpensive and detailed measure), but also can overcome the deficiencies of self-reports (impact of social desirability) to a great degree. This study analyzes the real collision data on freeways in Chongqing, China, and the contributing factors on hazard perception are investigated. The logistic regression is combined with the CMH test to analyze the collision data. The following conclusions are drawn in this study:
Although high speed increases the risk of collisions, its impacts on longitudinal hazard perception and transverse hazard perception are almost equal.
Wet pavement can enhance the drivers’ ability of transverse hazard perception effectively due to more caution and less traffic flow, and its influence on longitudinal hazard perception is unknown because of the interference caused by variance of vehicles’ longitudinal maneuverability between wet surface and dry surface. Curves have negative effects on drivers’ ability of transverse hazard perception, but their effects on drivers’ ability of longitudinal hazard perception are not significant.
For heavy vehicles, the drivers with further and wider visions of roads have stronger abilities of hazard perception than on light vehicles. On light vehicles, old drivers tend to have no-hazard collisions which may be caused by their age-related limitation (e.g. slow reaction). Moreover, male drivers on light vehicles have weak transverse hazard perception, while female drivers have weak longitudinal hazard perception ability. It is different compared to previous studies.
In winter, drivers tend to have weak transverse hazard perception ability on wet roads, and it was rarely studied before. The cause of that is unknown in this study.
Novice drivers have weaker abilities of transverse hazard perception and longitudinal hazard perception than experienced drivers because of their poor skills of recognizing hazard and low sensitivity to potentially hazardous locations.
How to reduce the effect of subjective bias (mainly due to social desirability) on conventional self-report methods makes a great difference in hazard perception researches. In this article, the accident interrogation record data are used to research the hazard perception, which, to a great degree, can overcome deficiencies of the self-report method (impact of social desirability). Although interrogation records are very commonly employed by traffic police after accidents, this kind of data was rarely used in researches before. This article provided a method to carry out the hazard perception researches based on interrogation record data.
Then, the results in this article show that some factors (i.e. age, years of driving experience, etc.) have effects on hazard perception. In most cases, their effects on longitudinal hazard perception and transverse hazard perception are different, which were ignored by many researches before. According to those hazard perception characteristics, improved ways of training drivers’ hazard perception abilities and more targeted policies on freeways can be come up with. For example, the results show that male drivers on light vehicles have weak transverse hazard perception abilities. In that case, more transverse risky traffic scenes can be used to train male drivers on light vehicles in order to enhance their safety skills for transverse hazard.
However, there still exist some limitations in this study. First, because of the lack of data, the gender analysis results with a small number of female drivers may be distorted. Second, only collision crashes on mountainous freeways are analyzed in this study; thus, collisions on other traffic contexts including urban and rural roads should be further analyzed in order to fully understand the drivers’ hazard perception under different scenarios. Especially, the collisions in urban roads, which may have the most complicated traffic scenes, will be focused on in the future researches. It is also important to investigate the driver behaviors after perceiving hazards in the future. Even with the limitations above, this method based on accident interrogation record data is appropriate to most traffic scenes.
Footnotes
Academic Editor: Anand Thite
Declaration of conflicting interests
The author(s) declared no potential conflicts of interest with respect to the research, authorship, and/or publication of this article.
Funding
The author(s) disclosed receipt of the following financial support for the research, authorship, and/or publication of this article: This study is sponsored by the National Key Technology R&D Program (2014BAG01B03), and the National Natural Science Foundation of China (51675390). Special thanks go to China Automotive Engineering Research Institute in Chongqing for providing the collision data on mountainous freeways and the project funding.