
Abstract
This article experimentally investigates the buckling strength of carbon fiber–reinforced polymer laminates. Samples were made with 16 layers of carbon fibers in four orientations of 0°, 30°, 60°, and 90°. Nano silica (SiO2) and nano clay were used as fillers for enhancement of the buckling strength of carbon fiber–reinforced polymer laminates. The Taguchi method was used for design of experiments and optimizing the three input factors: nano silica, nano organoclay, and carbon fiber orientation. From the results, first, it was found that the most buckling strength belonged to the samples with the fiber orientation of 0° and the minimum strength belonged to the composite laminates with the 90° orientation of carbon fiber. Second, the use of two nano fillers in quaternary laminates (epoxy/carbon fiber/silica/clay) has increased the buckling strength of laminates about 45.5% and 22.5% in comparison with binary and ternary laminates, respectively. The binary laminates were made from carbon fiber/epoxy resin and the ternary laminates included carbon fiber/clay/epoxy. Third, the elastic modulus of laminates increased with an increase in the nano SiO2 content. The most effective parameters according to the analysis of variance results were as follows: carbon fiber orientation, nano silica, and nano organoclay, with a probability value of 99%, 95%, and 90%, respectively. Finally, the analytical analysis was done according to the classical laminated plate theory for obtaining the buckling force and verifying and comparing the results with experimental buckling tests. The results obtained from classical laminated plate theory for two certain laminates were in excellent agreement with those obtained from experimental results.
Introduction
Polymer–matrix composites reinforced with carbon fiber (CF) have been extensively used in new engineering industries such as aerospace, automotive, ship, military, and civil structures because of their extraordinary mechanical properties.1–4 High toughness and high strength in spite of their low weight and thickness are characteristics of carbon fiber–reinforced polymers (CFRPs). 5 The composite polymers based on epoxy resin are widely used because of superior mechanical and chemical properties of epoxy, but the epoxy resins are brittle in nature.6–8 For solving this problem, CFRPs are used to increase the mechanical properties of this type of composites. CFs as reinforcement in macro size distribute the stresses into the interface of polymer and filler in compressive status. 9 R Medina et al. 10 used a series of composites with varying amounts of zirconia nanoparticles and studied their mechanical properties. The scanning electron microscopy (SEM) analysis of the composites showed homogeneous distribution of the nanoparticles into the matrix bulk uniformly and the tensile modulus (E) of the epoxy matrix increases at rising zirconia content more than 37%.
However, the nanoparticles, such as carbon nanotube (CNT), clay, and alumina oxide (Al2O3) are mostly used as reinforcement elements in laminated composites to increase the mechanical properties.11–13 For this purpose, during the production process, the nanoparticles are added to a certain amount of resin. The effect of nanoparticles is related to their size or content (wt%). 14 In addition, the use of two nano fillers at the same time in hybrid composites has opened a new window for researchers in order to enhance mechanical properties. Inam et al. 15 used CNT and CF to enhance the mechanical properties of hybrid micro-nanocomposite laminates which were made by a resin infusion method. The results showed that adding a small amount of CNT (0.1 wt%) to epoxy had an improvement of 35%, 5%, and 6% in flexural modulus, flexural strength, and absorbed impact energy, respectively. MF Uddin and CT Sun 16 used nano silica to enhance the mechanical properties of glass fiber/epoxy composites, and the results showed an improvement of about 40% in Young’s modulus of the composites in comparison with the neat glass/epoxy composites, and the compressive and tensile strength increased significantly.
Low weight and thin thickness despite high strength are the main aim of using these types of laminated composite structures, but these structures in beam form and thin plates, especially in aerospace structures, such as wing and fuselage panels, and civil structures, are prone to buckling under compressive load.17,18 In the last decades, many researchers have focused on the buckling to overcome this serious problem in laminated composite structures. Hybrid nanocomposite laminates are one of the new and superior laminated structures that have high strength and mechanical properties and also thin thickness and low weight at the same time.
M Sayer 19 used nano silica and nano boron carbide to glass/epoxy composites. The results indicate that the load-carrying capability of composites is significantly influenced by particle weight fractions, different particle sizes, and different ceramic particles. Accordingly, the load-carrying capabilities of composites filled with 10 wt% ceramic particles are found to be higher for small particle sizes. Moreover, the addition of 10 wt% boron carbide (B4C) particles to composites increases the critical buckling force up to 42%.
The buckling strength of CFRP depends on various parameters such as CF orientation, layer numbers, and the properties of reinforcement.20–22 It is important and essential to control many affective parameters for making the hybrid nanocomposite laminates in order to reach the better and optimized samples that they are resistant to buckle. The Taguchi method is one of the famous statistical methods that uses three important parameters for optimization: signal-to-noise ratio (S/N), orthogonal arrays, and analysis of variance (ANOVA). 23 E Kuram et al. 24 used the Taguchi method to optimize and investigate the effect of injection and recycling parameters as input-controlled factors on the mechanical properties of glass fiber–reinforced nylon 6.
The Taguchi method uses a number of orthogonal arrays based on the condition control factors and levels that help to investigate all the parameters with only a minimum number of experiments that leads to low cost and time. 25 Furthermore, the S/N ratio was calculated which is the logarithmic function used to measure the performance of desired output. 26 The S/N ratio is chosen based on three characteristics: smaller-the-better, nominal-the-better, and larger-the-better. Also, the process parameter with the highest S/N ratio continually yields the optimum quality with lowest variance. In this study, the S/N ratio “Larger-the-better” is chosen according to the buckling strength responses and is defined as27,28

where yi is the measured results for biosorption efficiency and n represents the number of repetitions under the same experimental conditions.23,29
According to this ratio, the larger response is better, so the S/N ratio becomes larger. To evaluate the effect of input factors in final response, ANOVA can be done. 23 The ANOVA evaluates the effect and importance of each parameter on the results and shows the most effective factor by comparing the variance between parameters. The Taguchi method is widely used in many sciences, such as medicine and engineering. One of the usual methods for optimization in engineering is preparing the hybrid nanocomposites according to the Taguchi orthogonal array that also reduces the experiment numbers. In recent years, several researchers have extensively used this experimental design method to optimize specific parameters in the various industrial fields. 30 Balak and Zakeri 31 used the Taguchi L32 orthogonal array design for optimizing the flexural strength of ZrB2-based composites prepared by spark plasma sintering. Prakash et al. 32 used the Taguchi method to optimize the strength of kaolin-reinforced epoxy composites.
In this research, the Taguchi orthogonal array (L16) was used for design of experiments, preparation of the hybrid nanocomposite laminates, and optimization of the buckling force. This array (L16) is shown in Table 2. The CF orientation and weight percentage of nano clay and silica will be selected as controllable input parameters and effect of these parameters on buckling strength will be considered. Also, the SEM pictures will be used to investigate the structural and morphological mechanism of new hybrid nanocomposite. In addition, the synergistic effect of nanoparticles (silica/clay) will be investigated by ANOVA in quaternary hybrid laminates (epoxy/CF/silica/clay), and finally, it will be compared with binary (epoxy/CF) and ternary hybrid (epoxy/CF/clay) laminates.
Experimental section
Details of materials
The nano and macro fillers and matrix were as follows. The nano silica was purchased from the Tecnan Company with the size of 10–15 nm. The nano organoclay used for this test was Cloisite 30B type and purchased from Southern Clay Products (Gonzales, TX, USA). The unidirectional type of CF (T700-12K) was used for this research and was purchased from Toray Company. Epoxy resin matrix (Epon 828) was used in this research as an undiluted clear difunctional bisphenol A, provided by Shell Chemicals Co. with molecular weight ∼370, epoxide equivalent weight 185–192 g/equiv, and viscosity 10,000–16,000 cps. The epoxy systems were cured with a cyclic aliphatic polyamine (Aradur® 42) supplied by Huntsman Co. The epoxy matrix systems were cured with a curing agent with a nominally cycloaliphatic polyamine, Aradur 42 with equivalent weight of 50.7 g/equiv, and supplied by Huntsman Co.
Characterization
The dimensions of the samples were 140 mm × 12 mm × 4.8 mm (length × width × thickness) when cut with electric saw. The buckling tests were done by applying an axial compressive load using ASTM D6641 standard with the loading rate of 1 mm/min. The ASTM-150 universal testing machine (Iranian SANTAM Co.) was used for measuring the buckling test results. All the experiments were done at room temperature, and at least five samples were prepared for test to obtain the standard deviation and mean values. The values of buckling loads of laminates were obtained experimentally and were calculated from the force–displacement plot of each test. The initial point of the load–deflection curve deviated from the straight line, which represents the critical buckling load at that point. 23 It should be considered that at the beginning of buckling, the elongation occurs without applying any force. Figure 1 indicates the buckling steps of a laminate sample in the buckling test machine.

The buckling steps of laminate under compression load.
Samples preparation
The laminated composite samples used for buckling test had 16 layers, and also, each laminate had different fiber orientations that was designed and prepared according to the Taguchi design method. All the laminate samples were hand laid-up and prepared in specific steps. First, the CFs were cut with blade in four directions of 0°, 30°, 60°, and 90° of fiber orientation for making the laminates after making the matrix. In order to make the matrix, the resin epoxy was mixed with certain amount of nano SiO2 and clay, according to the Taguchi method, and mixed well with mechanical stirrer for 2 h with 2000 r/min and then put in ultrasonic homogenizer suit (ultrasonic SONOPLUS-HD3200, 50% amplitude, 20 kHz, and pulsation; ON for 10 s and OFF for 3 s) for 8 min to avoid agglomeration of nano materials and making homogeneous mixture. In the next step of preparing the matrix system, a hardener (cycloaliphatic polyamine) was added to the epoxy matrix, with the ratio of 23 phr (per hundred resins). For removing the probable air bubbles, the matrix mixture was degassed by vacuum pumps. The hand lay-up method was used for preparing all the samples and then cured at room temperature for a day, and finally, the post-curing was done from 20°C to 140°C for every 2 h with 20°C temperature enhancement interval on a programmable electrical oven. Figure 2 shows a laminated composite structure used in this study, where Zn is the distance from the mid-plane to the nth layer.
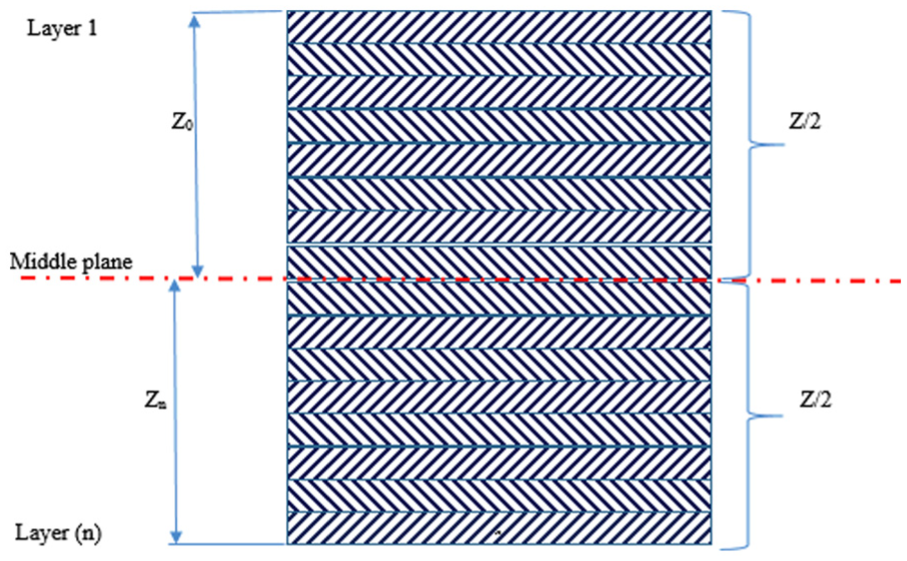
The laminate structure with (±θ) plies.
Design of experiment
The design of current experiment was based on the Taguchi method. The Taguchi method is a useful and well-known approach for obtaining and determining the best combination of input parameters to optimize the objective function(s) with minimum number of experiments. 27 It is possible to identify non-significant variables by the Taguchi method. 33 This method is based on an orthogonal array of experiments. An orthogonal array is a minimal set of experiments with various combinations of parameter levels. The output of the orthogonal array, which indicates the relative influences of various parameters on the formation of the desired product, is used to optimize an objective function. There are three types of objective functions: larger-the-better, smaller-the-better, and nominal-the-best. 26 The influences are commonly referred in terms of S/N ratio. The input parameters of experiments, designed by the Taguchi orthogonal arrays, give the optimum results according to the function described above. 33 The Taguchi method is quite different than usual engineering approaches and has many preferences because this method uses special groups of orthogonal arrays for design of experiments that minimize the costs and number of tests. 29 The effect of each parameter (main effect) can be explained simultaneously in the Taguchi method. The Taguchi method uses the arrays (L16 in this article) to select the optimum condition of input control factors, so the effect of the uncontrollable factors (NOISE) on the results becomes minimum. ANOVA identifies the content of each input variable and was used to determine the control parameters effect on the buckling strength of the laminated composites.12,34 One of the most important steps in the Taguchi design is selecting the controllable factors. In this study, the three controllable parameters, as told above, were selected according to Table 1 to optimize the input parameters to achieve the highest buckling strength of new quaternary nanocomposite. The three input parameters were designed according to the L16 Taguchi orthogonal array (Table 2). According to this table, the three input factors with the four levels were selected to design and reduce the experiment numbers.
Description of factors and their levels for the Taguchi experimental design.

L16 orthogonal array used for experimental design.

Fiber orientation.
Clay content.
SiO2 content.
The maximum buckling force values obtained from the selected experiments were set as the responses in designed table and then the results of the buckling experiments were analyzed and optimized by Minitab software according to the S/N ratio and ANOVA. 23
Numerical analysis of the buckling strength
In this research, a numerical solution was obtained to evaluate the buckling force according to the classical laminated plate theory (CLPT). The CLPT is suitable for thin cross-ply laminates and used to investigate the analytical and numerical solution. 17 The obtained buckling force from theory was compared with experimental results to verify the buckling test.
In this section of research, four samples were prepared to obtain the elastic properties of laminated composites. For this purpose, the laminates with 0°, ±45°, ±60°, and 90° of CF orientations were selected and prepared with equal materials according to the desired values of L16 array. Table 3 shows the elastic properties of selected samples, including E1, E2, G12, and V12. In this table, E1 is the longitudinal modulus of unidirectional laminate (0°) and the E2 is the transverse modulus of unidirectional laminate (90°) that were obtained from the buckling test. G12 and V12 are the shear modulus and Poisson’s ratio and of composite, respectively. 35 Poisson’s ratio was obtained from the tensile test done by testing machine and measured by biaxial video extensometer. The shear modulus (G12) was obtained from equation (2).19,23,36 According to this equation, the Ex is the elasticity modulus of the laminate with CF orientation of ±45° that was obtained from the tensile test 37

Elasticity properties of tested laminate.

The elements of the stiffness matrices of composite (


where C is Cos (θ), S is Sin (θ), and θ is the angle from the X axis to the fiber axis.
23

In the last step, the buckling force of composite was calculated using equation (6)23,40

where the
For each composite laminate, nine values of buckling force were obtained according to equation (6), which are shown in Table 4. The minimum value of each table is our expected value of buckling force.23,38 Now, all the numerical solutions are calculated step by step as shown below.
The buckling load obtained from classic laminate theories for i and j = (1, 2, 3).

From equation (3) the stiffness matrix is obtained as

The stiffness matrix

Accordingly, the stiffness matrix for laminate with fiber orientation of 90° is obtained as below

The bending stiffness matrix
The bending stiffness matrix for laminates with fiber orientation of 0° is

And the bending stiffness matrix for laminates with fiber orientation of 90° is

As described above and by substituting i and j with 1, 2, and 3 in equation (6), nine answers will be obtained for the buckling force of each laminate. 23 Also, the minimum answer is the final buckling force value. The buckling force obtained for the composite laminate with fiber orientation of 0° is

And for laminate with CF orientation of 90°, the critical load was obtained as

In this step, the comparison between the buckling force obtained from experiment and numerical solution was done. The buckling force obtained from the experimental tests was about 1809 and 285 N for laminates of 0° and 90°, respectively, that were close to the numerical values (1360 and 218 N).
Results and discussion
S/N ratio analyses for optimization of quaternary nanocomposite
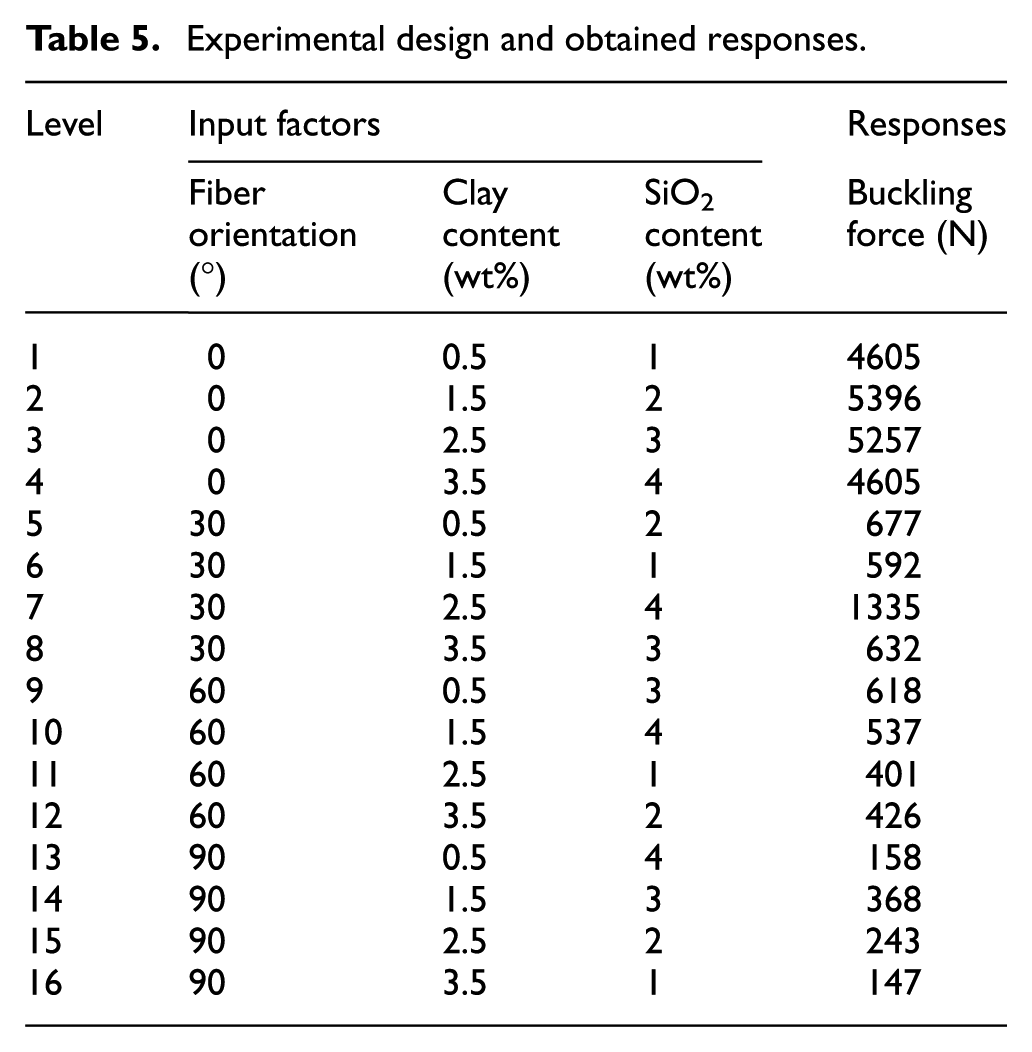
In this research, the effect of CF orientation (as macro filler), nano silica, and nano clay (as nano filler) on buckling strength of new hybrid composite was investigated. The Taguchi method was used to design and optimize the experiments. The buckling force obtained from the experiments was analyzed and evaluated by Minitab software according to L16 orthogonal array. Table 5 shows the buckling force obtained from the tests. It was seen that the best answer was 5396 N and occurred at level 2. Also, the minimum buckling force occurred at level 16 with the value of 147 N. The aim of this research is enhancement of the buckling strength of the laminates, so the larger response is the desired answer according to the Taguchi method with the use of S/N ratio as defined in equation (1).23,34 The S/N ratio in the Taguchi method is measured by the deviation of a characteristic from its target value (Figure 3). 25
Experimental design and obtained responses.

The S/N ratios.
ANOVA
Table 6 shows the ANOVA results for S/N ratio. These results are based on the confidence level (α = 0.05) and the effect of each input parameter that identified by its probability value (p). 25 According to these parameters, the effective input factors should have p ≥ 95% (α ≤ 0.05) and the input factors with p-value less than 95% (α ≥ 0.05) have less effect. 23 According to the results of Minitab software, it was seen that the probability value of the CF orientation and nano silica is more than 99% and 95%, respectively. Among all the input control parameters, it was seen that the orientation of CF is the most effective parameter on buckling strength of composite. This value for nano clay is about 90%, so it has less effect than CF orientation and nano silica.
Analysis of variance.

Seq. SS: sequential sum of squares; Adj. SS: adjusted sum of squares; Adj. MS: adjusted mean squares; DF: degrees of freedom.
R2 = 97.8%.
Main effect of input factors
The main effect of each input parameter on buckling strength was shown in Figure 4. It can be obtained that the increase in fiber orientation had the inverse effect on strength of composite so the buckling strength was increased with the decrease in the fiber orientation. It means that the composites with the fiber orientation of 0° had the best strength. This manner can be explained by the load direction and CF orientation that when the load direction applies at the same direction of fibers, most stress was transferred by the filaments of the fibers, so in this position the minimum stress occurred in composite laminates. This behavior is shown in Figure 5 that shows the SEM picture of composite laminated and CF orientation. According to Figure 4, it was seen that the most rate of response change belonged to the direction of the CF, and this parameter is more effective than other factors on increase in composite buckling strength. According to Figure 4, it was seen that the critical buckling load increases with an increase in nano SiO2 to 3 wt%, and at the higher content of nano silica, the strength decreased significantly (more than 3 wt%). This can be explained by the interaction effect between nano silica and matrix structures that the nanoparticles fill the matrix bulk and encumbers the entanglements of the molecular chains of resin and make a strong bonding with epoxy resin matrix at low content of nano silica, 41 but when the content of nano silica particles exceeds more than 3 wt%, the additional particles created a rough surface structure and poor matrix adhesion of epoxy composite, which makes the structure brittle.12,42 The results of main effect parameters show an increase in buckling strength with an increase in nano clay content to 1.5 wt%, but it was observed that when the content of nano clay exceeds from this value (more than 1.5 wt%), the buckling strength decreased gently. It can be explained by the geometrical structure of clay that is platelet and can create a strong chemical bonding with the resin epoxy matrix in less content of nano clay, but when the clay particles increase, the nano clay particles have more tendency to be agglomerated and when this phenomenon occurs, it decreases the strength of the nanocomposite laminates with higher clay contents.23,34,42–44Figure 6 shows this interaction between clay and resin epoxy by SEM. The other affected important factor in the strength of laminated composites is elastic modulus that plays a strong role in buckling strength of samples in this article. Table 7 shows the obtained elastic modulus. It was seen that in the laminates with fiber orientation of 0°, the value of modulus is more than the others and in this laminates, the epoxy matrix have less effect on the modulus and distribution of stress and strength of samples.23,45 However, the elastic modulus of the laminated composites increased by increasing the SiO2 and clay content to 3 and 1.5 wt%.

Main effect.
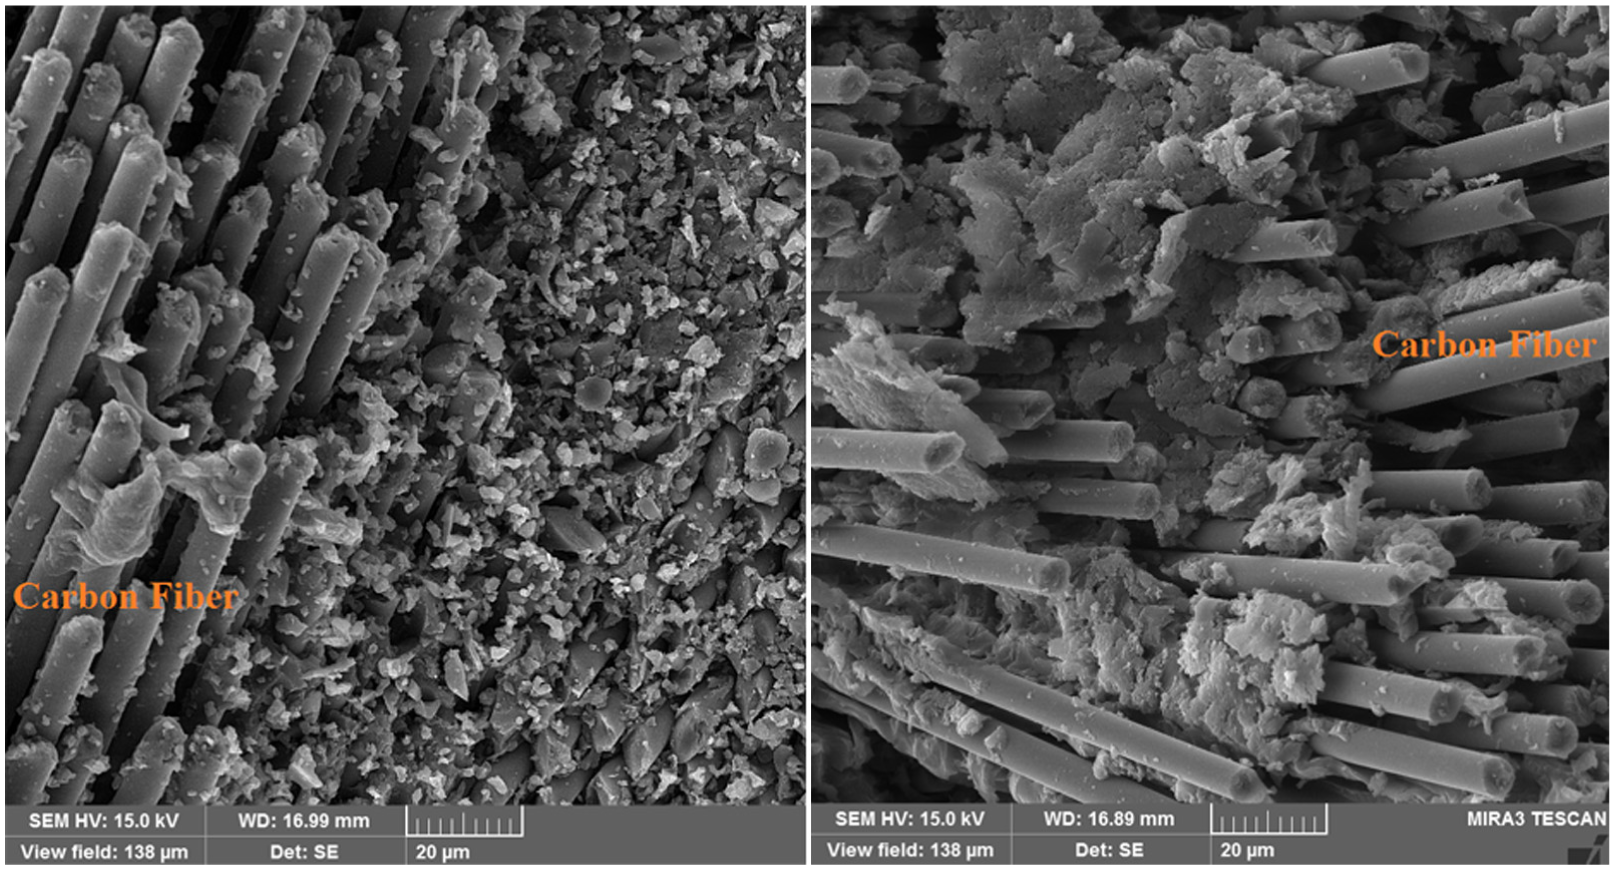
Scanning electron micrograph of the fracture surface and carbon fiber orientation.

Scanning electron micrograph of the fracture surface showing clay.
The elastic modulus as long of peak.

Normal probability plot of S/N ratio
The normal probability plot of S/N ratio is shown in Figure 7. This plot checks whether the distribution of residuals is normal or not, according to the dots around the straight line. 46 According to the obtained plot in Figure 7, it can be seen that most of the data (dots) are distributed close to the straight line, so the results of the analyses were normally acceptable and had a good distribution. 23

Normal probability plot of S/N ratio.
Three-dimensional surfaces and two-dimensional contour plots
Three-dimensional (3D) surface plot is used to find a relation between three input variables at once and also uses interpolation to produce a continuous surface and also shows them with a 3D picture. The two-dimensional (2D) contour plot represents the effect of two input parameters on the X–Y axis that each axis represents the input variable and shows it with a 2D view. 47 In this article, these two plots were used to identify the relation between three input factors (CF orientation, clay, SiO2) and buckling strength of composite laminates. According to these plots, the optimized regions can be observed, which shows that in this region the results are optimized and the contents of the input parameters can be obtained.23,42
Effect of CF orientation and nano clay content
In this section, the effect of each two independent input factors (fiber orientation and clay) on the buckling strength were investigated according to the 2D and 3D surface plots (Figure 8). According to these plots, it can be observed that the best response of buckling strength is in the region that the level of CF orientation is 1 and level of clay is between 2 and 3. It means, when the orientation of CF is at 0° and the content of nano clay is about 1.5–2.5 wt%, the response is optimized. In addition, in upper levels, the buckling strength decreased.

(a) 3D plot and (b) contour plot of the effect of carbon fiber and nano clay on buckling strength.
Effect of SiO2 content and CF orientation
Figure 9(a) and (b) shows the 3D surface and 2D contour plots of nano SiO2 and CF orientation. According to these plots, it can be seen that the optimized region belongs to level 1 of CF orientation and levels 2–3 of nano SiO2 that is similar to the results of clay-CF orientation in the previous section. Figure 9(a) shows that when the nano silica content and CF orientation increased simultaneously, the critical buckling load of the laminates decreased; however, the effect of increasing the levels of fiber orientation and silica content on buckling strength is inverse. When the level of fiber orientation was minimum (level 1) and the level of silica was maximum (level 3), the best result was obtained. It can be obtained that the interaction between the SiO2 and fiber orientations was a significant parameter in buckling response. The problem of the reducing buckling strength at upper levels of CF orientation was solved by adding nano silica partly.

(a) 3D plot and (b) contour plot of the effect of carbon fiber and nano silica on buckling strength.
Effect of nano fillers on buckling of hybrid nanocomposite
In this section, the effect of nano clay and nano SiO2 content on the results will be investigated by 2D and 3D surface plots (Figure 10). According to these plots, there are two optimized regions that represent the synergistic effect of nano fillers. The first synergistic effect occurred at level 2 of clay and SiO2 that the buckling strength value was more than 5000 N. In this optimized region (level 2), the contents of clay and silica are 1 and 2 wt%, respectively. However, beyond this area, the buckling strength decreased, but in the other areas between levels 3 and 4, the second synergistic effect occurred, so the buckling force increased, and then, at level 4, the magnitude of the buckling strength decreased gently. According to this section, it can be concluded that among the three input control parameters, the orientation of the CFs had the greatest effect on the buckling strength of laminates. Also, the content of nano SiO2 was more effective parameter to increase the elastic modulus of laminated composite in comparison with nano clay and also the use of two nano fillers simultaneously leads to synergistic effect.

(a) 3D plot and (b) contour plot of the effect of nano clay and nano silica on buckling strength.
The effect of nano fillers on the results at a fixed level of CF orientation according to the force–extension plot
Figure 11(a)–(d) shows the effect of clay and SiO2 contents on the buckling strength at four various degrees of fiber orientation (0°, 30°, 60°, and 90°). For this purpose, the laminates with the same fiber orientation were selected and the effects of nano silica and clay content in four levels were investigated. Each part of these figures shows the effect of nanoparticles at different levels on buckling force. According to these plots, it was obtained that in all four samples with certain fiber orientation, the nano silica and nano clay contents were effective parameters that improved the buckling strength.

The effect of nano silica and nano clay on buckling strength of laminates: (a) carbon fiber orientation = 0°, (b) carbon fiber orientation = 30°, (c) carbon fiber orientation = 60°, and carbon fiber orientation = 90°.
Relation between buckling strength of composite laminates and CF orientation
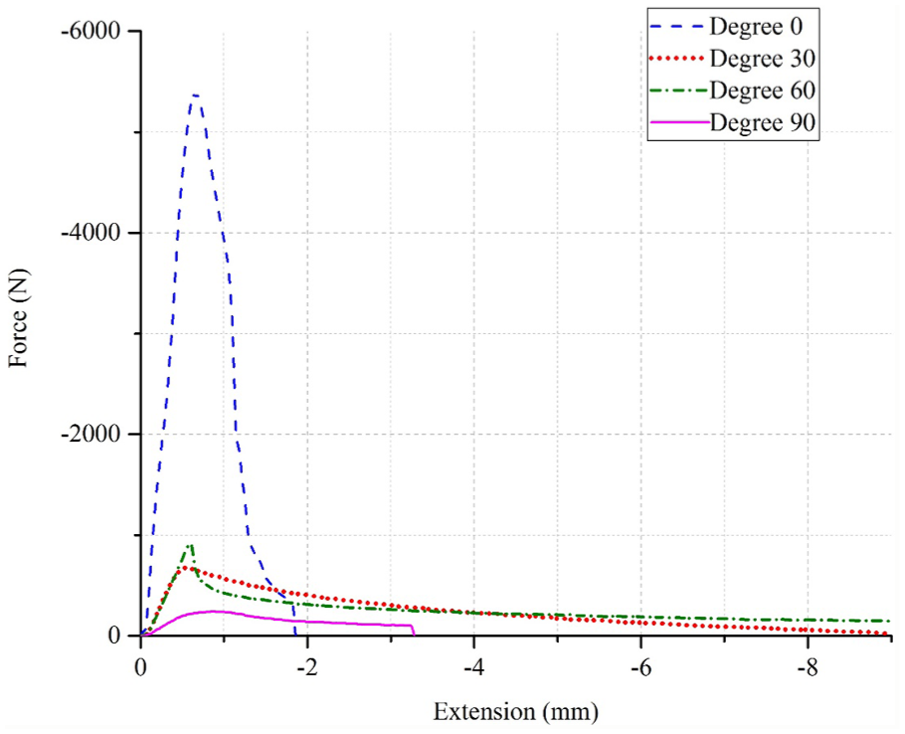
Comparison between four different fiber orientations and the effect of layers direction on the results of buckling strength was investigated in this section. For this purpose, the optimized results of buckling tests of each level in 0°, 30°, 60°, and 90° were selected and shown in Figure 12. According to this plot, it is easy to compare the optimized answers and a significant decrease was observed from level 1 to level 4 and the most decline occurred at levels 1 and 2. The orientation of the CF was dominant input factors, and as expected, the composite laminates with 0° orientation plies had the highest strength in comparison with the other laminates because the axial forces and the CFs are in the same direction that leads the stress to the matrix interface. Table 7 shows the values of elastic modulus of composite laminates in all 16 levels. According to this table, it is obvious that the elastic modulus of laminated composite with fiber orientation of zero (level 1) is larger than the other three levels. More elongation belonged to the laminates with fiber orientations of 30° and 60°, and the minimum buckling strength belonged to the laminates with fiber orientation of 90°. This difference in modulus value can be described by the direction of the CF layers and elastic modulus of laminates. According to Table 7, Young’s modulus was reduced by increasing the level (increasing the fiber orientation), so the strength of composite laminate will be reduced. The important notice was the improvement in buckling strength of laminates with fiber orientation of 90° by adding nano silica and nano clay at the same time, that in level 3 of nano silica (3 wt%) and level 2 of nano clay (1 wt%), the elastic modulus increased to 2040 MPa. Figure 13 shows the difference in buckling strength of composite laminates under compressive loads with four various fiber orientations (0°, 30°, 60°, and 90°).
The effect of fiber orientation on buckling strength.
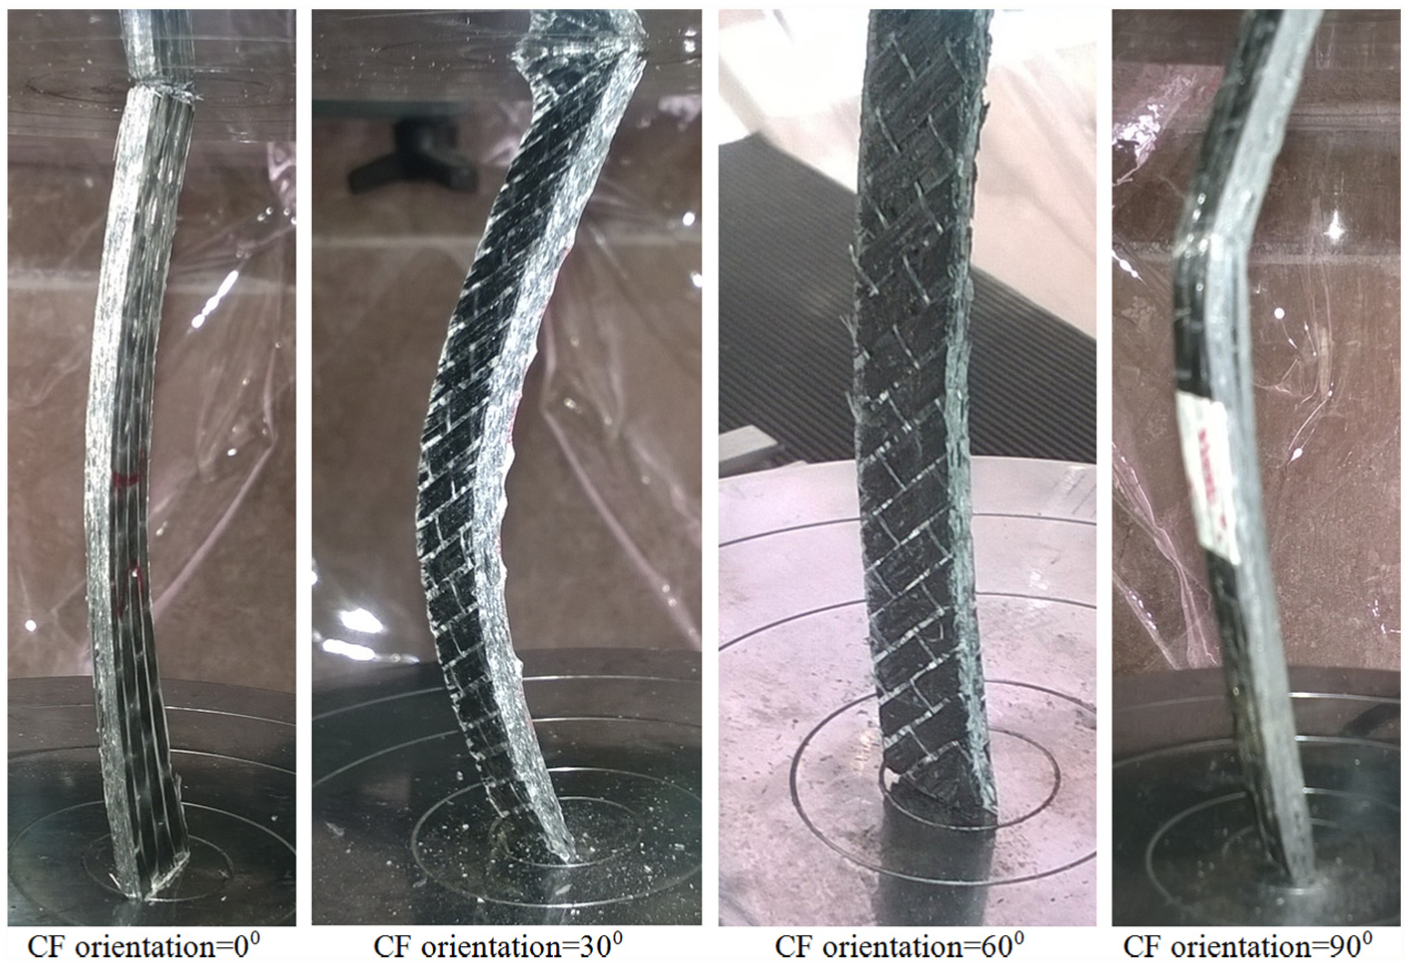
Comparison of the buckling strength of the laminates with fiber orientation of 0°, 30°, 60°, and 90°.
Nano fillers and synergistic effect
In this section, the synergistic effect of simultaneous use of nano clay and silica on the buckling strength of composite laminates was investigated. For this purpose, the binary (CF/epoxy) composite sample, ternary (CF/epoxy/clay), and quaternary hybrid nanocomposite samples were made and tested. Figure 14 shows the results of buckling test of these three composite laminates. According to Figure 14, it was seen that the buckling strength of quaternary hybrid nanocomposite increased about 45.3% and 22.5% compared with the binary and ternary composites, respectively. Also, for laminates with the CF orientation of 60°, at level 3 of nano silica and level 1 of nano clay, the synergistic effect occurred and the elastic modulus increased magnificently (Table 7).

Force–extension plot for comparison of binary (epoxy/CF), ternary (epoxy/CF/clay), and quaternary (epoxy/CF/clay/SiO2) laminates.
Conclusion
In this article, the effect of three control parameters including clay, silica (as nano fillers), and orientation of CFs (as a macro filler) on the buckling strength of the new hybrid nanocomposite was investigated. The design of experiments was based on the Taguchi method with L16 array for analysis of variance and optimizing the results. The buckling test results were set to the Minitab software for analyzing with the Taguchi method. According to the ANOVA and 3D plots obtained from the Minitab software, the CF orientation was the dominant parameter and had the most effect on the strength of composite laminates. The effect of nano materials as nano fillers was specified by comparison of the neat composite or binary with the ternary and quaternary composites. It shows that the use of nano silica with 3 wt% and nano clay with 1 wt% simultaneously had a good synergistic effect on the enhancement of quaternary composite. The synergistic effect of CF and nano materials was obtained and shown according to the 2D contour and 3D surface plots. Also, according to the probability plot of residual, an excellent dispersion of collected result was observed to identify the suitable design of experiment.
The force–displacement plots of compressive buckling tests were investigated based on different levels of input parameters, and the results showed that the laminates with the 0° fiber orientation had the most buckling strength. Also, an increase in the content of nano silica increased the elastic modulus of composite laminates. The SEM showed the good enclosing of the CFs by the resin epoxy matrix and also good interaction between nano clay and SiO2 with epoxy matrix and good distribution of nanoparticles on the matrix increased the mechanical properties of the laminated composite. Also, two laminate samples were selected for calculating and comparing the buckling strength in two analytical solutions, and the results obtained using experimental method were similar.
Footnotes
Academic Editor: Xichun Luo
Declaration of conflicting interests
The author(s) declared no potential conflicts of interest with respect to the research, authorship, and/or publication of this article.
Funding
The author(s) received no financial support for the research, authorship, and/or publication of this article.