
Abstract
The impact of sphere against the beam is one of the basic impact problems in flexible mechanical dynamics. A flexible steel beam supported at the two ends struck by a steel sphere was tested in this article. Multiple sub-impacts were observed during the falling impact process of the steel sphere. The test contact–impact durations of the sub-impacts were compared with that of the theoretic results derived from the Hertz contact law. It is confirmed that the Hertz contact law is still suitable to estimate the impact–contact duration of the first sub-impact. The difference between the test impact–contact durations of the subsequent sub-impacts and that of the theoretic results was explained theoretically by a revised impact theory in consideration of beam’s vibration. The occurrence reason of the sub-impact was systematically discussed. It is concluded in this investigation that the sub-impacts are dominated by local contact–impact deformation, but influenced obviously by the global vibration of the flexible structure. When the sub-impacts occur, the coefficient of restitution shows strong uncertainty.
Keywords
Introduction
The impact plays an important role in engineering applications and it is one of the fundamental matters in applied mechanics research. There have been an impressive number of publications that focus on experimental and theoretical impact problems.1–6 In order to design a structure or machine element which is directly subjected to the impact, it is essential to be able to predict its response accurately under such impact. So it is also significant to investigate the impact velocity, impact position, contact–impact duration, and deformation during impact, because they determine the structural response of impact bodies after the impact.
The impacts of the beams have been investigated widely from experimental, numerical, and theoretical perspectives, since they can be recognized as one of the primitive mechanical impacts. So far, many of the beam impacts have been reported.1–9
However, Mason 7 showed that an impact which appeared single to our naked eyes consisted of several sub-impacts in quick succession. The existence of this phenomenon has been shown mathematically by Timoshenko. 1 An array of scientific minds have contributed to the numerical and experimental studies of the sub-impact field.5–19 It was found that the contact–impact duration of the sub-impact is much shorter and more sensitive to structural transient responses. 19 In addition, the neighboring sub-impacts may influence each other, and the high-order vibration excited by the sub-impacts can in turn affect the sub-impact process itself. 19 In the light of the recent developments in the area, the sub-impacts were believed occasionally to be caused by the strong structural vibrations of the beam 15 or the relative motions between the bodies in contact. 11 But there were less experimental evidences assessing the validity of the above-mentioned hypothesis.
Goldsmith 20 remarked that the sub-impact phenomenon is a peculiar characteristic of the impacts involving flexible systems, however, the previous research works were focused on the observation of the sub-impact phenomenon, and a comprehensive study of the sub-impact phenomenon was seldom conducted before. As the sub-impact is a very important component of the entire impact process, and the study of the sub-impact is helpful for deeply understanding the mechanical essence of impact problems. So, if the sub-impact occurs in the process of steel sphere falling on beam, and this impact event can be used as a good example to investigate the mechanism of the sub-impact.
For these reasons, an in-depth investigation of the sub-impact of a flexible steel beam supported at the two ends struck by a steel sphere was presented. Especially, the contact–impact duration of the sub-impact was focused on, because it is important to understand the essence of the sub-impact. To this end, the impact–contact duration of the sub-impact was measured precisely by the sub-impact measurement circuit specially designed and was compared with that of the theoretic results derived from Hertz contact law. The difference between them was explained theoretically by a revised impact theory with consideration of beam’s vibration. In addition, the coefficients of restitutions were calculated, and the occurrence reason of the sub-impact was systematically discussed.
Experimental setup
An impact experiment model as shown in Figure 1 was conducted, in which a steel sphere with a radius of curvature R traveling at velocity v0 strikes a beam of finite length 2L and thickness h. Figure 2 shows an experimental setup specially designed for the impact experiment.

Impact model in experiment.

Schematic of sub-impact experiment equipment.
The experimental setup is composed of a steel sphere, beam, guide sleeve, bearing plate, laser holder, base plate, two clamp holders, and support columns. Two metal clamp holders were used to support the beam. The metal clamp holder consists of the clamping plates and footholds. The semicircle grooves were machined at both ends of the beam. By assembling the semi-convex columns to the semicircle grooves, the upper and down clamping plates clamp both ends of the beam. The upper and down clamping plates were connected to the screws and supported by the footholds. The footholds were fixed on the base plate. The metal clamp holders allow small rotation at both ends of the beam. The laser holder was used to fix laser displacement sensor.
The steel sphere of 70 mm diameter was used for the experiment. The sphere was made of Gr15 stainless steel with density of ρ1 = 7800 kg/m3, Young’s modulus E1 = 208 GPa, Poisson’s ratio µ1 = 0.33, and mass m1 = 1.4008 kg. The beam has a square cross section of b × h = 60 × 27.8 (mm2) and a length of 2L = 780 mm. The beam used Q345 steel with density of ρ2 = 7850 kg/m3, Young’s modulus E2 = 206 GPa, Poisson’s ratio µ2 = 0.3, yield stress σs = 345 MPa, And mass m2 = 10.2132 kg. The guide sleeve allows us to adjust the dropping height H0 to change the initial impact velocity v0 of the sphere. The initial impact velocity v0 of the sphere in tests is varied from 1.39 to 2.66 m/s. By moving the guide sleeve along the bearing plate, the impact position can adjust. The impact position in the center of the beam was labeled as position A. The impact positions of 130 and 260 mm from the center of the beam were labeled as positions B and C, respectively.
In order to measure the sub-impact and the beam’s response, an impact test system was designed and its schematic diagram is shown in Figure 3. The impact test system consists of a sub-impact measure circuit, a laser displacement sensor, and two strain gauge pairs ST1 and ST2 which are mounted 260 and 130 mm from the left support end respectively.

Schematic diagram of impact test system.
The sub-impact measure circuit was specially designed to precisely measure the numbers of sub-impacts and the impact–contact duration of each sub-impact. It consists of an alkaline battery, a resistance of 120 Ω, and some light wires. One end of the sub-impact measure circuit is connected to the steel sphere and another end is connected to the beam. The sub-impact measure circuit will interconnect and output a non-zero voltage signal when the sphere and beam are in contact. It will disconnect and output a zero voltage signal when the sphere and beam are in separation. The sub-impact measure circuit can quickly capture contact and separation behavior in the impact process.
A laser displacement sensor (Microtrak II) with a precision of 0.1 µm is installed in the laser holder to measure the signal of beam displacement. The laser is aimed at the under face of the beam aligned with the contact point as shown in Figure 4. Because the beam displacement of the contact point cannot be measured directly, it can be instead measured by the beam displacement of the laser measure point. According to our numerical calculation results using the dynamic finite-element software LS-DYNA, the displacements of the impact point and the laser measure point have almost identical values when the local deformation of the beam was excluded.

Test site.
The output of the strain gauge is amplified by a strain amplifier (DH2842), digitized, and stored. The signals of contact–impact voltage, strain, and displacement were measured by the data acquisition instrument (DH5939) with sample frequency of 1 MHz, and then output to the PC. The high-speed camera (NAC GX-3) capable of capturing up to 198,000 frames/s is used to capture the motion image of the steel sphere.
Impact response
Displacement response
The entire processes of dropping a steel sphere at 27 different heights and three impact positions to impact a steel beam were tested. Some typical experimental results of the beam displacement histories in the first 50 ms are shown in Figure 5. In Figure 5(a), the beam displacement histories corresponding to five different initial impact velocities of the sphere at position A were found to be similar except for their respective amplitudes, which were observed to be increased with the initial impact velocities of the sphere. In Figure 5(b), it can be observed that the impact at position A results in a maximum displacement of 0.97961 mm, while for impact positions B and C, the maximum displacements are 0.84351 and 0.37842 mm, respectively. For impact position C, the high-frequency displacement response becomes more obvious.

Displacement histories of the beam: (a) at position A and (b) at positions A, B, and C.
Stress response
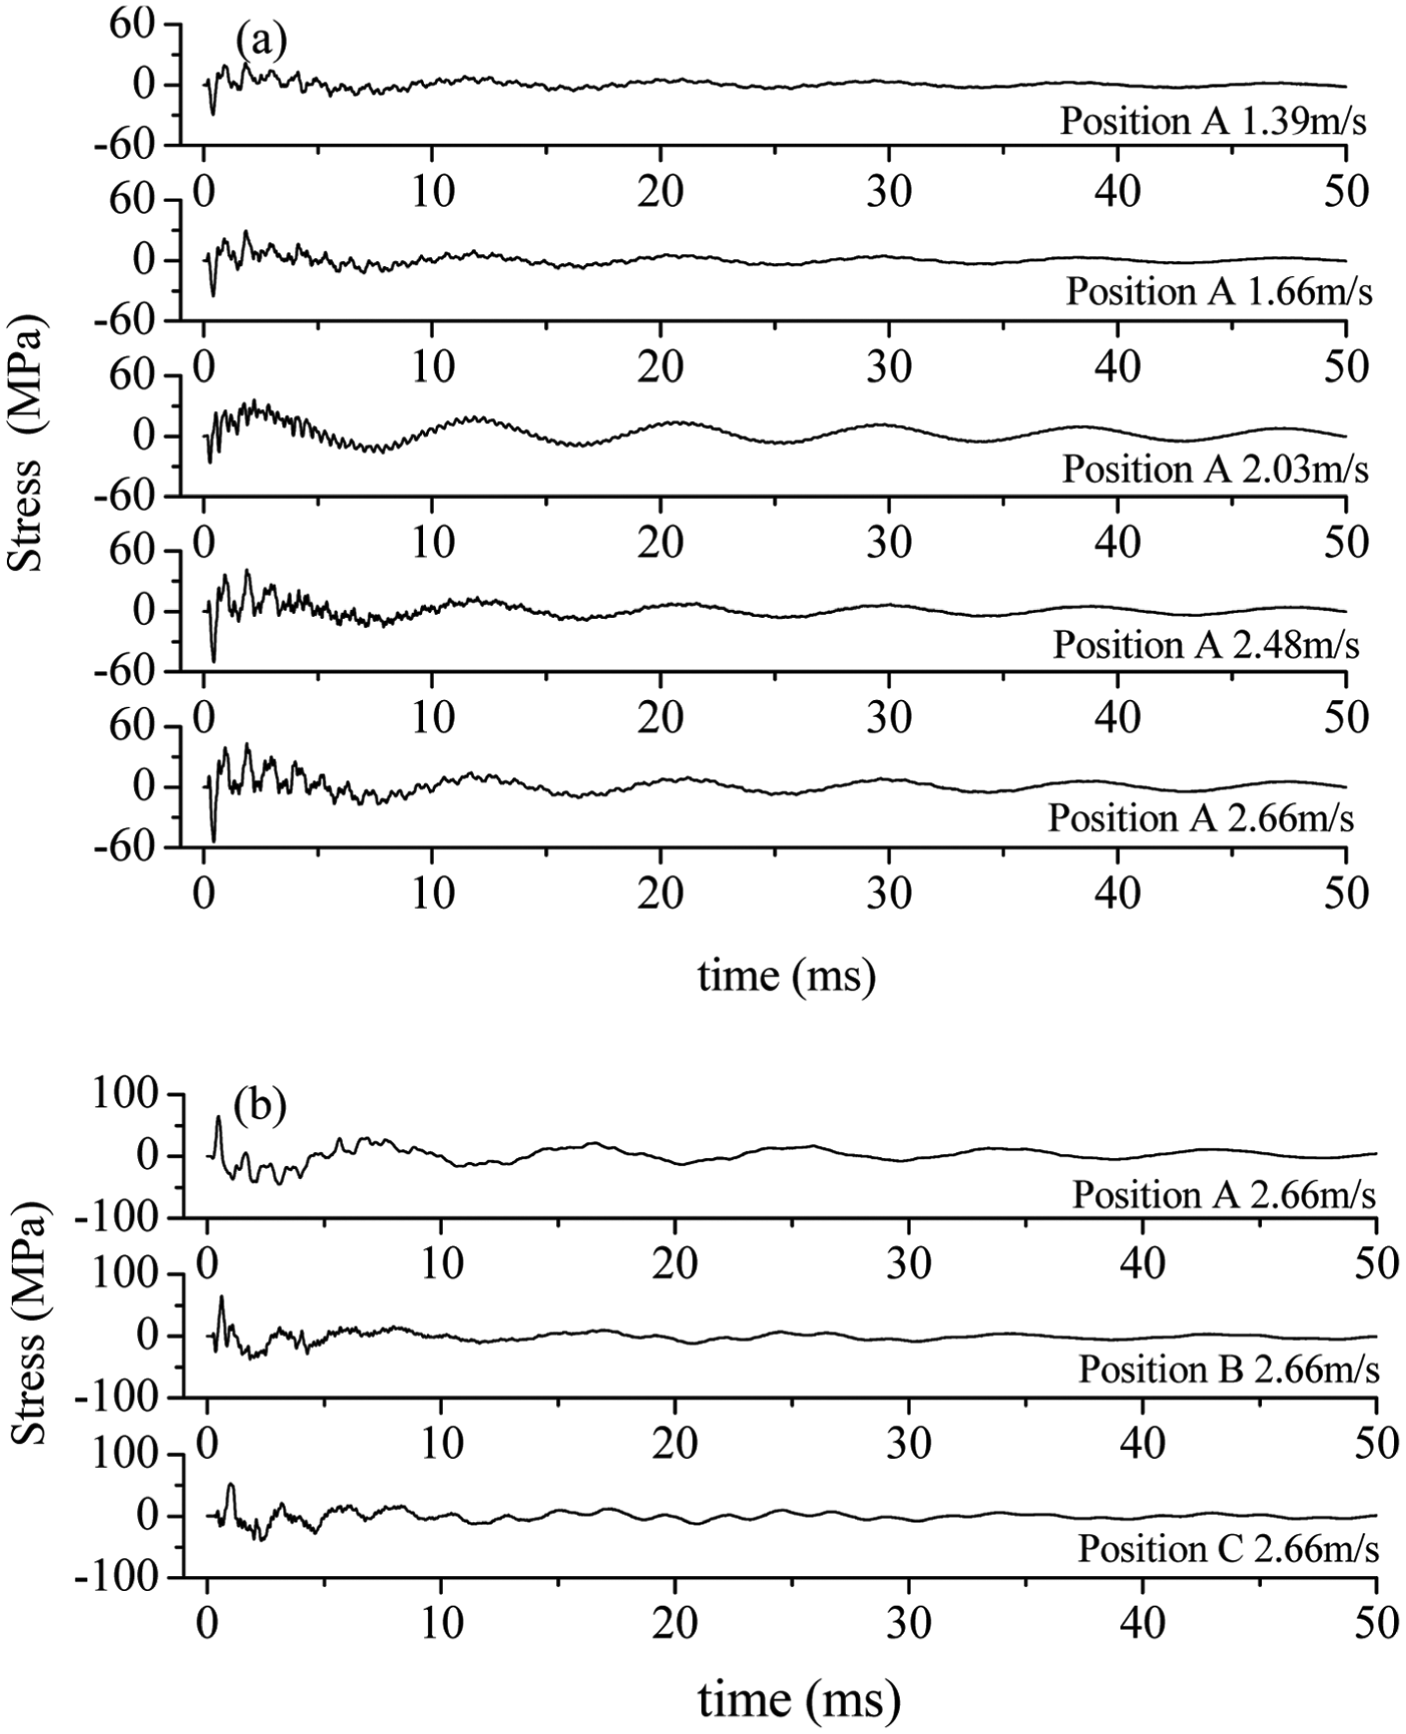
The stress response histories of two strain gauge pairs ST1 and ST2 in all tests were sampled and recorded by data acquisition instrument (DH5939). The 16 curves of the first 50 ms for three different impact locations and five different initial impact velocities are shown in Figures 6 and 7, respectively.

Stress histories of ST1 on the beam: (a) at position A and (b) at positions A, B, and C.
Stress histories of ST2 on the beam: (a) at position A and (b) at positions A, B, and C.
As shown in Figures 6(a) and 7(a), the stress responses of gauge pairs ST1 or ST2 corresponding to different impact velocities at position A were found to be similar except for their respective amplitudes, which were observed to be increased with the relative values of the impact velocities. The high-order frequency components of the stress responses are more obvious than that of the displacement response.
Figures 6(b) and 7(b) show that the stress responses of two strain gauge pairs ST1 and ST2 change considerably when the impact position moves from the center of the beam toward the supported end. For impact position C, the high-frequency stress response becomes more obvious.
Frequency spectrum of the displacement and stress response
Fast Fourier transform (FFT) technology was applied to analyze the displacement and stress responses of the beam, and the frequency spectrum of displacement and stress responses were derived as shown in Figures 8–10.

FFT (magnitude) of displacement response of beam: (a) at position A and (b) at positions A, B, and C.
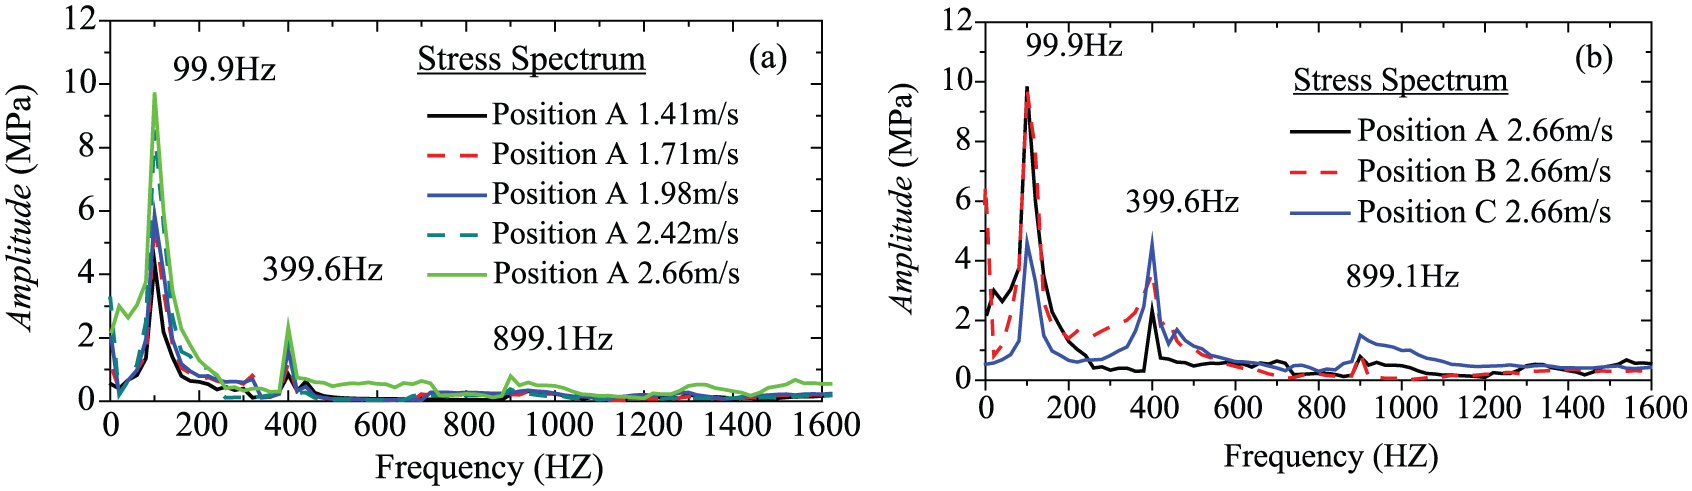
FFT (magnitude) of the stress response on ST1: (a) at position A and (b) at positions A, B, and C.

FFT (magnitude) of the stress response on ST2: (a) at position A and (b) at positions A, B, and C.
Figure 8 shows the FFT (magnitude) of displacement responses corresponding to Figure 5, plotted by the amplitudes of displacement on the horizontal axis and vibration frequencies on the vertical. The first three vibration frequencies of the beam displacement responses can be clearly identified as shown in Figure 8(b), which are 99.9, 399.6, and 899.1 Hz, respectively. The calculation results agree well with the corresponding first three natural frequencies of the simply supported beam, 21 which are 104, 416, and 936 Hz, respectively.
It is noted that the first-order and the third-order vibrations are excited in all tests, and the first-order vibration always plays a dominate role. The second-order vibration vanishes at position A (see Figure 8(a)). However, the second-order vibration will be excited and becomes obvious as the impact position moves to the supported end.
Figures 9 and 10 show the FFT (magnitude) of the stress responses corresponding to Figures 6 and 7. The first three natural frequencies of the stress responses are 99.9, 399.6, and 899.1 Hz, respectively, which agree well with the results of the displacement responses. This proves the high reliability of the measurement and the high quality of the experimental setup. Therefore, the beam is more like a simply supported beam, and the experiment can be treated as the experiment of steel sphere falling impact on simply supported beam.
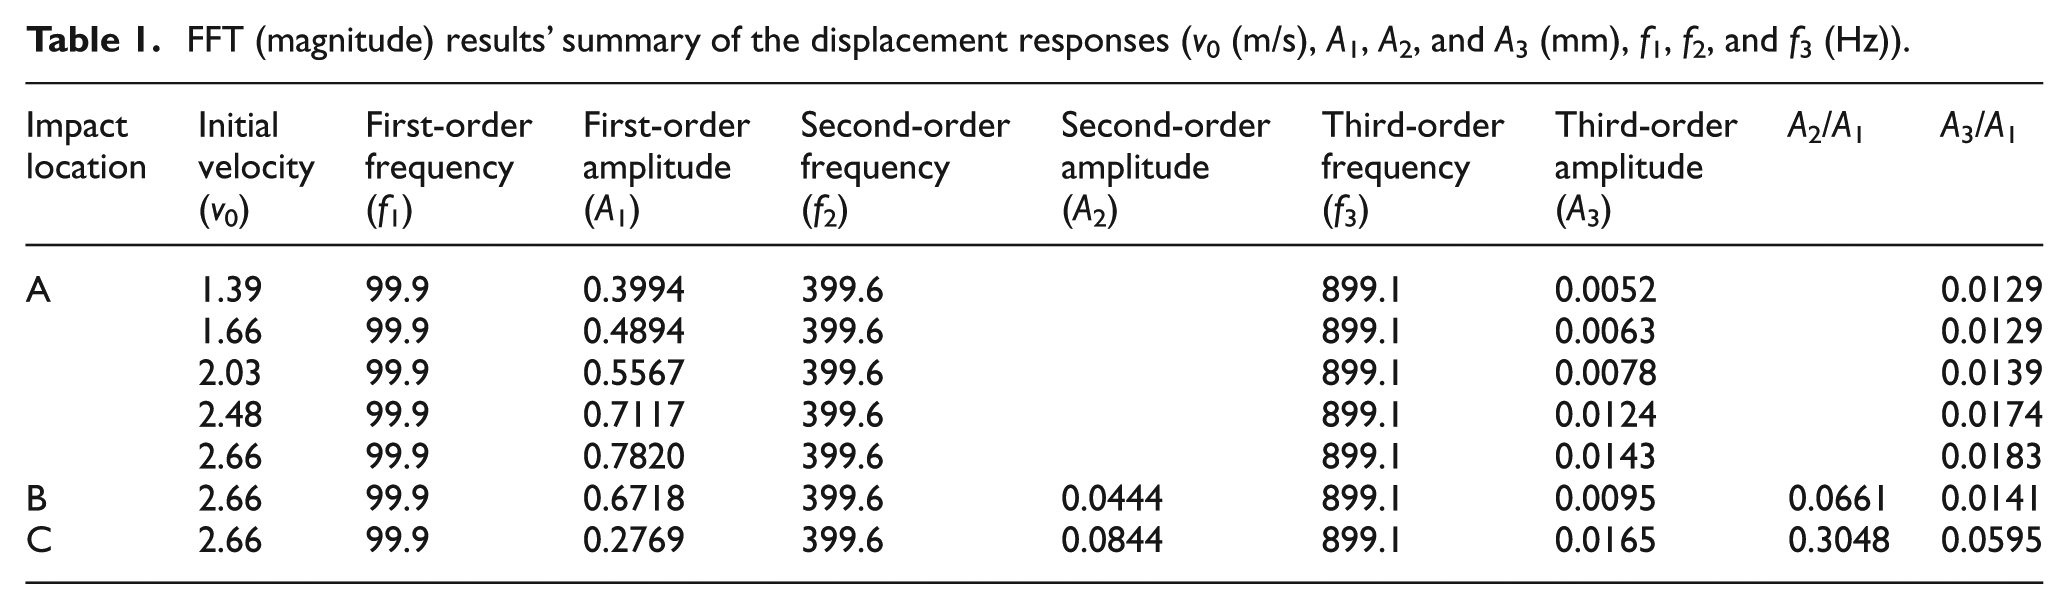
It can be seen that the first three vibrations were excited in all the experiments on ST2. In contrast, the second order disappears from the FFT of the stress on ST1 at position A, which recurs and becomes obvious at positions B and C. This investigation shows that the impact location and test point location have great influence on frequency spectrum. The high-order vibrations will become more obvious when the impact point or test point moves to the supported end. The FFT calculation results’ summary of the displacement and stress responses is given in Tables 1 and 2, respectively.
FFT (magnitude) results’ summary of the displacement responses (v0 (m/s), A1, A2, and A3 (mm), f1, f2, and f3 (Hz)).
FFT (magnitude) results’ summary of the stress response (v0 (m/s), A1, A2, and A3 (mm), f1, f2, and f3 (Hz)).

Examination of the tables reveals several points of interest. First, the first three vibrations of the beam were excited by the impact. Second, the second- and third-order vibrations become more obvious when the impact point moves away from the center of the beam. As the position approaches the supporting point, the maximum amplitude of second-order vibration approaches that of the first-order vibration as shown in Table 2.
Sub-impact phenomenon
Reconstruction of the sphere motion trajectory
Because the continuous motion trajectory of the sphere for a relative long time is difficult to be accurately obtained by the high-speed camera, displacement ub(t) of the sphere was calculated from the measured signals of beam displacement uM(t) and contact voltage V(t). Neglecting the motion damping and contact deformation of the sphere, displacement ub(t) and velocity vb(t) of the sphere were derived from the motion equation of an upcasting sphere under gravitational force
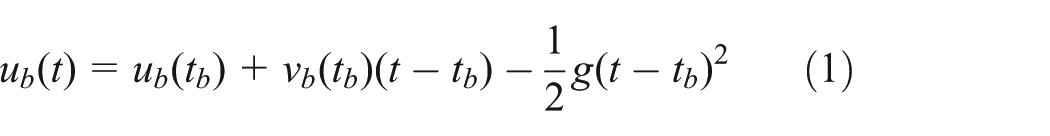


where tb, ti, and g are the beginning time and ending time of the separation phase measured from the contact voltage signal V(t) and acceleration of gravity.
Figure 11 shows an example of the entire process of dropping a steel sphere with an initial impact velocity of 2.66 m/s to strike a steel beam. The blue line indicates the reconstruction motion trajectory of the sphere in the entire impact process.

Reconstruction motion trajectory of sphere at position A with speed of 2.66 m/s.
Measurement of contact–impact duration
The contact–impact duration is an important parameter that is helpful to understand the essence of the sub-impact. The contact–impact duration can be experimentally obtained by the sub-impact measurement circuit. Figure 12 shows the first falling impact process of the sphere and beam at position A with speed of 2.66 m/s. Each rectangular pulse corresponds to a sub-impact process. On contact initiation at Ti, a sharp rise occurs, and the signal drops back down to 0 on loss of contact at Ts. The width of the rectangular pulse represents contact–impact duration of the sub-impact, and the time interval between the two rectangular pulses represents the duration of the separation stage. There are two sub-impacts occurring in this impact process.

Contact–impact duration of sub-impact in the first falling impact process of position A with speed of 2.66 m/s.
In addition, the experimental results show that the height of each rectangular pulse is nearly equal, which is equal to the voltage of the alkaline battery supplying power in the sub-impact measure circuit, regardless of the long or short contact–impact duration. Even in the later falling impact process as shown in Figure 13, the intensity of the impacts becomes increasingly weaker and generates the successive chatter phenomenon,17,22 but the rectangular pulse can still be identified clearly. This proves the high reliability and the high precision of the sub-impact measurement circuit, which has laid a good foundation for this article.

Contact–impact duration of the sub-impact in later falling impact process of position A with speed of 2.66 m/s.
Sub-impact phenomenon
As shown in Figure 14, six visible falling-rebound processes of the sphere can be identified in the entire impact process. Two or three sub-impacts were observed in the first four falling impact processes as shown in the four insets of Figure 14. The measured contact–impact duration tM of the sub-impacts is in the range of 0.18–1.22 ms. Apparently, according to the image resolution speed of human eyes which is 24 frames/s (i.e. 41.67 ms), the sub-impacts in a falling impact process would be identified as a single impact with our naked eyes.

Test signals of position A with speed of 2.66 m/s.
The sub-impact phenomenon was also captured by high-speed camera (NAC GX-3). As is evident from Figure 15, two sub-impacts were captured in the first falling impact process of the sphere by the high-speed camera. The first sub-impact takes place at 273.0 ms since the sphere begins to fall, and the second sub-impact appears at 276.0 ms. The time interval between the two sub-impacts is only 3 ms, and they appear indeed as a single impact to our naked eyes.

A sequence of movie frames in the first falling impact process of the sphere and plastic impact crater (v0 = 2.66 m/s).
Because the sphere will fall into the apparent crater (a plastic crater caused by the first impact shown in the last small photograph in Figure 15), the accurate contact–impact duration of the sub-impact cannot be measured directly by the high-speed camera, but it can be accurately measured by the sub-impact measurement circuit.
The test and reconstruct signals are illustrated in Figure 16, including the beam displacement uM(t), contact–impact voltage V(t), and the sphere displacement ub(t). As can be seen in Figure 16, the visible falling-rebound processes of the sphere take place in all tests. The rebound height of the sphere is more and more low, and eventually the steel sphere pastes with the beam and vibrates together. After the first sub-impact, the strong bending vibration of the beam is initiated and decays gradually due to damp.

Impact response of sphere falling impact on beam: (a) initial impact velocities of 1.39, 1.66, 2.03, 2.48, and 2.66 m/s at impact position A and (b) initial impact velocity of 2.66 m/s at impact positions A, B, and C.
As shown in Figure 16, most of the falling impact processes consist of several sub-impacts, seldom just a single impact. In later stage, the steel sphere seems to paste on the beam, but more intensive sub-impacts were still observed in all tests, which is called as chatter impact.17,22
The first falling impact processes of the sphere in all tests consist of two sub-impacts. The impact–contact duration of the sub-impact processes is at the microsecond-to-millisecond time scale. It is noted that the distribution of the sub-impacts is sensitive to the initial impact velocity and impact position. The second sub-impact is more close to the first sub-impact as the initial impact velocity increases or impact position becomes increasingly away from the center of the beam.
Figure 16 shows that the sub-impact phenomenon takes place in all tests. The problem of the sphere impacting against beam is a typical impact problem in engineering and nature. The test results might demonstrate that the sub-impact phenomenon is common.
Contact–impact duration
Theoretical solution of contact–impact duration
According to the central impact of two spheres based on Hertz contact law, 23 the contact–impact duration of the simply supported beam struck by steel sphere has been deduced (see Appendix 1). By assuming that the initial impact velocities of steel sphere and simply supported beam are v10 and v20, respectively, the relative impact velocity is ΔV = v20 − v10. The contact–impact duration was obtained by considering the local contact elastic deformation (elastic indentation) and the energy balance as follows

where m and K are the equivalent mass and the Hertz contact stiffness, respectively, given by


where a is the distance of the impact position to the left supported end of the beam, and E* is the equivalent elastic modulus. The beam curvature R1 = ∞ and the sphere curvature R2 = 35 mm.
It is known that the theoretical expression of contact–impact duration tH is aimed at classic single-impact problem, and the plastic deformation and global vibration of the impact bodies have not been considered. The tH expression (4) has not been validated for the sub-impact.
Comparisons of contact–impact duration of theoretic and experimental results
Figure 17 shows the comparisons of

Contact–impact duration of the first sub-impact at position A.
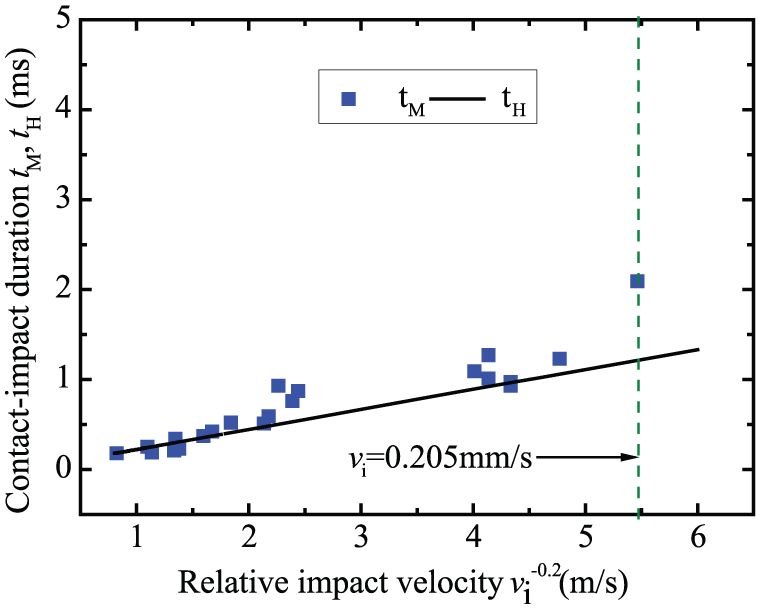
Figure 18 shows the comparisons of tH with tM, where tM is the experimental contact–impact duration of the subsequent sub-impacts after the first sub-impact. It is observed that tM is still consistent with

Contact–impact duration of the subsequent sub-impacts at position A.
Figures 19 and 20 show the comparisons of
Contact–impact duration of the sub-impacts at position B with initial impact velocity of 2.66 m/s.

Contact–impact duration of the sub-impacts at position C with initial impact velocity of 2.66 m/s.
Although the sub-impacts appear to be complicated as shown in Figure 16, the experimental contact–impact duration is in good agreement with the theoretical contact–impact duration derived from the Hertz contact law, as shown in Figures 17–20. It is confirmed that the Hertz contact law is still suitable to estimate the impact–contact duration of the sub-impacts. Hence, the sub-impact process is dominated by local contact deformation, and their mechanism can be explained by the Hertz contact law. From the Hertz contact law, the sub-impact may be depending on the relative impact velocity, equivalent mass, material properties, contact curvature radius of the sphere, and the beam.
Interaction between sphere and beam
Influence of global deformation on sub-impacts
According to the previous study in this article, the sub-impact process is dominated by local contact deformation, not the beam global vibration, but the generation of sub-impact will involve in the beam global vibration. After an impact, the generation of the next impacts needs a necessary motion condition, 8 that is, the sphere and beam should be close to and catch up with each other again.
As shown in Figure 21, six typical falling impact processes of the sphere taken from Figure 16 are illustrated, and the corresponding FFTs (magnitude) of the beam displacement response are presented in Figure 22. Two impact processes are chosen from the sphere falling test at impact position A, and others impact processes are chosen from the sphere falling test at impact position C, of which only the falling impact process in Figure 21(f) is not accompanying with the sub-impacts.

Impact responses of sphere falling on the beam: (a) first falling impact process for v0 = 2.66 m/s at impact position A, (b) first falling impact process for v0 = 2.66 m/s at impact position C, (c) third falling impact process for v0 = 2.66 m/s at impact position C, (d) fourth falling impact process for v0 = 2.66 m/s at impact position C, (e) ninth falling impact process for v0 = 2.66 m/s at impact position C, and (f) third falling impact process for v0 = 1.39 m/s at impact position A. Symbols are in correspondence with Figure 12.

FFT (magnitude) of the displacement responses of the beam corresponding to Figure 21: (a) first falling impact process for v0 = 2.66 m/s at impact position A, (b) first falling impact process for v0 = 2.66 m/s at impact position C, (c) third falling impact process for v0 = 2.66 m/s at impact position C, (d) fourth falling impact process for v0 = 2.66 m/s at impact position C, (e) ninth falling impact process for v0 = 2.66 m/s at impact position C, and (f) third impact process for v0 = 1.39 m/s at impact position A.
As shown in Figure 21(a), the sphere does not rebound after the first sub-impact and continues to move down. This means the beam absorbs most of the sphere impact kinetic energy and does not transmit enough energy back to the sphere. When the beam reverses its trajectory and moves up due to the first vibration of the beam (see Figure 22(a)), the beam closes to and catches up with the sphere again and generates the second sub-impact.
On the basis of Hertz contact law and Newton impact law, two rigid will separate after impact and do not cause the second impact if there is no external force. It is believed that the steel sphere will rebound after the impact on the beam, then decelerate and fall down again on the beam causing the second impact due to gravity effect. However, Figure 21(a) shows that the second sub-impact is not caused by the gravity effect.
Because the beam is flexible body, vibration deformation will occur after impact, and the first- and high-order vibrations will also be excited. As shown in Figure 21(a), the beam and sphere move in the same direction after the first impact. When the beam achieves its maximum deflection, it will reverse its trajectory and closes to and catches up with the sphere again and generates the second sub-impact. Therefore, the first-order vibration of the beam has been excited by the first impact as shown in Figure 22(a), which results in the second impact. These suggest that the global vibration deformation of the flexible body would probably cause the sub-impact phenomenon.
Similar mechanism to generate sub-impacts, that is, the global vibration deformation of the beam can also be observed in Figure 21(b). After the first impact, the sphere and the beam begin to separate and move down in the same direction. When the beam reverses its trajectory under the comprehensive effects of the first- and second-order vibrations, the beam moves up and catches up to the sphere again in the 1/4 cycle of the first vibration. This is because the second order becomes more obvious as shown in Figure 22(b). It can be concluded that the insufficient rebound of the sphere and the combined effect of the first- and second-order vibrations of the beam result in the sub-impact phenomenon.
Figure 21(c) shows that the sphere keeps its moving direction down after the first impact as the sphere rebound is not enough. The sphere and beam close to and catch up with each other again and again and generate from the second to the fifth sub-impacts. After reaching its maximum deflection, the beam reverses its trajectory caused by the first- and high-order vibrations (see Figure 22(c)) and catches up with the insufficient rebound sphere again and again; then the sixth to the eight sub-impacts take place. It should be noted that the couple of the first- and high-order vibrations have some strong influence on the sub-impact.
The impact velocity of the sphere is lower and lower after multiple falling impact process, and the vibration deformation of the beam is weaker and weaker due to air damping. At later stage of the entire impact process, the sphere and beam almost stick together, and the sub-impact phenomenon becomes more complex. The sub-impacts also take place in either descent or rising stages of the first-order vibration of the beam. Some are observed in both stages (Figure 21(e)). Others are observed merely in rising stage (Figure 20(d)). A different sample is shown in Figure 21(f), in which the next impact does not take place because the sphere just falls on the top of the beam vibration and rebound enough, and the beam just reverses its trajectory and moves down caused by the first-order vibration at the same time as shown in Figure 22(f). It might be concluded from the above experimental results shown in Figures 21 and 22 that the global deformation vibration of the beam excited by the impact is a reason to generate the sub-impacts.
In our further analysis of the experimental results, it was found that if the sphere falls into vibration peak of the beam displacement, a single impact may take place as shown in Figure 21(f). Multiple sub-impacts may take place if the sphere falls into the vibration valley of the beam displacement, and the distribution region of the sub-impacts is less than the width of the vibration valley of the beam displacement as presented in Figure 21(a)–(e). If the second vibration is excited obviously and the steel sphere falls into its vibration valley, the distribution region of the sub-impacts will be significantly shortened as shown in Figure 21(b).
To sum up, the experimental results show that the global elastic vibration of impact bodies are the main reason resulting in the sub-impacts, and the complexity of the sub-impact is caused by the first-order, second-order, and perhaps higher-order vibrations of the beam.
Influence of beam global motion on contact–impact duration of sub-impacts
The different characteristics of impact–contact duration of the sub-impacts as shown in Figures 17 and 18 must be addressed. The flexible beam keeps certain vibration velocity vM and acceleration aM after the first impact, even the subsequent impacts will not take place. However, equation (4) is derived from a local quasi-static contact model presented by Hertz, and the global deformation motion of the flexible structure is not considered. If the global deformation motion of the flexible beam is considered, then the deformation of the flexible beam should include local contact deformation and global elastic deformation.
A mass–spring model is used to describe impact deformation of the beam, namely, the beam is simplified as a spring, and the distributed mass of the beam is equivalent to lumped masses M.
Therefore, the impact force is given by

where aM is the global acceleration of beam, and δ is the sphere indentation.
Based on Hertz contact law, the impact force is given by

where K is the Hertz contact stiffness.
Hence

Integrating with respect to δ gives

Assuming

where
So δmax is expressed in equation (14)

Integrating equation (12), the contact–impact duration t can be obtained in simplified form as

where
The total contact time–impact duration is 2t. It was found that the global deformation motion of the flexible beam has influence on the contact–impact duration. However, the contact–impact duration t in equation (15) cannot be obtained by direct integration, and it needs to be solved by numerical method.
For example, the second sub-impact response of the sphere falling on the center of the beam with impact velocity of 1.39 m/s is illustrated in Figure 23. The average vibration acceleration

Contact voltage and acceleration histories of the second sub-impact at position A (v0 = 1.39 m/s).
As another example, Figure 24 shows the fourth sub-impact response of the sphere falling on the center of the beam with initial impact velocity of 1.66 m/s. The average vibration acceleration calculated by the experimentally measured results is −8.2 m/s2. The measured contact–impact duration for this sub-impact is 448.2 µs, which is in good agreement with the computed results by considering the beam global deformation motion obtained from equation (15). However, the measured contact–impact duration is longer than the theoretical result tH by equation (4). (In this case, contact–impact duration is 404.51 µs.) It means the contact–impact duration was extended by global deformation motion of the beam.

Contact voltage and acceleration histories of the fourth sub-impact at position A (v0 = 1.66 m/s).
Further research has been carried out, and it is found that the extended sub-impact processes correspond to the smaller average vibration acceleration of the beam, while the shortened sub-impact processes correspond to that of the greater average vibration acceleration. These above results mentioned show that the processes of the subsequent sub-impacts are influenced greatly by the global structure vibrations of the beam, and eventually leading to the next impact being difficult to predict.
Coefficient of restitution
The changes in the kinetic characteristics of sphere falling impact process could be discussed from the viewpoint of the changes in the restitution characteristic. In Figure 25, the measured apparent coefficients of restitution for the first falling impact process of the sphere are presented. It was found that the apparent coefficient of the restitution shows highly nonlinear and uncertain behavior. However, if the first sub-impact process was only observed, we found that the coefficient of the apparent restitution decreases monotonically with the initial impact velocity of the sphere as shown in Figure 26, and the change rule coincides with the experimental results summarized by Goldsmith 20 and Johnson. 23 In addition, we found that the initial impact conditions chosen are close together, and the impact response of the sphere and beam is quite different which is due to the subsequent sub-impacts. Therefore, it was deduced that the subsequent sub-impacts result in the apparent coefficient of the restitution showing a highly nonlinear and uncertain behavior.
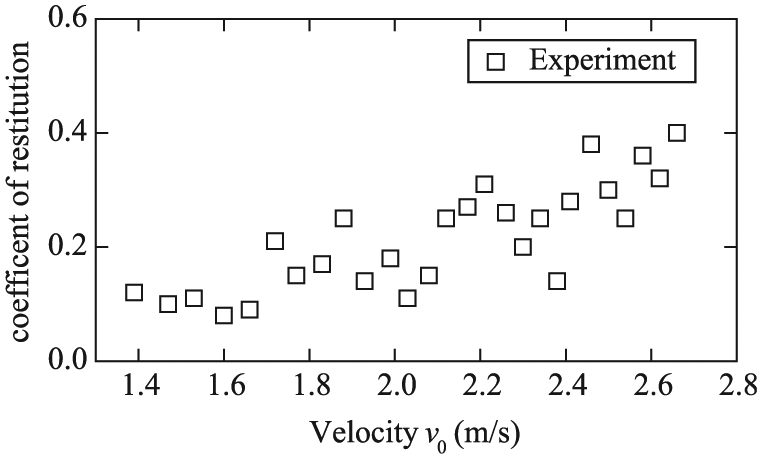
Apparent coefficient of restitution for the first falling impact process of the sphere at position A.
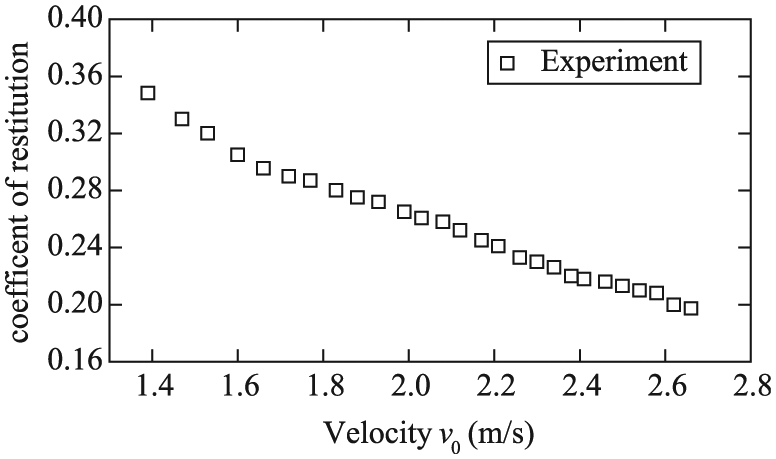
Apparent coefficient of restitution for the first sub-impacts.
Conclusion
The entire impact and rebound processes of the steel sphere falling on the beam were measured by a self-designed experimental setup. Most of the falling impact processes consist of several sub-impacts, and seldom falling impact processes just consist of a single impact. The impact–contact duration of the sub-impact process is at the microsecond-to-millisecond time scale, and the distribution of the sub-impacts is more sensitive to the initial impact velocity and impact position. However, it is interesting to note that the impact–contact duration of the first sub-impact coincides well with the theoretical contact–impact duration derived from Hertz contact law. The impact–contact duration of the subsequent sub-impacts is basically consistent with the theoretical values, but oscillates around the theoretical values, which is explained theoretically by a revised impact theory by considering the beam vibration. The extended sub-impact is found to be corresponding to the smaller average vibration acceleration of the beam, while the shortened sub-impact process is corresponding to that of the greater average vibration acceleration. In further analysis of the experimental results, it is found that if the sphere falls into vibration peak of the beam displacement, a single impact may take place. Multiple sub-impacts may take place if the sphere falls into the vibration valley of the beam displacement. If the second vibration is excited obviously and the steel sphere falls into its vibration valley, the distribution region of the sub-impacts will be significantly shortened. The experiments illustrate that the global deformation vibration of the beam excited by the impact is the main reason resulting in the sub-impacts. When the sub-impacts take place, the apparent coefficient of the restitution shows a highly nonlinear and uncertain behavior.
Footnotes
Appendix 1
In elastic collision situation, suppose the mass of steel sphere and simply supported beam is m1 and m2, respectively, and their centres approach each other by a distance δ due to elastic deformation during impact. The velocity of steel sphere and simply supported beam is v1 and v2, and their relative velocity is
Hence
δ is given by Johnson 23
Then
By equating equations (17) and (19)
Writing 1/m for (1/m1 + 1/M) we get
At the maximum compression δmax, dδ/dt = 0, which gives
Time parameter t is acquired from a second integrate, thus
The total time of impact tH is, therefore, given by
Academic Editor: Chuanzeng Zhang
Declaration of conflicting interests
The author(s) declared no potential conflicts of interest with respect to the research, authorship, and/or publication of this article.
Funding
The author(s) disclosed receipt of the following financial support for the research, authorship, and/or publication of this article: This research was supported by the National Natural Science Foundation of China (no. 11372138), the Specialized Research Fund for the Doctoral Program of Higher Education of China (no. 2012321910036), and the Provincial Natural Science Foundation of Anhui College (no. KJ2013Z021).