
Abstract
An important failure mode in sandwich structures is the debonding between the core and facesheet, which can destroy the load capacity of the structure. This work addressed the critical interfacial modes and studied the effects of thickness variation of the core material. The single cantilever beam geometry is utilized for conducting experiments after optimizing the thicknesses of the core and facesheet by minimizing the difference in the bending stiffness matrix between the upper facesheet and the lower facesheet/core combination. Two different core material thicknesses were tested. The experimental results showed that the critical energy release rate could be influenced by core thickness variations. Furthermore, the cohesive zone method and elastic–plastic core material model in conjunction with fracture criteria were used to model the entire structure failure response. The validation results predicted load–extension curves in agreement with actual tests for both single cantilever beam geometry specimens. The model also had the ability to predict the crack initiation in the core materials which occurred under the interface zone as in the actual test. In addition, the mixed-mode ratios through the interface area were analyzed as function of crack length to assess its influence on both single cantilever beam thickness specimens.
Introduction
The use of sandwich structure (two face layers bonded to lightweight core material) provides the advantages of high bending stiffness and load capacity at very low weight. However, some unique failure modes are created with this structural configuration. Specifically, a weak region could be the interface zone in which the interlayer crack initiates and propagates, causing debonding between the bi-materials. 1
The debonding failure phenomena in composite sandwich structure have been extensively investigated in experimental and numerical methods.2–10 Most characterizations were conducted to extract the opening mode of critical energy release rate (ERR) from the double cantilever beam (DCB) specimen, as well as cracked sandwich beam (CSB) and single cantilever beam (SCB) test configurations. Furthermore, the general concern during these tests is to maintain the interface crack propagation in a steady-state manner. However, in most cases, the cracks may grow into either the core material, causing kinking, or the facesheet. This behavior could be dependent on the applied load position, type of materials, and sizing dimensions of the test coupon.
Several researchers have predicted the numerical tendency of interface crack propagation either as single-mode or mixed-mode problems. For the failure prediction scenario, the crack propagates with self-similarity as pure mode or it kinks into the core materials when the mixed-mode conditions were dominated near the crack tip at various kinking angles. Matteson et al. 11 have proven that laminated beam analysis has the ability to predict the crack kinking angle of symmetric and unsymmetrical DCB. Yokozeki 12 proposed closed-form solutions for the ERR associated with core cracking of DCB. Gdoutos and Balopoulos 13 investigated the effects of the curing conditions on debonding. They used the finite element code to estimate the depth of kinking crack into the core for different types of polyvinyl chloride (PVC) foam densities.
Among the crack behavior predictions or characterization, most attention was given to the DCB test. Indeed, even if the initial crack is placed at the center of the interface zone, the crack kinked into the core. Note that during the DCB test, the bending of both core and lower facesheet can be the main cause to core kinking status as a result of tensile stress introduced from the lower facesheet. 14 Davidson et al. 15 have modified the sizing geometries of DCB and end-notched flexural (ENF) test specimens to keep the core–facesheet interface corresponding with the neutral axis. This was done by equalizing the bending stiffness on the upper beam (facesheet only) and lower beam (core and facesheet together). They found that the modified geometries are strongly sensitive to the variations in lower facesheet layers even though the geometrical shapes of test coupons are not symmetric. Furthermore, DCB test coupon could not sustain crack tip rotation introduced from elastic foundation effects which may lead to increasing the errors of measuring interfacial fracture toughness. 16
Hence, the SCB test has presented to be the best candidate of characterizing the opening-mode fracture toughness. Adams et al. 17 have evaluated the test method, and they point out that the bending deformations in the core and the lower facesheet are eliminated by fixing the bottom beam to the test support while reducing the multiple layers of upper facesheet. Consequently, the crack can propagate in the interest area of the interface. Moreover, the needs of standardized sandwich test methods may require highlighting both bounds and limitations of designed symmetric test specimen so that it can cover a wide range of popular core materials. Ratcliffe and Reeder 18 have established the sizing of SCB specimen dimensions with emphasis on both supporting linear elastic response and the simplicity of calculating the deboned fracture toughness. In addition, about 64 types of sandwich systems have been sized under that procedure.
In this work, the main objectives are to investigate the effects of core thickness variations on the fracture toughness parameters for new sandwich system of glass/epoxy tape with closed-cell polymeric core using the SCB test configuration. The thicknesses of the foam core and glass/epoxy facesheet were optimized using a new optimization model. It is used to minimize the difference in the bending stiffness matrix between the upper facesheet and the lower facesheet/core combination by changing the core and skin thicknesses that make the crack propagate in the interest area of interface zone. Then, the critical ERR was calculated by the compliance calibration method (CCM) after conducting the experiments. Additionally, the experimental results were then used with a cohesive zone finite element method to predict how the modes (opening or sliding modes) drive the crack growth through the interface area for the SCB geometry used here.
Characterization of sandwich materials
Core Divinycell H80 foam experiments
This study used rigid PVC closed-cell foam Divinycell H80 as core material since it is used extensively in high-strength structural building, aerospace, marine, and other industrial applications. It was manufactured by DIAB, and it is a closed-cell foam with a density of 80 kg/m3. 19 Two different thicknesses of 12.7 mm (0.5 inch) and 6.35 mm (0.25 inch) were used to study the variations in core thickness on fracture toughness. Consequently, it was characterized under the standards of compression (ASTM D1621) 20 and tensile (ISO 1926) 21 tests in different directions to determine the elastic–plastic response at room temperature as it was numerically validated with experimental results. Since the foam is considered to be anisotropic, the axis designation used in this study is as follows: the 1-2 plane is considered to be the isotropic in-plane of the foam sheet, whereas the 3-axis is the out-of-plane or foam thickness direction.
Fractography of the foam compression specimens was conducted before testing using the scanning electron microscopy (SEM) Hitachi S-4800, in both directions 1-2 and 1-3 as in Figure 1. The images reveal that the microstructure of foam cells in direction 1-2 has irregular shaped cells uniformly scattered creating the isotropic response. However, in the 1-3 direction, the microstructure of cells seems to have more elongated cells in the 3-direction, resulting in the transverse isotropic 1-3 and 2-3 planes.
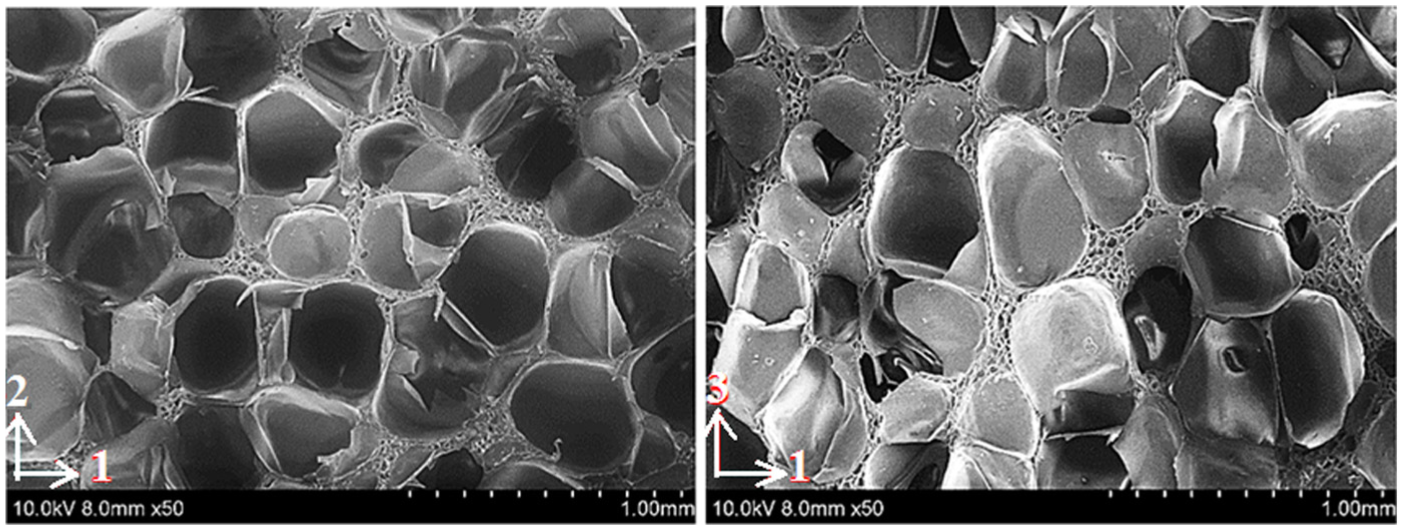
Fractography of compression foam specimen in 1-2 and 1-3 directions before testing.
The experimental results of engineering stress–strain response for in-plane tension and out-of-plane compression tests are shown in Figure 2. It illustrates that in tension after an initially linear response region, the curves reveal a substantial nonlinear softening response, but no yield point and fracture occurring along the specimen gauge length by single crack. In Figure 3(a), the SEM investigation of fracture surface of tensile specimens has shown the possibility of crack initiation in the center of middle gauge length as an area of cleavage facets appeared. During loading, the crack propagated nonlinearly as micro-cracks extended around edges resulting in a quasi-brittle failure at 6% strain.

Tensile and compression engineering stress–strain average data for Divinycell H80 foam of in-plane and out-of-plane loading directions.

(a) Fractography of tension foam specimen in 1-2 direction and (b) fractography of compression test in 1-3 direction.
In contrast, in compression test, the nonlinear response has attributed to plastic deformation with yield point at 1.2 MPa for out-of-plane direction. As the foam crushes, the micro-mechanism of failure shows the densification of cells presented in micro-bucking, plastic hinges, and burst of faces due to closed cells as in Figure 3(b). The densified cells appear to be less in the transversely isotropic phase direction 1-3. This is due to the fact that it has more vertical thicker edges, resulting in stiffening and strengthening of foam in the 1-3 direction.
Table 1 summarizes the experimental outcomes of uniaxial compression and tensile properties of Divinycell H80 foam gathered from tests. These set of mechanical properties form the basis input of core material into finite element analysis (FEA) to model the nonlinear response of foam cored sandwich structures. To simulate the material surface response of the plastic region of H80 foam, it was necessary to determine the suitable yield surface parameters in each plane direction as well as the actual hardening parameter in that direction. Thus, crushable isotropic hardening (CIH) implemented in Abaqus based on Deshpande and Fleck’s 22 constitutive model was chosen. Using the constitutive model and material properties in Table 1, yield surface was drawn for both compression and tension tests as in Figure 4(a). Furthermore, actual hardening curve was found as the true stress and logarithmic plastic strain from experimental tension test as in Figure 4(b). These results were required as input data for built-in crushable foam plasticity model in Abaqus, which would characterize the mechanisms of foam deformation. 23
Summary of Divinycell H80 foam parameters.


(a) Yield surface of foam Divinycell H80 of plasticity model with isotropic hardening and (b) hardening for Divinycell H80 foam under tensile load on in-plane direction.
Facesheet material (unidirectional glass S-1 fibers/EPON 828 epoxy composite)
The system of composite laminate consisted of S1-HM unidirectional (UD) fiberglass obtained from AGY Holding Corporation. The fiberglass was manufactured to have two sides: the upper side had the fiber oriented in UD direction while the back side was stitched as V-shape used to hold the fiber tows in place and to add more strength in that side. The density was 2.55 g/cm3. 25 The epoxy system was EPON 828 resin epoxy with hardener EPI-CURE 3223 curing agent. The resin and the hardener were mixed with 1:10 parts, as supplied from Momentive Specialty Chemicals Company. 26
The panels were fabricated by hand layup to meet with the requirements of using ASTM D3039 27 standard for collecting mechanical properties through tensile test. As it can be seen in Figure 5(a), the longitudinal and transverse properties were obtained based on ASTM standard D3039 27 for 0° and 90° layup specimens with an advanced video extensometer (AVE) to measure the tensile strain with 200-mm field-of-view lens. The gauge length between the two targeted points (dots) was approximately 50 mm. The tensile control rate of 2 (mm/min) was applied and then video extensometer tracked the dots to record the strain. However, in-plane shear properties were collected based on ASTM D3518 28 for ±45° specimens layup with strain gauge MM (CEA-06-250UW-120) as in Figure 5(b).

(a) Fiberglass 0° and 90° layup samples into machine and the AVE tracked the distance between dots to record the strain. (b) In-plane shear test, fiberglass [±45°]s samples and connect stain wires to DAQ ports to record the strains.
Figure 6(a) shows the experimental results of a typical stress–strain curve of a [0°] laminate. The specimens failed by tensile fracture around the sample gauge length. The stress–strain of [0°] layup specimen behaved linearly up to around 1.5% strain, wherein the micro-failure events such as micro-cracking of matrix and separation fiber from matrix occurred resulting in a slight loss in modulus. Final failure occurred at just over 2% strain level. The fractography of the fractured specimens is shown in Figure 6(b). The fracture surface of [0°] layup under lower magnification (×30) shows the fiber pull-out combined with extensive matrix deformation. However, at higher magnification (×300), it was found that the crack initiated from the resin-rich area and propagated along the fiber direction until another weak resin plane, which diverted the crack path across the fiber direction. Then, the fibers were separated from the epoxy (debonding) when the crack encountered strong fibers to branch away to run in different weak resin planes.

(a) Tensile engineering stress–strain average data for Glass-S1/EPON 828 epoxy of laminates layup [0°]. (b) Fractography of Fiberglass S-1 UD of [0°] layup specimen.
Figure 7(a) shows the stress–strain response of an average 90° specimen. Initially, it behaved mostly linearly to 0.2% strain, then the sequence of failure occurred within the gauge length area resulting in nonlinear response. Figure 7(b) reveals that the fracture surface of 90° specimen failed with extensive matrix deformation as the multiple matrix cracks initiated in the rich area of resin as indentation and then propagated in an arc path along the width of the specimen (transverse crack propagation). After that, the fiber reached the point of rupture as splitting in a fibrillar manner.

(a) Tensile engineering stress–strain average data for Glass-S1/EPON 828 epoxy of laminates layup [90°]. (b) Fractography of Fiberglass S-1 UD of [90°] layup specimen after testing.
Figure 8(a) depicts the nonlinear response of engineering shear stress–strain for a typical [±45°]s specimen tested according to ASTM D3518 while Figure 8(b) illustrates that the shear stress causes the cracks to propagate at an angle of ±45° across the fibers. The break subsequently occurs in separate steps jointed with ±45° cross axial split in the orientation of fracture plane.

(a) In-plane shear engineering stress–strain average data for Glass-S1/EPON 828 epoxy on the specimen of [±45°] direction. (b) Fractography of Fiberglass S-1 UD of [±45°]specimens after testing.
Table 2 summarizes the mechanical properties of the strength and modulus for tensile and shear of composite specimens.
Summary of mechanical properties of testing UD HM Glass-S1/EPON 828 epoxy composite laminate.

Thickness optimization of SCB
To determine pure opening-mode critical energy release of the SCB specimen, the facesheet and core thicknesses are the main design variables in the specimen design. The basic idea was to, as much as possible, equalize the bending stiffness of the two bi-materials.
15
The approach employed herein was to extract the ideal thicknesses that could make the crack propagate in self-similar manner in the interface zone of the SCB sandwich structure. Figure 9 shows the sketch of SCB. The goal of the analysis is to minimize the value of the objective function

where

Sketch of single cantilever beam.
However, the objective function solution was not enough to find the optimum thickness so that the compliance solution of the SCB
18
was taken into consideration. It is used as inequality constraint, g, to maintain the crack in the interested interface area. It can prevent the crack to kink into the core, induce sharp decreasing in the force–displacement diagram, when the value of

where

The results of selecting optimum thicknesses of facesheet and core are shown in Figure 10. Each of the curves represent constant values of objective function

Optimum design of facesheet and core thicknesses.
Experimental procedure
The main objective of the testing was to determine the critical ERR of fracture in the interfacial zone between the facesheet and core, using two different core thicknesses. The experimental procedure herein is carried out for finding the open-mode fracture toughness in room temperature using a configuration of SCB specimen.
SCB test coupon
Two test configurations of SCB were constructed based on ASTM D 5528, 29 with optimized thickness dimensions resulting previously in described procedure. Two sandwich panels were prepared using hand layup with vacuum bag as in Figure 11. The facesheet material thickness was achieved using two layers of 0° S-glass wet with EPON 828 epoxy. The pre-crack was introduced by inserting the Teflon 0.5-mil (0.0127 mm) film between the top of facesheet and the core though the adhesive zone. Then, the panels were cured for 24 h at room temperature under vacuum pressure of 100 kPa. Finally, the two panels were machined to two SCB specimen configurations as in Table 3 dimension after 7 days of curing at room temperature. The loading T-hinges were attached to the top of SCB specimens using LOCTITE super glue.

Fabrication steps of single cantilever beam (SCB) specimens.
Dimension of two core thicknesses of SCB coupon.

SCB: single cantilever beam.
The interfacial toughness test procedure used followed ASTM D5528. It was conducted on an INSTRON 4486 C Model 8825 load frame machine to provide the mechanical force to measuring the load and opening displacement. Two sample types of four specimens each were tested to calculate
Numerical analysis (FEA)
In the numerical simulations, one key objective was to investigate whether the SCB configuration was in pure opening mode or the mixed mode played an important role. This was performed using FEA in combination of both cohesive mixed-mode damage model and elastic–plastic model of the core material. The procedure herein was to validate the finite element results with experimental findings by comparing the P–δ curves. The modified virtual crack closure integral (MVCCI) method was then employed to estimate the effects of mixed mode.
Validation of SCB test
Two different geometries of SCB specimens (two core thicknesses) were modeled in two-dimensional (2D) using the commercial FEA software ABAQUS (v6.12-3). Figure 12 shows the boundary conditions such that the base surface of the beam was enabled to move in the axial direction and fixed in the direction of load. The facesheet was modeled as orthotropic material as in Table 2. The foam, however, was modeled as an isotropic with elastic properties of in-plane tension direction as in Table 1 while the plastic part was modeled using the implemented isotopic crushable hardening (ICH) model with input parameters as in Figure 4(a) and (b). In this FEM, there are two types of crack propagation modeling, which represented an interfacial crack and core kinking micro-crack status; the cohesive zone method (CZM) was used to model the interfacial crack while the extended finite element method (XFEM) was used to model the crack initiation in the core material.

Details of boundary conditions and the map of mesh of SCB test.
For CZM material modeling, the triangular traction law was used to model the layers of cohesive material. The triangular CZM law is more widespread used law since it is more straightforward to formulate and it gives the modeling results faster on account of easier convergence.
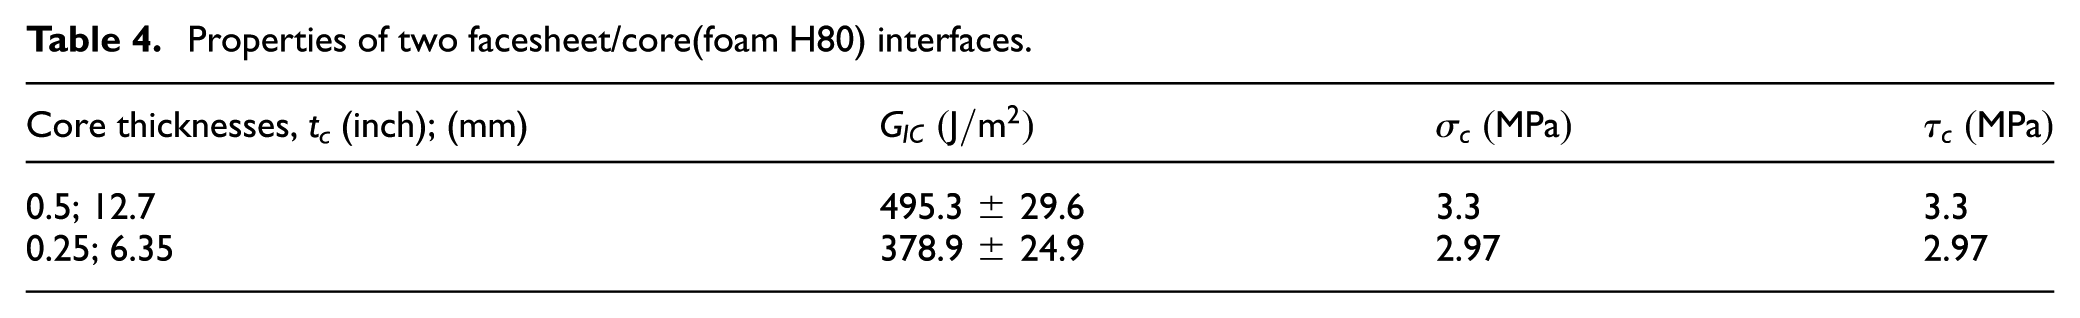
The onset of damage in CZM was predicted using the quadratic failure criterion 23

where
Properties of two facesheet/core(foam H80) interfaces.
To predict the delamination propagation in CZM, Benzeggagh–Kenane (BK) criteria were used. It was established in terms of the ERR of mode I and mode II and the mixed-mode ratio of fracture toughness. It is also the most used propagation laws and implemented in Abaqus as given for 2D formula 23

where
Furthermore, in experiments, it was observed that the crack tends to initiate in the interface and then turn and propagate through the core causing kinking micro-crack status in the core material. Thus, additional failure criteria were required to model this phenomenon. The XFEM with an enriched element was used to model kinking micro-crack in the core material. In the XFEM, the failure mechanism consists of both damage initiation criterion and a damage evolution law. The initiation of crack was modeled with maximum principal stress criterion 23

where

Since the cohesive and core materials are softening, a nonlinear behavior is expected to present in the load–displacement curve and they could cause convergence difficulties in model solution. Therefore, the mesh elements were refined to be for each facesheet and core as 800 and 4000 elements of type CPE4I, respectively. The layers of cohesive were modeled as interface elements with zero thickness in which the upper and lower layers of cohesive were meshed to 250 and 400 elements of type COH2D4, respectively. Indeed, a few increments were enough for the linear region, but much more increments were required to get the delamination response in the softening region of the numerical curve. Thus, a viscosity parameter with a value of 1e−5 was used. The geometrical nonlinear analysis (NLGEOM) option, was activated as the deformation of specimen was expected to have a large opening displacement. The prescribed displacement of (δ = 6 mm) was applied with a quasi-static step after modifying the line search parameters to make the solutions easily converge for such nonlinear problem.
Determination of opening-to-sliding modes of SCB test specimen
The MVCCI method was separately used to investigate whether the test of SCB configurations was in pure opening-mode or in the mixed-mode conditions since it was difficult to define experimentally. The idea was to take advantage of the good correlations of load–displacement curves between the experimental and numerical results for both thick and thin core models. From ABAQUS, nodal forces and relative displacements of the crack tip were obtained along the crack length of the interface element for each core thickness model as in Figure 13. Since the cohesive zone element was modeled with zero thickness, thus, the nodal forces and relative displacements were obtained from the adjacent node of bulk elements. After that, the ERRs were calculated by applying equations (8) and (9) to obtain


where

Sketch of opening elements of (MVCCI) method.
Results and discussion
Experimental results
The total ERR of SCB was calculated using the CCM. For the effects of contact between the facesheet and core, it was not taken into account of these calculations. Figure 14 shows the load–displacement response of the baseline of 6.35 mm (0.25 inch) core thin specimen and resistant curves (R-Curves) of ERR with images depicting the sequence of failure. The initial load versus displacement response was linear, followed by a significant change in slope corresponding to the initiation of crack observed at the edge of the specimen. The crack propagated toward the interface between the foam and the facesheet substrate as the test progressed. The load then began to decrease as the crack opened until the final phase of test. From resistance curves (R-curves), it was found that the total released energy data were initially scattered uniformly around the mean value and then became close to each other in medium crack lengths. At the same level, the rapid load drops in (load–displacement curve) corresponded to crack kinking into the core.

Sequence of failure though the interface zone for SCB thicknesses of tc = 6.35 mm (0.25 inch) and the load–displacement and resistant curves of specimen of core thickness of tc = 6.35 mm (0.25 inch).
The microstructure images of two halves fracture surface (facesheet side and core side) in Figure 15 reveal that in facesheet side images, the fracture surface at the beginning was exposed to tensile tearing force. The crack initiated from the edge of pre-crack (Teflon) as Figure 15(a) and then it propagated into cells of core causing the kinking statue until the middle of crack length where it has more sever kinking as in Figure 15(b). However, in the foam side, the interface surface appears to be identical to fiber side as in Figure 15(c). The interface crack progressed into the core at the pre-crack tip and it maintained the same level of kinking, followed by additional kinking as in Figure 15(d) when it reached the end of the specimen crack length.

Fractography of interface crack of FG/Foam tc = 6.35 mm (0.25 inch) specimen as (a and c) show the crack fields at short crack length and (b and d) show the crack fields at intermediate crack length of the facesheet and foam sides.
Figure 16 shows resistant curves (R-Curves) of ERR and the average of load–displacement curves for specimen classified by the thicker core with tc = 12.7 mm (0.5 inch). It illustrates the total energy versus crack length that the total released energy data were scattered around the mean value along the crack length span, represented to force/displacement graph with no significant crack kinking into the foam. The visual observation showed the crack maintained growth in the interface zone between the facesheet and the foam.

Sequence of failure though the interface zone for SCB thicknesses of tc = 12.7 mm (0.5 inch) inch and the load–displacement and resistant curves of specimen of core thickness of tc = 12.7 mm (0.5 inch).
Furthermore, the interface images of the two halves of the fracture surface (facesheet side and core side) in Figure 17(a) show that the facesheet side, interfacial fracture surface at the pre-crack tip (Teflon line), displays how the crack propagated close to fiber side. It initiated from the edge of pre-crack line (Teflon) and then it closely traveled through the fiber interface side, but with tiny kinking into the foam until the middle of specimen as in Figure 17(b). However, in the foam side as in Figure 17(c) and (d), the fracture surface shows the most of top foam cells containing different levels of resin scrap cross the specimen surface.

Fractography of interface crack of tc = 12.7 mm (0.5 inch) FG/Foam specimen as (a and c) show the crack fields at short crack length and (b and d) show the crack fields at intermediate crack length of the facesheet and foam sides.
Among the SEM investigations of interface specimens, it can be concluded that in the thin specimen tc = 6.35 mm (0.25 inch), the crack kinks into the core and then maintains on the same level of kinking across the specimen. This means the interface crack leaves the interfacial plane resulting in mixed-mode effects along the specimen. The reason could be that the shear force of interface layer was stronger than the shear force of the foam cells. In contrast, in the thick foam specimen tc = 12.7 mm (0.5 inch), the crack was more stable as it propagated through the interfacial plane closely to the facesheet. Indeed, there was some crack kinking but it was very lightly on the surface. This indicates a low value of shear energy to cause crack kinking. Thus, the thick specimen can be considered the best choice of conducting the interface test.
In Figures 14 and 16, it was noted that during measurement of the fracture toughness
Figure 18 illustrates the experimental comparison of ERR of SCB results. It clearly indicates that under variation of foam core thickness, there is no significant difference in the initial stage of the test, but the difference could be significant as the crack length increased. The total average of ERR for thick foam tc = 12.7 mm (0.5 inch) was 495.36 J/m2 with a standard deviation of 29.6 J/m2, whereas total average of ERR for thin foam tc = 6.35 mm (0.25 inch) was 378.97 J/m2 with a standard deviation of 24.9 J/m2. This was consistent with the visual observation that the crack in the thick specimen did not fluctuate from planar behavior as the crack in the thin core specimens. The results support the expected optimization results of determining the upper optimum limit as the best limit of the design test specimen.

Comparison of critical energy release rate versus crack length for SCB test under variation of foam core thicknesses.
Comparisons of experiment versus finite element results
The validation results of experimental and numerical analysis are summarized in Figure 19(a) such that the numerical (P–δ) curves were compared to respective experimental tests. It illustrates the accuracy of agreements along the crack length under the certain involved parameters and mesh density. Good correlation was achieved in both thick and thin core foam specimens.

(a) Experimental and numerical comparisons of load–extension curves of SCB test under variations of foam core thickness. (b) Samples of crack tip during the crack propagation for deformed shape of SCB test with initial micro-kink phenomenon.
Furthermore, it was noted that the finite element model (FEM) was able to track the initial micro-kink crack in the core material in the beginning of the tests as in Figure 19(b). The kinking crack was initially initiated in the core area under the pre-crack line of the interface when the load maximized. Then, it propagated closed to interface area as the crack in cohesive zone propagated further. The effects of crack growth, both cracks, were represented in the load–displacement curve as it slightly decreased as both cracks propagated more. This means that the resistance of damage in core material was incorporated in the overall model response. Therefore, the combination between involved fracture criteria and elastic–plastic core material model were the best way to model such foam core materials.
The results of investigations whether the test of SCB configurations were in pure opening mode or in the mixed mode are presented in Figure 20 after using the MVCCI method. Five points along the crack length for each cored thickness specimens were randomly chosen to identify the fracture energy corresponding to the crack growth. Figure 20(a) shows the total critical ERR

The behavior of energy release rate (ERR) of opening-to sliding modes as function of crack length for five crack tips: (a) the total critical ERR (GTC) versus crack length and (b) The ratio of opening-to sliding modes (GI/GII) versus crack length.
Figure 20(b) shows the relationship of opening mode to the sliding mode
Conclusion
Experimental and numerical studies on sandwich SCB specimens are presented in this work. Experiments were conducted to obtain the opening-mode fracture toughness by characterizing the debonding between the core and the facesheet. The thicknesses of the core and facesheet were optimized by equalizing the bending stiffness matrices through the interface zone. Two different SCBs having two different core material thicknesses were tested. The experimental results showed that the critical ERR could be influenced by core thickness variations. Furthermore, the main objective of the numerical study was to investigate whether the test of the SCB configuration was in pure opening mode or if mixed mode played an important role under the test conditions. The CZM and core material elastic–plastic model in conjunction with fracture criteria were used to validate the entire failure structure response. The validation results predicted load–extension curves in reasonable agreement with actual tests for both specimen SCB geometries. The model also had the ability to predict the initial micro-kink crack under the interface zone as observed in the actual test. The predicted results of opening-to-sliding modes through the interface area were evaluated, resulting in the thick core specimen as the best choice.
Footnotes
Academic Editor: Michal Kuciej
Declaration of conflicting interests
The author(s) declared no potential conflicts of interest with respect to the research, authorship, and/or publication of this article.
Funding
The author(s) disclosed receipt of the following financial support for the research, authorship, and/or publication of this article: The authors would like to thank the Office of the Dean of Engineering at the University of Dayton for funding support.