
Abstract
It is a contradiction to homogeneous material fatigue behavior characterized by widely used linear Paris law, welded-joint fatigue issues need to be reassessed because fatigue crack growth behavior going through heterogeneous region will be different. For a welded joint, log(da/dN) is no longer linearly related to log(ΔK) in heterogeneous region because of the change in fatigue properties resulting from the welding process. Theoretical model of the fatigue crack growth rate without artificial adjustable parameters was proposed by considering the effects of heterogeneity in a welded joint and load-amplitude variation on fatigue crack growth curve. In this fatigue heterogeneous region, the relationship between log(da/dN) and log(ΔK) is similar to a concave-down parabola. Predicted results from the proposed model agreed better with the experimental data obtained from fatigue tests conducted in this study and open published literatures for welded joints in comparison to the widely used Paris model.
Introduction
Fatigue crack growth behaviors have been studied for various types of widely used engineering structural materials in the past several decades, and a number of fatigue rate models have been establish with the help of the stress and strain field ahead of the crack tip together with a suitable failure criterion.1–7 However, most of these fatigue rate models intrinsically contain adjustable material parameters that need to be determined numerically or experimentally. So far, Paris model is the most commonly used model which characterizes materials fatigue behavior, and works well for the second stage of fatigue in which fatigue crack growth rate (da/dN) is nearly linearly correlated with stress intensity factor range (ΔK) in a log–log coordinate space. 3 However, the linear relationship is only for homogeneous materials, thus is not competent enough to characterize heterogeneous materials because of the change in fatigue properties. 8
It is a contradiction to homogeneous material fatigue behavior characterized by widely used linear Paris law, welded-joint fatigue issues need to be reassessed because fatigue crack growth behavior going through heterogeneous region (HR) will be different. For a welded joint, log(da/dN) is no longer linearly related to log(ΔK) in HR because of the change in fatigue properties resulting from the welding process.
Because of its simplicity and wide general applications, Paris law remains to be the most popular fatigue model to quantify fatigue crack growth, 9 and it offers a sound base for modifications and improvements. To account for the effects of various factors on da/dN prediction, a number of modifications to the Paris model have been proposed, for instance, as follows: (1) the fracture toughness of material and the stress ratio during fatigue test were suggested to incorporate in the Paris model as reported in Forman et al.; 10 (2) based on theoretical research and experimental validation, Barter et al. proposed the following form: da/dN = C1a(1 − m*/2) (ΔKeff)m* (C1, a*, m* are constants);11–13 and (3) an effective ΔK (ΔKeff) was used instead of ΔK to account for the effect of crack closure. 14 Due to its simplicity and wide general applications, fatigue Paris model offers a sound base for further modifications and improvements, for example, if “structural fatigue” issues need to be reassessed when fatigue crack growth behavior goes through dissimilar materials (e.g. welded joints).
Different to those aforementioned fatigue models for homogeneous materials, the primary objective of this study is to develop a fatigue rate model to predict the da/dN of the HR in a welded joint under constant amplitude loading with stress ratio (R) of 0, which accounts for both heterogeneity and load-amplitude effects. The da/dN predictions by the commonly used Paris model and the proposed model were compared and validated using open published experimental data.
Fatigue crack growth models
Effect of heterogeneity
Paris model is widely used to characterize material fatigue behavior, and works well for the second stage of fatigue, in which log(da/dN) is nearly linearly correlated with log(ΔK). According to the Paris formulation, da/dN = c (ΔK)m, da/dN gradually increases with increase in ΔK during fatigue crack propagation, which is suitable for homogeneous materials. However, fatigue issues of welded joints need to be reassessed because fatigue crack growth behavior going through HR, for example, heat-affected zone (HAZ), melted parent metal, or welded interfaces, will be different. It is highly likely for HR in a welded joint, log(da/dN) is no longer linearly related to log(ΔK) because of the change in fatigue properties resulting from the welding process; thus, their relationship needs to be reformulated. By taking weld-repaired infrastructure as an example, a transition region exists between weld metal (WM) and infrastructure. Potential problems resulted from welding process, for example, welding defects, cracking, residual stresses, and embrittlement, decrease the fatigue resistance in the transition region. The transition region that may consists of HAZ or part of it, melted parent metal, WM or part of it, and welded interfaces is the HR because of the change in fatigue properties (Figure 1(a)). In this fatigue HR, log(da/dN) is no longer linearly related to log(ΔK) and the potential relationship needs to be reassessed, as shown in Figure 1(b).
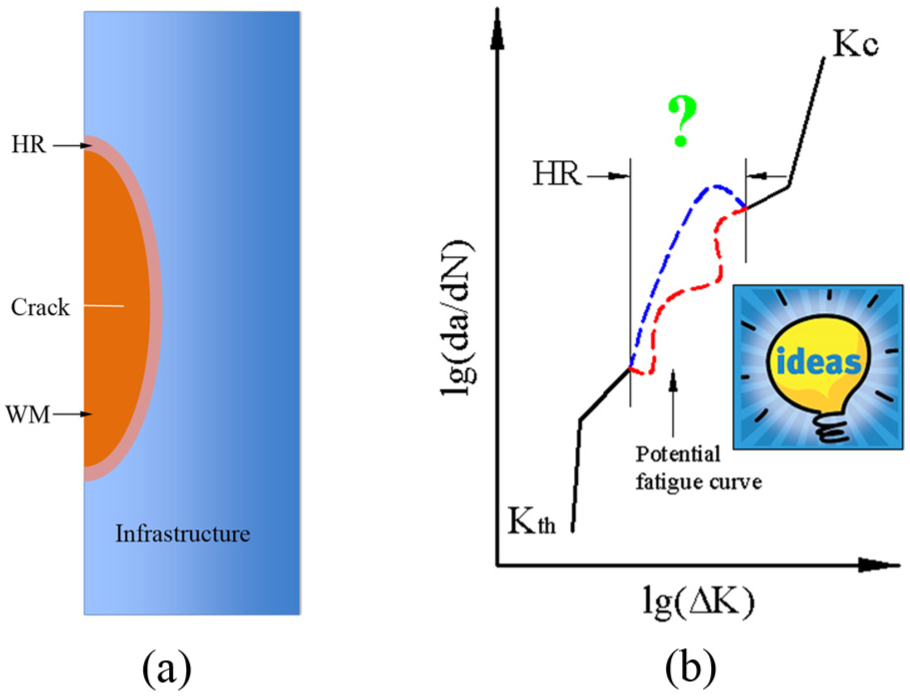
Welded-joint fatigue issues: (a) a weld-repaired infrastructure and (b) the potential da/dN versus ΔK curve.
A multitude of open published experimental data shows that log(da/dN) in fatigue HR of welded joints first increases to a local maximum at a point termed the weakest point of fatigue performance in this study, then decreases gradually to a local minimum along with the increase in log(ΔK),15–18 and the relationship between log(da/dN) and log(ΔK) is similar to a concave-down parabola. Assuming a parabolic fit for log(da/dN)–log(ΔK) concave-down, da/dN for the HR of a welded joint can be defined as

where “a,”“b,” and “c” are parameters related to the configuration and dimensions of a welded joint, and the weakest point of fatigue performance in the welded joint.
The potential HR includes WM or part of it, melted parent metal, HAZ or part of it, and weld interface(s). According to equation (1), the log(da/dN)–log(ΔK) curve from the HR of a welded joint is an ideal concave-down parabola. It should be mentioned that the fatigue curve of the HR may be part of a parabola and will depend on the configuration, dimensions, and weakest-point site of a welded joint.
Effect of load-amplitude variation
Because equation (1) is an empirical model, fatigue data at a given load amplitude (e.g. P0) are needed to determine the values of parameters “a0,”“b0,” and “c0” in equation (1) by curve fitting. The values of these parameters are subsequently used to calculate new values “a1,”“b1,” and “c1” to predict da/dN at a new load amplitude (e.g. P1). The procedural steps for the model formulation are as follows.
According to linear elastic fracture mechanics, the stress components at a point near the crack tip during fatigue tensile tests with load amplitude P can be written as follows 19

where KI is the stress intensity factor and
For a given crack length, the above equations indicate that the stress components near the crack tip are functions of KI only because

According to equations (2) and (3), the stress value at the crack tip, which corresponds to da/dN, increases with applied load amplitude P; that is, for
Because the fatigue crack growth curve from the HR of a welded joint is a concave-down parabola in the log–log coordinate space, log(da/dN) increases nonlinearly with the increase in log(ΔK) as the applied load amplitude increases. As a result, the crack growth curves from fatigue testing with different load amplitudes cannot coincide for identical welded joints as shown in Figure 2. For a specific welded joint, the fatigue resistance of the material ahead of the crack is governed hypothetically by the local stress range perpendicular to the crack growth direction for tensile (Mode I) loading.
3
Taking as an example a point in the fatigue crack growth path marked “A” in Figure 2, the ΔK and da/dN are

The effect of load-amplitude variation on the fatigue curve translation in log–log coordinate space.
It should be mentioned that even after the translation of the log(da/dN)–log(ΔK) curve, the shape of the curve is preserved. Additionally, the symmetry axis and the vertex of the new fatigue curve for P1 are different from those of the original fatigue curve for P0. In other words, the proposed model given by equation (1) is suitable for the HR of a welded joint, but the parameters “a,”“b,” and “c” are different for different load amplitudes even for the exact same sample.
On a concave-down parabola, the dependent variable reaches its maximum on the axis of symmetry from the view of mathematical knowledge. For example, for a load amplitude of P0, log(da/dN) reaches its local maximum “O,” at which point the following relationship, is satisfied

Likewise, for a load amplitude of P1, log(da/dN) reaches its local maximum “O′,” at which point the following relationship, is satisfied
For an identical sample, the weakest point of fatigue performance is fixed; thus, the fatigue crack length at which the local (log(da/dN))max occurs is a constant at different load amplitude which corresponds to a fixed “a” in equation (3).
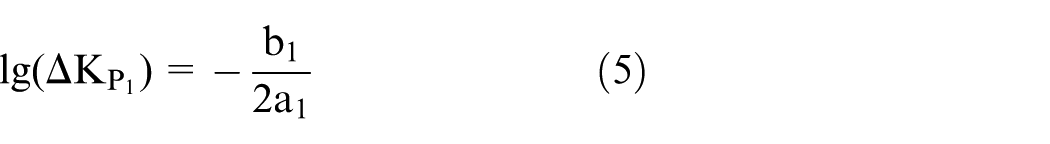
For a specific welded-joint sample, the parameters “B,”“W,” and “d” are constants and independent of the load amplitude; moreover, the site of the weakest point, and thus the local (log(da/dN))max is fixed. Combining equations (3)–(5), the following can be obtained
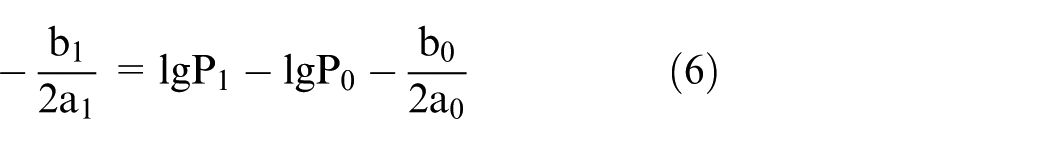
Considering only a narrow band near the weakest point in a welded joint, it is assumed that the material properties within the narrow band are homogeneous, which is suitable for the Paris model. As for the narrow band, the following formulation can be obtained according to da/dN under fatigue test at load amplitudes of P0 and P1

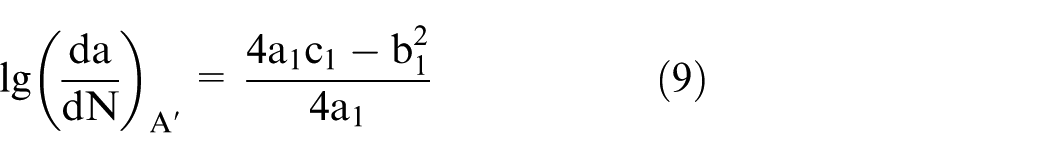
According to proposed model, the local (log(da/dN))max at load amplitudes P0 and P1 are, respectively

Incorporating equations (8) and (9) into equation (7), the following formulation can be obtained

As the amplitude of cyclic loading increased from P0 to P1, the parabolic fatigue curve is translated to the upper right of the coordinate space. The transformation of the fatigue curve due to the change in load amplitude is a result of the increased ΔK at corresponding points, which leads to higher da/dN. In addition, the parabola is stretched by a coefficient of more than one. Based on a number of experimental data obtained from welded joints, the coefficient of transformation of the fatigue curve can be defined by the arithmetic mean of the two load amplitudes; thus, the following formulation can be obtained

In summary, the proposed model accounting for load-amplitude effects, based on the form of da/dN at a given load amplitude P0, can be described by equations (6), (10), and (11).
Validation of the theoretical models
Fatigue model considering heterogeneity
To emphasize influence of the fatigue rate model on curve fitting, the fittings of log(da/dN)–log(ΔK) to the proposed model for the HR of three welded joints and to the Paris model have been compared with the experimental data of fatigue tests from literatures16,17,20 at a given load amplitude (Figures 3–5).

Comparison of fatigue rate model fitting and experimental data for API 5L X65 weldment after hydrogen-charging in Tsay et al. 16 (a) Comparison of Paris model fitting and experimental data and (b) comparison of proposed model fitting and experimental data.

Comparison of fatigue rate model fitting and experimental data for EH36 TMCP steel weldment in Tsay et al. 16 (a) Comparison of Paris model fitting and experimental data and (b) comparison of proposed model fitting and experimental data.
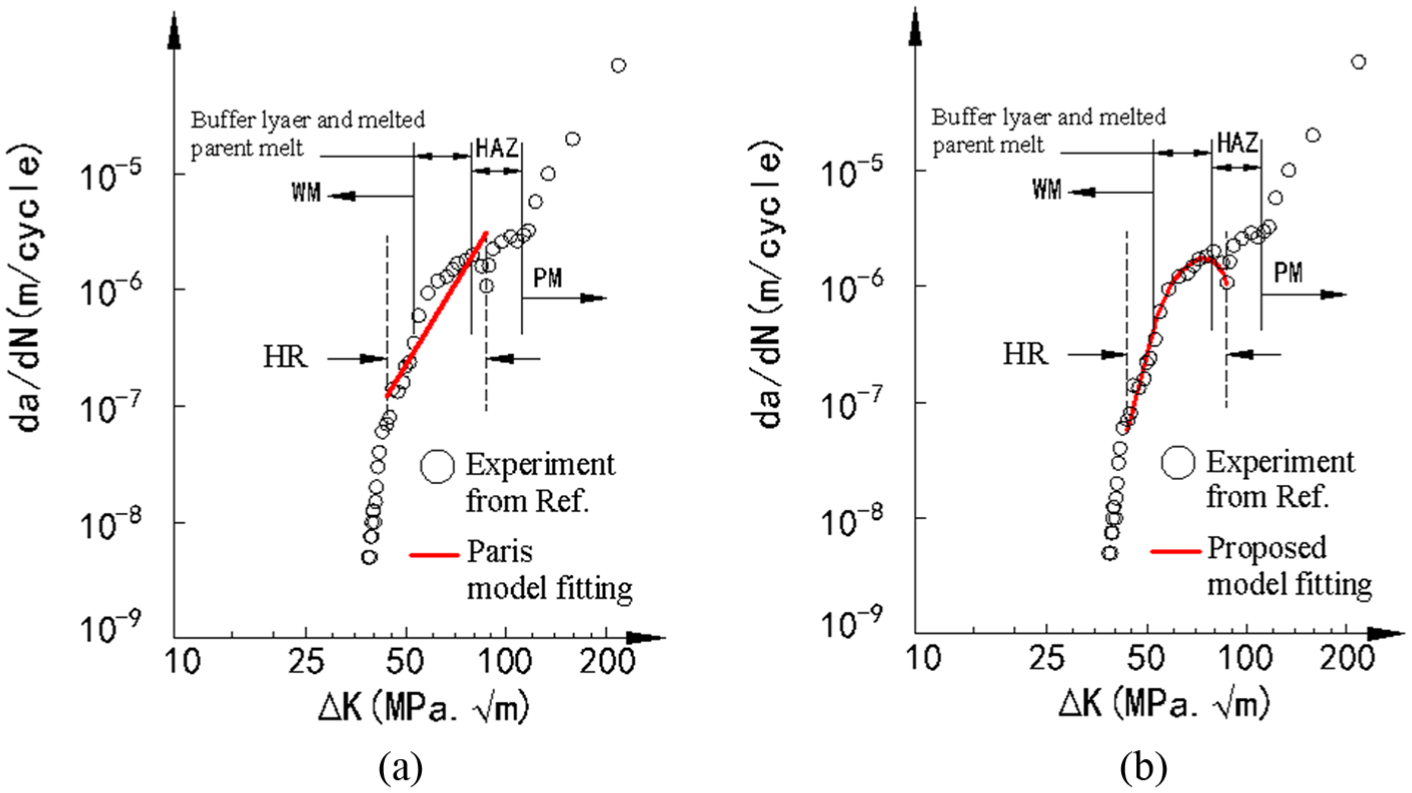
Comparison of fatigue rate model fitting and experimental data for weld-repaired Bisplate80 with a soft buffer layer in Zhang et al. 20 (a) Comparison of Paris model fitting and experimental data (PM: parent metal) and (b) comparison of proposed model fitting and experimental data.
Obviously, the commonly used Paris law fails to predict the da/dN in the HR of the welded joints indicating the linear relationship is not competent enough to predict fatigue rate from heterogeneous materials (e.g. welded joints). That is because welded-joint fatigue issues belong to structural fatigue; thus, the fatigue crack growth behavior going through HR will be different because of the change in fatigue resistance resulting from the welding process. Comparison of Figures 3–5 illustrates how each model affects the fitting results of da/dN in the HR of welded joints. For each of the three welded joints, the fitting fatigue curve from the proposed model, which accounts for heterogeneity of fatigue properties, are better consonant with the open published experimental data from fatigue tests in comparison to the Paris model. As the log(da/dN)–log(ΔK) curve is a typical concave-down parabola, da/dN increases to a local (log(da/dN))max at a point termed the weakest point of fatigue performance, then decreases gradually to a local (log(da/dN))min, and finally returns to its steady-state rate as the crack advances through the HR.
Fatigue model considering heterogeneity and amplitude effects
To emphasize the effects of both heterogeneity and load-amplitude variation on da/dN prediction, fatigue tests were carried out for identically samples under the same fatigue loading conditions but at different load amplitude, 25 and 30 kN in this section. In present section, fatigue data at a given load amplitude (P = P0 = 25 kN) are used to determine the values of parameters “a0,”“b0,” and “c0” in equation (1) by curve fitting. The values of these parameters are subsequently used to calculate new values “a1,”“b1,” and “c1” to predict da/dN at a new load amplitude (P = P1 = 30 kN).
Specimen and fatigue test
The parent metal (PM) employed in this study was Bisplate80. Flux cored arc welding was used as the joining process for these components while CO2 was used as the shielding gas. Extended compact tension (E-CT) specimens with through-the-thickness notches for fatigue were machined according to the specifications of ASTM E647 (23) (10 mm thick). The welded blocks were then sliced and machined into the required dimensions as shown in Figure 6. The WM region was centered in the gauge length of the tensile specimens, and the crack length was measured from the loading line.

Schematic representation showing welded-joint specimen: (a) welding process, (b) weld-block after removing weld reinforcement, (c) E-CT sample of welded HSLA, and (d) schematic of E-CT specimen.
The fatigue crack growth tests were performed at room temperature using hydraulic fatigue testing machine Instron 8501 with a load capacity of 100 kN. Constant amplitude tensile loads with a haversine waveform at a frequency of 5 Hz were used with the R of 0 throughout the tests. The Paris fatigue curves for weld-repaired Bisplate80 were measured twice with two identical specimens under the same loading condition but at different load amplitude, 25 and 30 kN, respectively.
Fatigue model prediction and experimental data
The predicted log(da/dN)–log(ΔK) curve obtained from proposed model prediction (accounting for both heterogeneity and fatigue-curve translation effects) for the HR of weld-repaired Bisplate80 (Figure 7) and that obtained from the Paris model prediction (Figure 8) have been compared with the experimental data of fatigue test at a load amplitude of P = 30 kN (named as P1). Comparison between Figures 7 and 8 illustrates how fatigue model affects the predicting results of da/dN in the HR of a welded joint as the predicted results from the proposed model agree better with the experimental data in comparison to the Paris model.
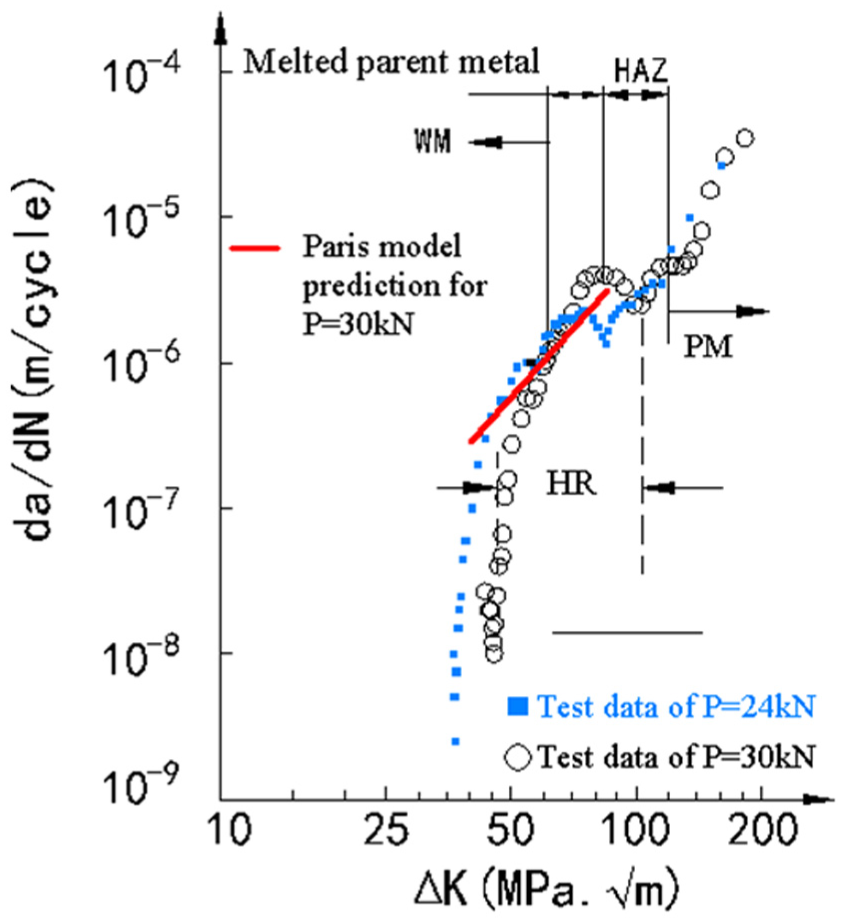
Comparison of Paris model prediction and experimental da/dN of weld-repaired Bisplate80 at a load amplitude of P = 30 kN.
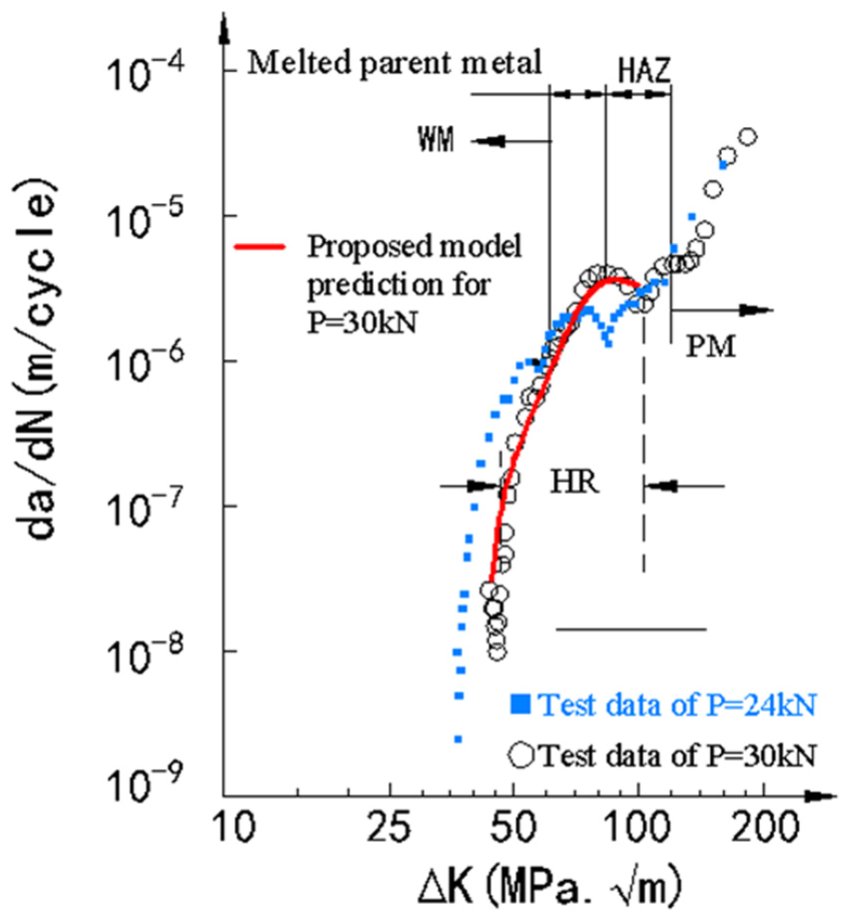
Comparison of proposed model prediction and experimental da/dN of weld-repaired Bisplate80 at a load amplitude of P = 30 kN.
The da/dN was calculated for the weld-repaired Bisplate80 under constant amplitude fatigue at a load amplitude P1 = 30 kN according to the Paris formula, and is

Based on the da/dN formulations for the weld-repaired Bisplate80 under constant amplitude fatigue at a given load amplitude P0 = 25 kN, the values of the corresponding new parameters “a1,”“b1,” and “c1” for the proposed model were calculated from the expressions in equations (6), (10), and (11). Thus, under constant amplitude fatigue at P = 30 kN, da/dN formulation for the HR of the weld-repaired Bisplate80 was obtained and is

For the weld-repaired Bisplate80, the correlation coefficient
Discussion
Experimental results reported in a number of references indicate that the log(da/dN)–log(ΔK) curve could be modeled as a concave-down parabola for the HR in a welded joint. Due to the heterogeneity resulted from welding process, the value of log(da/dN) changes nonlinearly with log(ΔK) in welded joints, which is strongly dependent on the configuration of the joint. For a given welded joint, the fatigue crack growth curve translation is closely related to the load amplitude owing to the nonlinear relation between log(da/dN) and log(ΔK), and fatigue test results at a known load amplitude are needed to calculate the parameters in equation (1) for any other load amplitude. Basing on fatigue data at known load amplitude, this study was to propose a fatigue rate model to predict the da/dN of the HR in a welded joint at any new load amplitude. Compared to the Paris fatigue model, the proposed model is superior in three respects: (1) it is capable of predicting the relationship of the da/dN to the ΔK for the H-region of welded joints, (2) it accounts for both joint heterogeneity and load-amplitude effects, and (3) it did not contain any material parameters that required prior experimental or numerical determination.
For the weld-repaired Bisplate80 in this study, the value of the mean square errors σ associated with the proposed model is one order of magnitude smaller than the corresponding value for the Paris model. The results also show that the correlation coefficient γ, indicating the agreement between experimental and predicted results, for the proposed model is above 0.93, which is much higher than the corresponding value of approximately 0.74 for the Paris model. Hence, it can be concluded that the accuracy of the proposed model is better than the widely used Paris model.
Conclusion
To emphasize the influence of the fatigue rate model on da/dN prediction accuracy, a novel fatigue crack growth model for HR of welded joints was proposed in this study and validated in details using experimental data of constant amplitude fatigue tests (open published and carried out in the study). From this study, the following conclusions can be obtained:
Predicted results from the proposed model agreed better with the experimental data in comparison to the widely used Paris model.
Fatigue data at a given load amplitude are needed to determine the values of parameters related to the configuration and dimensions of a welded joint and the weakest point of fatigue performance in the welded joint by curve fitting and then to calculate new values of parameters to predict da/dN at any new load amplitude.
A fairly good agreement existed between the predicted da/dN–ΔK relationship and the corresponding experimental data. Satisfactory agreement was obtained for HR of a welded joint.
It should also be mentioned that the influences of crack closure, residual stresses, and the load history have not been considered in this study. As the above-mentioned factors are structure/specimen geometry dependent, this complicated issue is beyond the scope of this article and can only be dealt with in the future in a separate paper.
Footnotes
Acknowledgements
The authors would like to thank the University of Western Australia for the weld sample preparation and part of fatigue tests.
Academic Editor: Chow-Shing Shin
Author’s Note
Authors Chunguo Zhang and Jizhuang Hui contributed equally to this work.
Declaration of conflicting interests
The author(s) declared no potential conflicts of interest with respect to the research, authorship, and/or publication of this article.
Funding
The author(s) disclosed receipt of the following financial support for the research, authorship, and/or publication of this article: This work was supported by the National Nature Science Foundation of China (No. 51405029), Shaanxi Natural Science Foundation (No. 2016JQ5020), and Chang’an University (Nos 310825153510 and 310825151038).