
Abstract
Bubble pulsation is known to occur as a result of high-voltage discharge in water. Due to advantages such as long duration and significant bubble pulsation production, this technique is widely used in industrial production. Bubble pulsation is directly reflected by the pulsation efficiency, which is mainly embodied in the transformation efficiency from the high-voltage discharge energy to the bubble expansion energy, as well as the residual rate of bubble pulsation energy. In this study, high-voltage discharge was used in water to form pulsating bubbles. The vertical displacement of water was restricted by the experimental equipment, so horizontal displacement was mainly generated. Therefore, any influence caused by the ascending motion of the bubbles could be effectively ignored. Consequently, the bubble pulsation process could be measured at stable hydraulic pressure. The pressure, bubble pulsation period and pulsation times generated by bubble expansion were measured in our experiments. The transient voltage and current were also measured. The relationship between bubble pulsation efficiency with discharge voltage and hydrostatic pressure was analyzed by combining the experimental results with results from simulations of bubble pulsation expansion.
Keywords
Introduction
Isotropic water in a region with finite boundary is restrained by the boundary condition and is considered to be nonfree field water. The high-voltage breakdown of a liquid in a narrow space has tremendous energy. So far, this technique has been used in resource prospecting, shale gas exploration, gas treatment, and rust removal of long pipelines. Its potential in engineering applications is significant. For national defense purposes, high-voltage discharge in high-hydraulic pressure environments can also be used as an approximate simulation of a deep water explosion. 1 High-voltage discharge in water is mainly due to the breakdown of water by point discharge. The discharge current can reach hundreds of thousands of amperes. 2 The plasma is formed in a discharge channel. The sudden release of significant amounts of energy in the discharge channel generates shock waves and bubble pulsation. The duration of the shock wave is on the level of microseconds, while the duration of the bubble pulsation is on the level of milliseconds. 3 The duration of bubble pulsation is relatively long, and it is one of the release modes of the energy, thus resulting in structural damage through secondary vibrations to the surrounding area. Therefore, the study of bubble pulsation and the development of the electrohydraulic effect have attracted considerable research attention.
Fundamentals of bubble pulsation formation
Bubbles are formed in channels at a late stage of the discharge process. The expansion of bubbles still continues when the energy infiltration is finished. At the beginning, the pressure in the bubbles is higher than the hydrostatic pressure, which causes motion of the liquid. Eventually, the pressure in the bubbles becomes equal to the hydrostatic pressure. However, bubble expansion still continues due to the inertia effect and only stops when the kinetic energy of moving water is completely transformed into the displacement potential energy of the bubbles. At this time, however, the bubble pressure is far lower than the hydrostatic pressure. As a result, reverse flow of the liquid is generated under the effect of hydrostatic pressure. The potential energy of the bubbles is retransformed into the kinetic energy of the moving liquid. Bubble pressure increases dramatically when the bubbles close, which regenerates the reverse motion of the liquid. This process is repeated in the liquid in the form of several continuous attenuation pulses. 4 Figure 1 shows the schematic diagram of bubble pulsation in the liquid. The approximate formula for the maximum expansion energy of bubbles in a nonfree field can be deduced by basic theory. The law of bubble pulsation efficiency can be obtained by combining the relevant experimental data.

Schematic diagram of bubble pulsation in the liquid.
Calculation of the maximum expansion energy of bubble pulsation
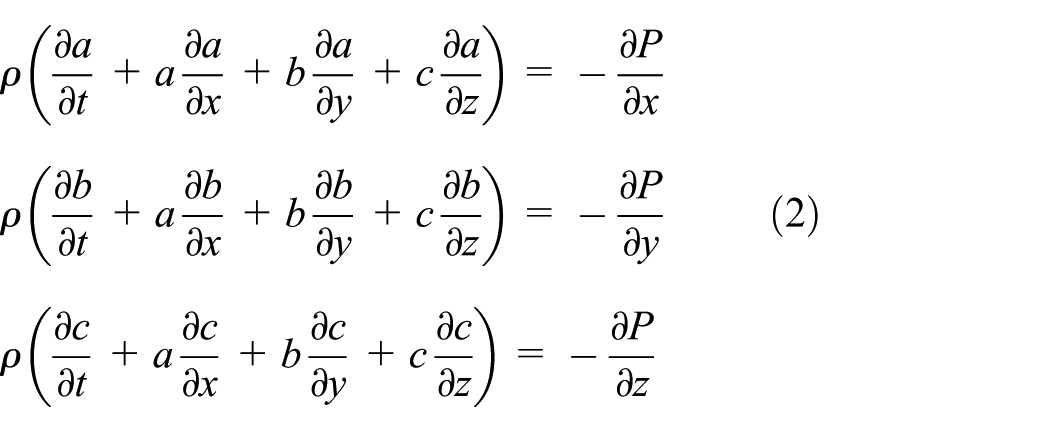
The basic laws of physics are first simplified to the general mathematical formulas of fluid mechanics.5,6 The viscous and thermal conductivity properties of water are ignored in order to idealize the dielectric constant, which is considered as an ideal, continuously incompressible fluid. We start with the most fundamental law of conservation of mass. A coordinate system is established using the x-, y-, and z-axes, which correspond to the motion velocity components of three particles, that is, a, b, and c, respectively. In the experimental setup, the circular cross section of a steel tube is created based on the y- and z-axes, while the normal direction of the cross section is along the x-axis. During the motion along the direction of the x-axis, the fluid flowing through the finite region within an infinitesimal period (dt) is equal to the mass difference of the fluid flowing through two planes with an area of dydz

where ρ is the density of liquid. The law of conservation of mass here can be described as the sum of each component of total fluid flow, which is equal to the mass increment of fluid that is pushed out from the region. As a result, the following equation can be obtained

According to the D’Alembert theory, the projection of the resultant force of each external force on the x-axis is equal to the projection of the inertia force on the same axis, that is,
This study is focused on the horizontal movement of bubbles in water. In other words, the depth of the bubbles is constant, and the initial hydrostatic pressure (P0) in a random direction is also the same. Since b and c in the direction of the y- and z-axes are much smaller than a, a rigid boundary condition,
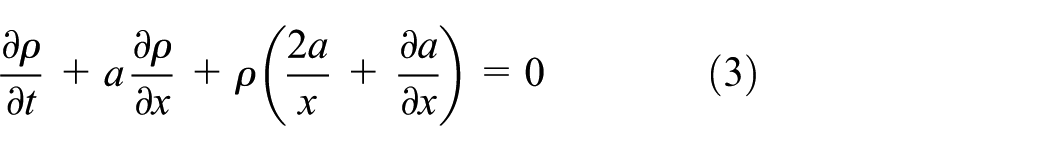
The change in water density (ρ) is about 10−4ρ when the pressure is changed by 0.1 MPa. At low hydraulic pressure, water dielectric can be understood as incompressible fluid.
7
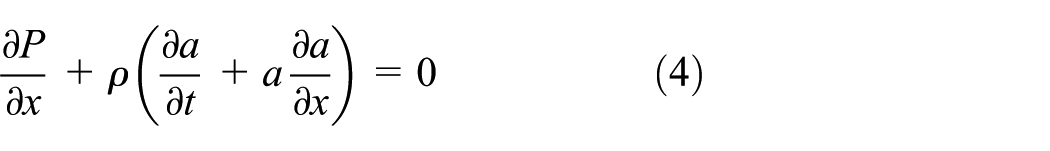
Since the derivative of ρ in equation (3) is very small and can be ignored, and the following equation can be obtained,

where M is the integration constant (in the subsequent calculation of differential equation, constant M is ignored), and
Bubble pulsation pressure can be approximately considered as the pressure of water generated by the spherical bubble expansion. Using this simplified calculation, the relationship between bubble pulsation period and maximum expansion diameter can be obtained. The volume of the element is approximately equal to

If the process is the adiabatic process, E(x) is the expansion work of bubbles

We consider the expansion work at a random time as the difference between the initial internal (Q) and residual internal (Q′) energies

Then, combining equations (6)–(8), the following equation can be obtained

The residual internal energy (Q′) of bubbles is very small after most expansion processes and can be fully ignored. In this case, the maximum bubble volume is reached when dx/dt = 0. The relative maximum bubble diameter is xm. After substituting this into equation (9), the following equation can be obtained

Equation (10) can be substituted into equation (9), and Q′ in equation (9) can be ignored. A simplified equation can be obtained after separation of the variables

where x0 is the initial radial dimension of bubbles formed at the moment when the experiment is started. For a simpler calculation, the integral term in equation (11) is rewritten to the sum of an incomplete β function B(p, q), 8 and the following equation can be obtained.
The β function can be expressed as

where e = (x/xm)3. The values of the β function are listed according to the discrete values of p. However, p = 5/6 and q = 1/2 in the list are not met in practical terms, which agrees with the numerical integral. Under the special situation of x = xm, that is, e = 1, it is found that β = B1(5/6, 1/2) = 2.2405. 9 A value of x = 0 means no expansion of the bubbles, while x = xm means the maximum expansion volume of the bubbles. The required time (t) of x from 0 to xm is approximately equal to half of a bubble pulsation period (T), that is, t = T/2. Since the relative radial displacement (x0) of initial bubbles is very small, the approximate relational expression between xm and T can be obtained by substituting equation (12) into equation (11)
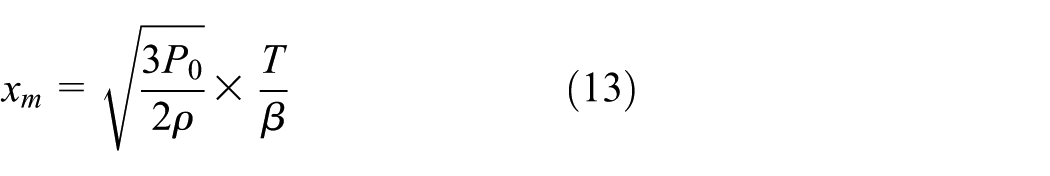
By combining this with the approximate formula for bubble expansion energy in a water dielectric,
10
that is,

Experimental
Experimental principles
Studies on the motion of bubbles in water in nonfree fields are usually based on that the density of water around the bubbles is in accordance with the theory of incompressible fluids, and that the bubbles exhibit whole continuity in movement. It has been confirmed that the treatment of water dielectrics as incompressible fluids is applicable for the general properties of moving bubbles at the expansion stage. 11 Therefore, these theories are suitable for the calculation of the variable pulsation period. After their generation, the vertical displacement of bubbles would be observed in a water dielectric. The relative vertical displacement is very large especially when the bubbles are small, so the corresponding hydrostatic pressure is changed. If the radial motion is mainly generated during bubble expansion, and the vertical displacement is very small, the simplest approximation would be to study the bubble motion. 12 Therefore, a special instrument is required to keep the relatively stable hydrostatic pressure around the bubbles and restrict bubbles from ascending to eliminate interference during the bubble pulsation. In addition, the pressure waveform and pulsation period generated by the bubble expansion can be measured under various discharge voltages and hydrostatic pressure conditions.
Experimental system
A picture of the real electrical power unit with high-voltage pulse is shown in Figure 2. It can provide DC high voltage in the range of 6–15 kV. The rated capacitance was 60 µF, and the energy storage limit was 7000 J. This energy was enough to form large-volume bubbles. The electrodes were made of two stainless steel bars. The parallel space between the positive and negative electrodes was 5 mm as shown in Figure 3. The voltage threshold can be set manually. When the threshold setting is 8 kV, the voltage may rise up to 8 kV to trigger discharge. The self-triggering switch, as shown in Figure 4, can effectively reduce errors caused by artificial triggering. The instantaneous discharge of electrodes in water was conducted using a transmission cable. The discharge process was recorded by the test system.

Picture of the real electrical power unit with high-voltage pulse used in this work.

Picture of the real electrode and its structural diagram.

Self-triggering discharge switch.
Figure 5 shows a schematic diagram of the bubble pulsation test platform under high-voltage discharge in water. The pulsation pressure and period were measured using this platform. The main instrument was entirely made of high-strength carbon steel. The inner diameter, outer diameter, and length of the tube were 100, 135, and 4000 mm, respectively. The parallel electrodes were located in the center of the tube. The macropore sponge was installed on the bottom to effectively eliminate the interference caused by the bottom reflection of shock waves. 13 The hydrostatic pressure in the tube was adjusted using a pressure pump to reach the preset environment. The distance of the piezoresistive sensors (labeled as 1 and 2 in Figure 5) to the electrode was 1 m. The signal was transmitted to the data acquisition recorder by a sensor to measure the pressure–time curve of bubble pulsation.

Schematic diagram of the bubble pulsation test under high-voltage discharge in water.
The test system was a key component in guaranteeing experimental quality. Strong electromagnetic radiation was usually accompanied by the electrode discharge breakdown process. Moreover, the breakdown process had short duration and strong pulse characteristics. As a result, the requirements of the frequency response and interference resistance were high for the test system. 14 The test system in this study was composed of six parts, namely, a CY200 piezoresistive pressure sensor, a Rogowski coil, a P6015A high-voltage probe, a DSO6014A oscilloscope, a TST6250 transient recorder, and a computer.
The CY200 piezoresistive pressure sensor had a measuring range of 50 MPa, a natural frequency of 1 MHz, and a comprehensive accuracy of 0.1% full scale (FS). A structural analysis of the sensor revealed advantages such as a simple structure. Therefore, it could be stably used in environments with vibrations, shocks, and strong interference, and its reliability is still relatively high under severe experimental conditions. 15
The sensitivity of Rogowski coil was 38 kA/V with a discharge current of<100 kA. The working performance of the coil was reliable with a wide band response and high measurement precision. The Rogowski coil was very suitable for the measurement of pulse current, especially for large currents. 16
The P6015A high-voltage probe was produced by Tektronix Co., Ltd. The maximum input voltage was 20 kV, the band width was 75 MHz, the attenuation multiple was 1000×, the rise time was 4 ns, and the compensation range was 7–49 pF. The transient voltage could be accurately collected under the experimental conditions. 17
The DSO6014A oscilloscope was manufactured by Agilent Technologies. There were four acquisition channels. The sampling rate was 4 GSa/s. For the TST6250 transient recorder, the maximum sampling rate was 20 Msps, the band width was 1 MHz, and the comprehensive precision was 0.1% FS.
The test system in this study had significant advantages such as simple corollary equipment, high sampling frequency, and good interference resistance. It could effectively avoid the shortcomings of piezoelectric sensors, which include low sampling frequency, easy electromagnetic interference of sensor and charge amplifier, and difficultly in accurately measuring the static pressure. 18 The test system strongly suggested that the experimental results were precise.
Experimental scheme
Our experiments were mainly focused on the bubble pulsation caused by the discharge breakdown of the water dielectric under different discharge voltages and hydrostatic pressure conditions. The influence of discharge voltage and hydrostatic pressure on the bubble pulsation was investigated, 19 which was mainly reflected in two aspects, namely, the transformation of electrical energy to bubble expansion energy and the attenuation of the bubble pulsation energy. The capacitance was constant at 60 µF. The whole tube was fully filled with water. The external hydrostatic pressures used were 0, 0.1, 0.2, 0.5, and 1 MPa. (For nominal hydraulic pressure 0 MPa, the actual value was approximately 0.02 MPa.) The charging voltage (U) was also classified into five gradients, namely, 7, 8, 9, 11, and 13 kV. A total of 25 groups of independent experiments were conducted in this study based on different hydrostatic pressures and discharge voltages (five gradients for hydrostatic pressure and five gradients for discharge voltage). Six discharge tests were performed for each experiment group.
If the energy of water under high-voltage discharge breakdown was directly calculated using
The simulated calculation results of the bubble expansion energy indicated that it was directly related to the bubble pulsation period, hydrostatic pressure, and water density. Therefore, the bubble pulsation time, hydrostatic pressure, and corresponding water dielectric density must be accurately obtained in the experiments.
Experimental results and discussion
Discharge characteristics
During the dielectric breakdown of the water by electrode discharge, significant energy was released within a very short time. The high-voltage pulse discharge was decided by the differential equation of a resistor–inductor–capacitor (RLC) loop 20

where R(t) is the total resistance in the discharge process, L is the inductance of the wire, and C is the rated capacitance. L is a very small constant and C = 60 µF. Since the electrode spacing (5 mm) was relatively small, the equivalent resistance could be preliminarily determined by the initial voltage and liquid conductivity (γ = 1.3 S/m for tap water). The consumed electrical energy in the dielectric breakdown of water by discharge could be obtained from
Time-history function graphs of I(t) and U(t) were collected by the multi-channel oscilloscope and are shown in Figures 6 and 7, respectively. The discharge voltage was 11 kV. The yellow and green curves represent I(t) and U(t), respectively.

Plot of the I(t) function.

Plot of the U(t) function.
The measured data were analyzed by regression. 21 It was found that the discharge energy (E) was mainly affected by the discharge voltage, and the influence of hydrostatic pressure within 1 MPa was small. 22 The discharge energy (E) for charging voltage (U) 7000, 8000, 9000, 11,000, and 13,000 V was about 1300, 1800, 2200, 3200, and 4700 J, respectively, as shown in Figure 8. The standard deviations were within 5%.

Plot of charging voltage (U) and discharge energy (E).
Pressure–time curves of bubble pulsation and pulsation period
The typical pressure–time curve for a shock wave and bubble pulsation is shown in Figure 9. The distance to the electrode was 1 m, the discharge voltage was 7 kV, and the hydrostatic pressure was 0.5 MPa. The first part of the curve was divided into the signal of the electromagnetic interference and the pressure waveform of the shock wave. The latter part of the curve was the pressure waveform of bubble pulsation, 23 and this is the main focus of this article.
Pressure–time curve of a shock wave and bubble pulsation.
The pressure curve for bubble pulsation visually reflected the pressure peak and attenuation process of the pulsation period. The period from the formation of the shock wave to the first pressure peak of bubble pulsation is called the first pulsation period 24 and is denoted as T1; the period from the first pressure peak to the second pressure peak of bubble pulsation is called the second pulsation period and is denoted as T2; and similarly, the third and fourth pulsation periods are denoted as T3 and T4, respectively. A schematic diagram of the bubble pulsation periods is shown in Figure 10. Each circle in Figure 10 represents a whole bubble pulsation.

Schematic diagram of bubble pulsation periods.
The change in parameters in each bubble pulsation period was recorded in the experiments, and the first pulsation period, T1, could directly reflect the maximum expansion energy of bubble pulsation. Since the energy attenuation occurred in periods of T2, T3, and T4, these periods were not considered for the calculation of maximum expansion energy of bubble pulsation. Figure 11 presents the data for the first pulsation period (T1).

First pulsation period (T1).
It was found that T1 increased with increasing discharge voltage under a fixed hydrostatic pressure. Moreover, the rate of increase for the pulsation period decreased with increasing hydrostatic pressure. T1 was greatly affected by the hydrostatic pressure. The pulsation period was significantly reduced after applying hydrostatic pressure.
The hydrostatic pressure could effectively maintain the bubble pulsation. For example, the discharge voltage was constant at 7 kV in Figures 10, 12, and 13, but as the hydrostatic pressure increased gradually, the number of bubble pulsations gradually increased from 3 to 9, where the number of bubble pulsations corresponding to 0.1, 0.5, and 1 MPa hydrostatic pressure was 3, 5, and 9, respectively. This was also the case for other discharge parameters.

Pressure–time curve of bubble pulsation with a hydrostatic pressure of 0.1 MPa.

Pressure–time curve of bubble pulsation with a hydrostatic pressure of 1 MPa.
The above experiments and findings basically reflect the bubble pulsation process. However, deeper and more intuitive explanations are needed for the bubble pulsation efficiency. Therefore, two aspects were introduced to our analysis, namely, the transformation efficiency from electrical energy to bubble expansion energy and the residual rate of bubble pulsation energy.
Transformation efficiency from electrical energy to bubble expansion energy
According to the experimental data and expansion theory of bubbles in water, the approximate value of the maximum bubble pulsation expansion energy (Eb) could be obtained. The discharge energy (E) could be measured by the electrical instruments. The transformation efficiency from electrical energy to bubble expansion energy is denoted as η, and

as shown in Figure 14.
Transformation efficiency from electrical energy to bubble expansion energy.
The transformation efficiency (η) from electrical energy to bubble expansion energy was always between 10‰ and 30‰. When the supply voltage was increased, η also increased significantly. Compared to the discharge with 0 MPa hydrostatic pressure, the transformation efficiencies with the other hydrostatic pressures were clearly higher. Under the conditions with fixed discharge voltage, the transformation efficiency was improved by gradually increasing hydrostatic pressure, and the higher the hydrostatic pressure, the slower the increasing rate of η. When hydrostatic pressure was below 0.5 MPa, the increase in discharge voltage and hydrostatic pressure could substantially enhance η. If the hydrostatic pressure exceeded 0.5 MPa, the increase in hydrostatic pressure could not promote the significant increase in η in experiments; at this time, η was mainly affected by the discharge voltage.
Residual rate of bubble pulsation energy
The residual rate of bubble pulsation energy is the ratio of secondary pulsation energy (Eb2) to the first pulsation energy (Eb1), which is denoted as µ, and

Plot of the residual rates of bubble pulsation energy at different (a) hydrostatic pressures and (b) discharge voltages.
The residual rate (µ) of bubble pulsation energy was between 30% and 35% when the hydrostatic pressure was 0 MPa. Moreover, µ obviously increased with increasing discharge voltage. When the hydrostatic pressure was 0.1, 0.2, 0.5, and 1 MPa, µ was between 45% and 60%. In addition, µ marginally increased with increasing discharge voltage, and the increasing trend was flat. The relationship between discharge voltage and the residual rate of bubble pulsation energy was linear like.
The residual rate increased with increasing hydrostatic pressure at a fixed discharge voltage. Moreover, the rate of increase for µ gradually leveled off with increasing hydrostatic pressure. The increase in µ was rapid when the hydrostatic pressure was in the range of 0–0.2 MPa, that is, the sensitive stage. When the hydrostatic pressure was higher than 0.2 MPa, µ tended toward stability, that is, the smooth stage. These results show that hydrostatic pressure had a significant influence on the residual rate of bubble pulsation energy.
The number of bubble pulsations correlated with the residual rates of pulsation energy. For discharge voltages of 7, 8, 9, 11, and 13 kV, the number of bubble pulsations was two or three times when µ was in the range of 30%–45%. The number of pulsations changed to between three and five times when µ was about 50%–57%. If µ was about 60%, the number of bubble pulsations was more than five times. The number of bubble pulsations was also related to the hydrostatic pressure, which will be discussed in the follow-up studies.
Conclusion
The transformation efficiency (η) from electrical energy to the maximum bubble pulsation expansion energy was between 10‰ and 30‰. The discharge voltage was the major influencing factor for η. The discharge voltage in our experiments showed a positive correlation relationship with η. The value of η with hydrostatic pressure was obviously higher than that without hydrostatic pressure. When the hydrostatic pressure was gradually increased from 0.5 to 1 MPa, the value of η began to increase slowly. The hydrostatic pressure was a secondary factor when it was >0.5 MPa. Therefore, high voltage was advantageous to the transformation efficiency from electrical energy to bubble energy.
The residual rate (µ) of bubble pulsation energy was found to be between 30% and 60%. When the hydrostatic pressure was fixed, µ gently increased with increasing discharge voltage. The higher the hydrostatic pressure, the lower the influence of voltage on µ. The discharge voltage was a secondary factor for µ. When the discharge voltage was fixed, the value of µ increased with increasing hydrostatic pressure. If the hydrostatic pressure exceeded 0.2 MPa, the increase in µ gradually tended toward stability. The hydrostatic pressure was the major influencing factor for µ. High hydrostatic pressure was advantageous for the persistence of bubble pulsation.
The number of bubble pulsations was related to the hydrostatic pressure and discharge voltage. The hydrostatic pressure played the main role in maintaining the number of bubble pulsation. The higher the hydrostatic pressure, the better the lasting effect of pulsation. The increase in discharge voltage was advantageous for improving the duration of bubble pulsation, but the effect was modest; therefore, the discharge voltage was a secondary influencing factor.
The second pulsation expansion energy of the bubbles was about 30%–60% of the first energy. The ratio of third pulsation energy to the second energy was about 15%–40%, which is clearly much lower than the first ratio. In other words, µ showed secondary attenuation in this process. Thus, it could be seen that the increase in bubble pulsation times caused the acceleration of the attenuation rate of pulsation energy. The bubble pulsation effect was most useful for the first and second pulsations.
Footnotes
Acknowledgements
Shaoqing Niu and Xiaoguang Li helped in processing some of the data used in this article, and their assistance is gratefully acknowledged.
Academic Editor: Luís Godinho
Declaration of conflicting interests
The author(s) declared no potential conflicts of interest with respect to the research, authorship, and/or publication of this article.
Funding
The author(s) disclosed receipt of the following financial support for the research, authorship, and/or publication of this article: This work was supported by the Shanxi Coalbed Methane Foundation of China (2012012012).