
Abstract
The capacity of the ship-lock at the Three Gorges Dam has become bottleneck of waterway transport and caused serious congestion. In this article, a continual network design model is established to solve the problem with minimizing the transport cost and environmental emission as well as infrastructure construction cost. In this bi-level model, the upper model gives the schemes of ship-lock expansion or construction of pass-dam highway. The lower model assigns the containers in the multi-mode network and calculates the transport cost, environmental emission, and construction investment. The solution algorithm to the model is proposed. In the numerical study, scenario analyses are done to evaluate the schemes and determine the optimal one in the context of different traffic demands. The result shows that expanding the ship-lock is better than constructing pass-dam highway.
Keywords
Introduction
The economic and social growth in the Basin of Yangtze River leads to enormous logistics and traffic demands. The volumes of the induced passenger and freight traffic have increased continually during last 20 years. Currently, the regional freight traffic is about 40% of the national total. The average annual waterborne freights are over 1.5 billion tons and the container throughputs of the ports along the main channel of the River are over 8 million twenty-foot equivalent units (TEUs). It can be predicted that the transport demands will grow further as the strategy of development of the economic belt along Yangtze River is put into effect soundly, which puts forward higher requirements to the highway and waterway transport systems along the River.
Although the River channel has provided a satisfied transport service for the development of the economic belt, the transport capacity of the ship-locks at Three Gorges Dam has become the bottleneck of the shipping. Due to the traffic increment, the ships have to wait longer and longer to pass the dam lock due to the capacity constraints. The average waiting time is about 30 h, sometimes even up to 3–10 days.
Some solutions are put forth to solve the bottleneck problem, such as (1) lockage scheduling optimization to raise the efficiency, (2) expansion of the ship-locks, and (3) construction of pass-dam highway to shift a part of cargos from waterway to highway. The last one is a newly proposed idea. In this way, some cargos transported by ship originally will be unloaded from the ships at the port on the upstream of the Dam and loaded on trucks passing the Dam through dedicated highway to the destinations. As a result, the number of ships reaching to the Dam will decrease and cargoes both on ships and trucks may reach the destinations with less time.
For lockage scheduling, some literatures studied how to maximize the lock area utilization 1 and minimize the waiting time. 2 Dai and Schonfeld 3 developed a numerical method for estimating delays on congested waterways. Wang et al. 4 established a novel operation cost model of the scheduling problem of the lockage at Three Gorges Dam and applied a data-driven approach to solve the problem. Pang and Wu 5 constructed an optimization model for jointly scheduling the double-line ship-lock based on the nonlinear goal programming. Bugarski et al. 6 presented the development of a decision support system (DSS) to manage the ship-locks. Two criteria, which reflect the interests of both shippers and lock owner, are presented and used in parallel with the fuzzy DSS. Yuan et al. 7 established a lockage scheduling model based on the requirement of scheduling procedure in Three Gorges Dam system and proposed chaotic embedded particle swarm algorithm to solve the problem. Optimization of the lockage scheduling 8 can hardly work in case that the ship-locks are in the saturation due to the heavy traffic demand.
The expansion of the ship-locks or the construction of pass-dam highway can be seen as a continuous network design problem. 9 The objective of a continuous network design problem is usually to minimize the sum of the total travel times and investment costs.10–15 Yao et al. 16 presented a robust optimization model taking into account the stochastic travel time to satisfy the demand of passengers and provide reliable transit service. Chiou 17 presented a conjugate sub-gradient projection method to efficiently solve the continuous network design problem with global convergence. Wang et al. 18 proposed a combined model by joining link-based credit charge and capacity improvement. They discussed urban road network improvement problem from both supply and demands sides. Yu et al. 19 proposed a bi-level programming model to solve the design problem for bus lane distribution in multi-modal transport networks aiming at minimizing the average travel time of travelers. Wang et al. 20 examined the continuous network design problem with different value of time for multiple user classes. In our study, the objective consists of three parts, namely, minimization of total freight transport costs, minimization of the cost for the ship-lock expansion and dedicated highway construction, and minimization of the cost to compensate the emitted CO2. The CO2 emission is a key performance index for transport network because massive manpower and resources are needed to treat the pollution. Carbon emissions can be used to examine whether the network design is environmentally friendly.
In most countries, vehicles have become the most important source of pollution.21,22 Feng and Timmermans 23 formulated a policy decision support tool that allows decision makers to identify maximum mobility levels under environmental capacity constraints. Some literatures considered the CO2 emissions when optimizing the network. Yang et al. 24 proposed a novel carbon tax–constrained city logistics network planning model with rational hypotheses, parameter design, and deployment of low-carbon resources. Chaabane et al. 25 introduced a framework to evaluate the trade-offs between economic and environmental objectives under various cost and operating strategies. Bouchery and Fransoo 26 studied the dynamics of intermodal transport solutions in the context of hinterland networks in terms of cost, CO2 emissions, and modal shift. Janic 27 proposed a model for calculating the full costs of an intermodal and road network. The cost included the impact of the network on society and the environment. Craig et al. 28 calculated the CO2 emission intensity of intermodal transport in the United States, based on a data set of more than 400,000 intermodal shipments. Zhang et al. 29 wanted to include the environmental cost in optimally designing an intermodal network.
By now, few literatures have quantificationally analyzed the congestion problem at the Three Gorges Dam from the perspective of CO2 emission. In this article, to find out which costs less and is environmentally friendly, ship-lock expansion or pass-dam highway construction, we use the three costs to compare the two disputable methods.
This article is structured as follows. In section “Model development,” topology relationship between waterway and highway is established. Meanwhile, the links’ traffic attributes in the network are determined. Then, a bi-level programming model considering transport cost, construction cost, and CO2 emission is proposed. In section “Solution algorithm,” to solve the model, the particle swarm optimization is introduced. In section “Numerical analysis,” the model is applied to the Yangtze River Economic Belt. The result shows that ship-lock expansion would be the optimal solution in long term. Conclusions and some discussions are stated in section “Conclusion.”
Model development
By analyzing the path selection behaviors of cargos on a multi-mode network, we can know the cargo flows and traffic attributes on links. Then, externalities such as environmental load induced by freight transport can be calculated, which may be used to evaluate the network schemes and transport operations. The problem of continuous network design is a bi-level programming problem. The upper level hopes to make an efficient transport system through infrastructure construction. The lower level wants to choose a path that can make them reach the destination with the least cost and time. In order to establish the bi-level model, a transport network consisting of different traffic models should be built first.
Network construction
The container liner lines on the River and the highways in the same corridor constitute the container transport network. Containers in the region could be transported from origins to destinations by the waterway and highway intermodal network. To analyze the path selection behaviors, we propose a method to mathematically represent the intermodal network, namely, establishment of topological relation between waterway and highway and determination of the traffic attributes of the corresponding links.
The main work for building network is to separate a port city into two nodes which represent the origin and transit nodes, respectively, and then to use the method shown in Figure 1 to construct the multi-mode network. In Figure 1, the upper side shows the abstracted path, where containers are moved from City 1 to City 2. The lower side shows the details of the path, where containers are moved from City 1 to Port 1 by highway first and then are loaded on ships and transported to Port 2, and finally, they are delivered to City 2 by trucks. We use A representing the network and use

Method to represent the waterway and highway mixed network.
The impedance functions of different links are defined as follows:
1. For links other than transit ones

This type of links includes waterway and highway links. Here,
Equation (1) shows the impedance function of links of waterway or highway, which is related to monetary cost and time cost. The second item in the right side means the capacity limitation of the dam lock; when the demand is smaller than the capacity
2. For transit links

here,
The bi-level programming model
There are two parts in the bi-level programming model. The upper model aims to find a solution of network scheme that minimizes the total cost, including transport cost, construction cost, and environmental cost of CO2 emissions. The lower level model is used to assign the container cargoes onto the network.
The upper model
The costs to be minimized for the network construction and transport operation consist of three parts, namely, time and monetary costs for transporting all cargoes from origins to destinations, investment cost for expansion of ship-lock and construction of pass-dam highway, and money used to treat the CO2 emitted from trucks or ships. The formulas of the upper model are as follows


here,
The lower model
The user equilibrium traffic assignment model based on the multi-mode network is as follows


here,
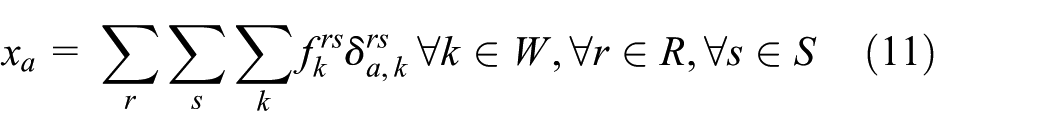
CO2 emission calculation
Almost all motor vehicles are driven by fossil fuels, thus the emission of motor vehicle traffic is equal to the consumed fuel multiplied by the emission factor. 30 The CO2 emission factor primarily depends on the carbon content of the fuel. The model for calculating the CO2 emitted by the traffic on the network is as follows
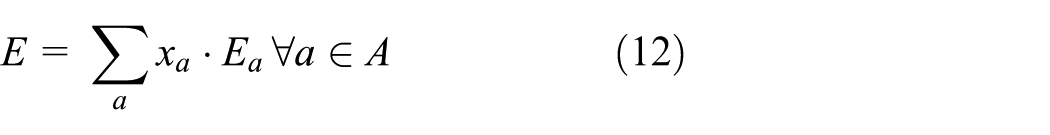

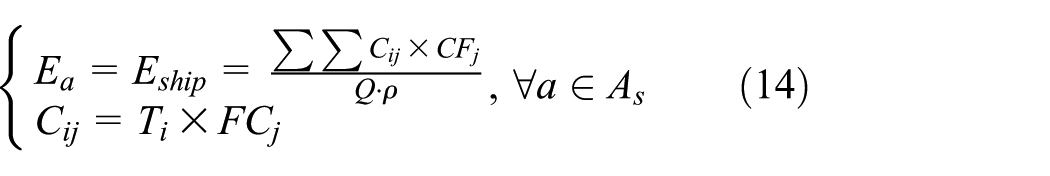
here, E is the total CO2 emissions of the traffic on the network; equation (13) is used to calculate the emission factor
Equation (14) is used to calculate the emission factor
Transfer factors (CF) of some types of fuels.

Solution algorithm
To solve the bi-level programming model, we use two algorithms: the Frank–Wolfe algorithm for the lower model and the particle swarm optimization (PSO) for the upper model.
Frank–Wolfe algorithm
The Frank–Wolfe algorithm is an iterative first-order optimization algorithm for the constrained convex optimization problem. The method was originally proposed by Marguerite Frank and Philip Wolfe. 31 In each round of iteration, the algorithm considers a linear approximation of the objective function and moves slightly toward a minimizer of this linear function. Its main steps are as follows:
Step 1. Initialization. For
Step 2. Update impedance of each link as
Step 3. Find the direction of next iteration. With the updated
Step 4. Step size determination. Use dichotomization to find
Step 5. Calculate the new start for next iteration
Step 6. Judge whether the calculation can be terminated. If
Particle swarm optimization
PSO is an evolutionary algorithm based on iteration. It is originally attributed to Kennedy and Eberhart. 32 A basic variant of the PSO algorithm works by having a population (called a swarm) of candidate solutions (called particles). These particles are moved around in the search space according to a few simple formulas. The movements of the particles are guided by their own best known position in the search space as well as the entire swarm’s best known position. When improved positions are being discovered, these will then come to guide the movements of the swarm. The process is repeated, and thus, it is hoped that a satisfied solution will eventually be found. The velocity vector and position vector of particles are updated as follows


here, i is the serial number of particle, k is the number of iteration,
The process of solution algorithm
In this article, a position vector of particle represents a solution to the problem. A solution represents the scale of ship-lock expansion or pass-dam highway construction. The general structure of solution algorithm is as follows:
Step 1. Determine the population size
Step 2. Calculate new velocity for each particle by equation (15). Calculate the new position for each particle by equation (16).
Step 3. According to the new position, use F-W algorithm to calculate the container flows of each particle. Calculate the fitness value for all particles based on container flows. Update
Step 4. Judgment of termination. If
Step 5. Output the best solution.
Numerical analysis
Needed data
In total, 13 major ports (Shanghai, Zhangjiagang, Nanjing, Wuhu, Anqing, Jiujiang, Huangshi, Wuhan, Yueyang, Jingzhou, Yichang, Zigui, and Chongqing) on the Yangtze River are chosen as the port nodes for container waterway transport. And 28 inland cities (Anqing, Changde, Chengdu, Chuzhou, Ezhou, Guiyang, Hangzhou, Hefei, Huzhou, Huangshi, Jingmen, Jingzhou, Jingdezhen, Jiujiang, Nanchang, Nanchong, Nanjing, Shanghai, Wuxi, Wuhu, Wuhan, Xiaogan, Yangzhou, Yichang, Yueyang, Zhangjiagang, Changsha, and Chongqing) in the Yangtze River Basin are chosen as the city nodes. They are also the origins/destinations of the being transported containers. The data needed for the calculation include container OD flows, highway network, shipping network, freight rates, port charges, and ships’ specification.
OD flows
It is hard to get accurate container OD flows directly. Moreover, due to its minor role, we use average growth coefficient model to estimate the OD flows between the 28 cities based on the container throughput of the 13 ports on the Yangtze River.
Transport distance and cost on roadways
First, we digitize the highway network and then calculate the shortest path and transport distance between two nodes. Finally, we get the transport cost matrix of the 28 cities.
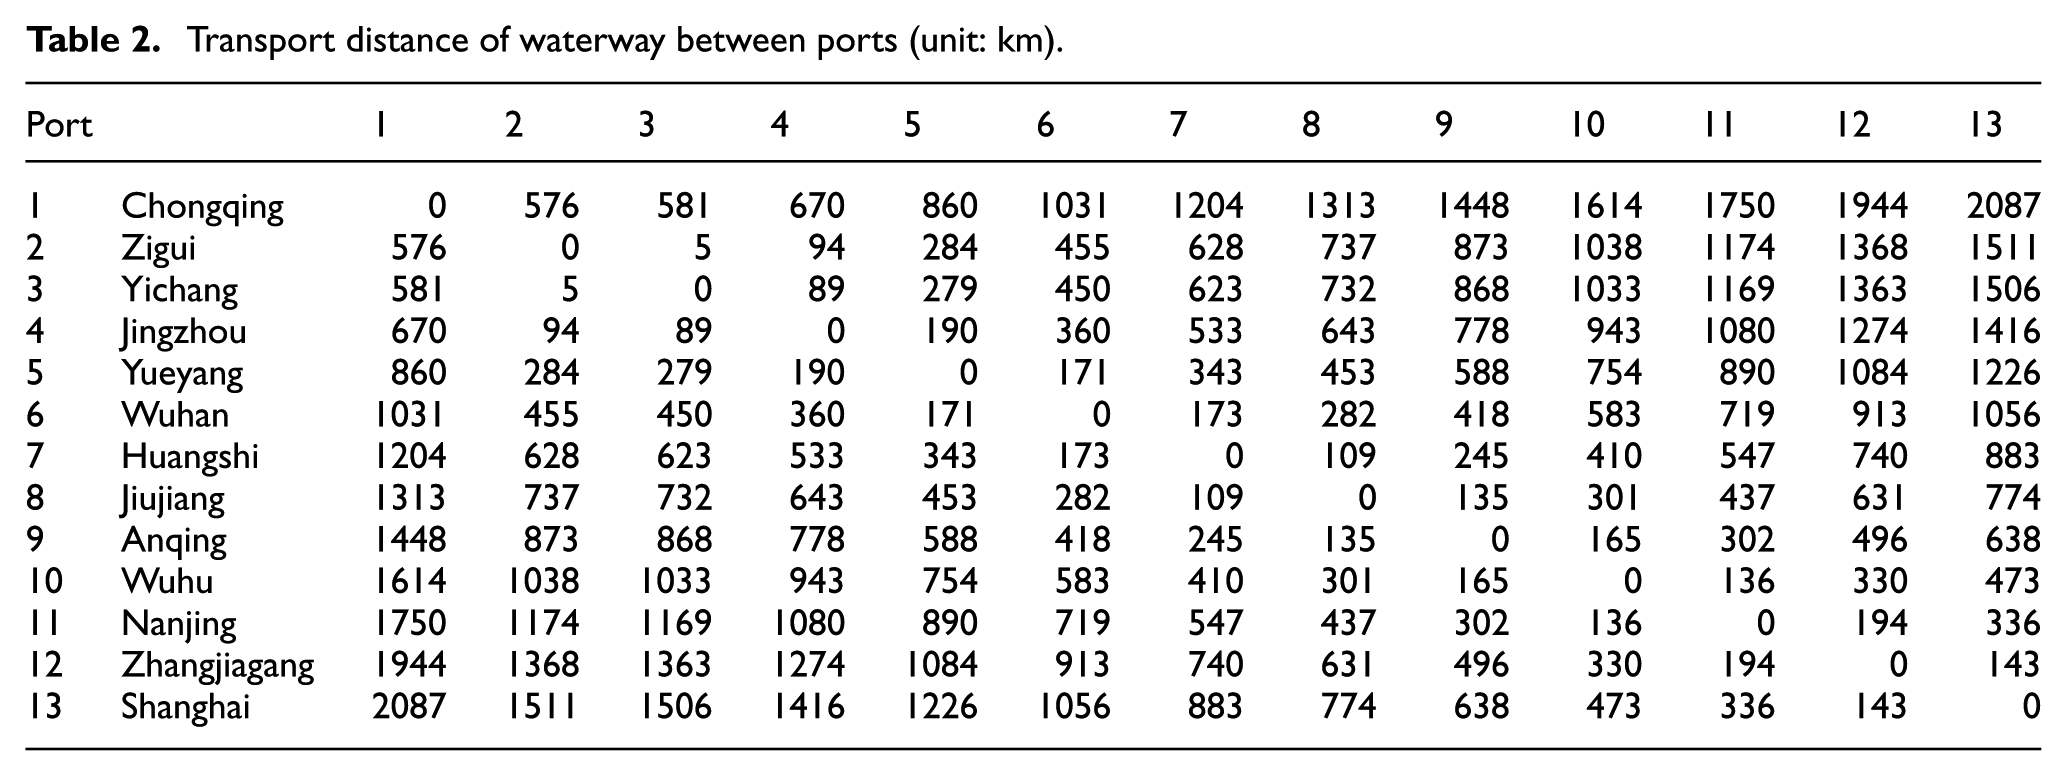
Transport distance and cost of waterway
With the similar method, we get distance matrix of the 13 ports (Table 2). Shipping costs between ports can be calculated based on the distance and unit freight cost. Meanwhile, the collected port charges and reloading costs at each port are shown in Table 3.
Transport distance of waterway between ports (unit: km).
Charges at ports.

TEU: twenty-foot equivalent unit.
Ship specifications
In recent years, with the waterway deepening of the Yangtze River, the maximum ship that can go through has become bigger. It is supposed that container ships with capacity of 325 TEU are used. The specifications are shown in Table 4.
Specification of the ship.

Analysis of results
Based on the capacities of the ship-lock and the pass-dam highway, the model is solved to obtain the link flows on the multi-mode network, which are shown in Figure 2, and the corresponding carbon emissions are shown in Figure 3.
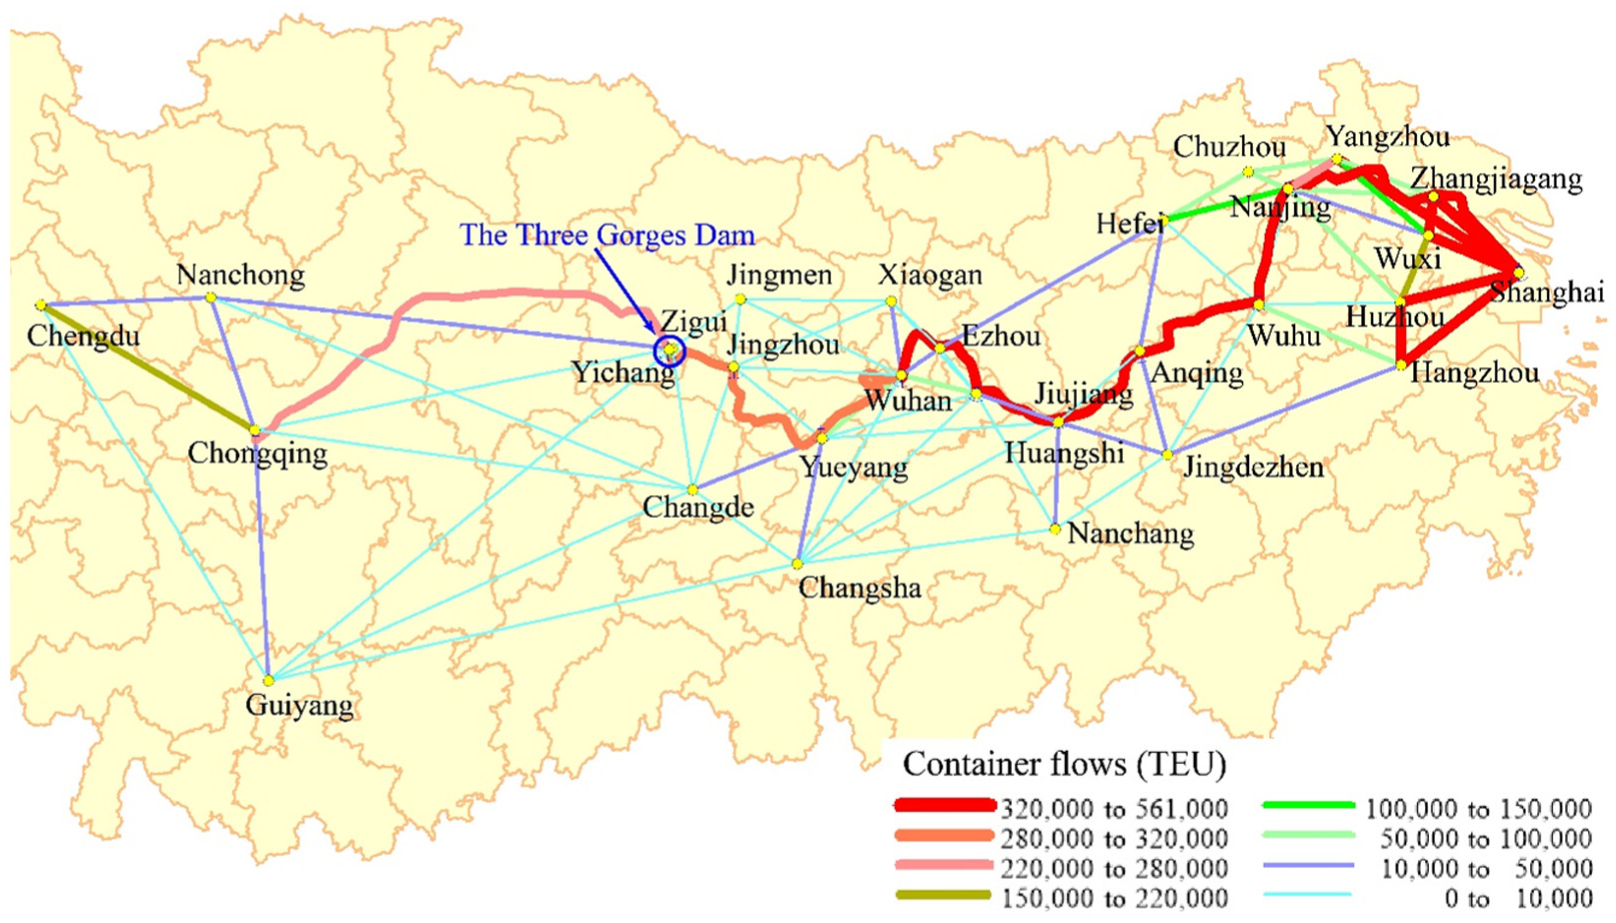
Traffic flows of containers in the Yangtze River Basin.

CO2 emitted from container transportation.
It can be seen from Figure 2 that total container flows in the Yangtze River Basin are 3.8 million TEUs, in which container turnover of the waterway is 800 million TEU-km, while container turnover of the highway is 700 million TEU-km. The containers between the upper and middle reaches of the River are 275,000 TEUs, in which 250,000 containers are transported by waterway, accounting for 91% of the total. It can be said that the River is the core transport corridor for the upper and middle reaches. In the lower reaches, such as Wuhu-Zhangjiagang, more than 400,000 TEUs are transported by waterway, while no highway link will carry more than 100,000 TEUs in the corresponding region. The multi-mode network can be regarded as a hub-and-broke one, mainly based on waterway and with highway as the supplementary. The ship-lock link is represented by waterway link from Yichang port to Zigui port. The containers on the waterway link at the upper stream of the ship-lock are 250,000 TEUs and the containers on the waterway link at the lower stream of ship-lock are 280,000 TEUs, while the containers on the ship-lock link are 200,000 TEUs only. It means that about 20% of the containers choose other paths instead of waterway to go over the Three Gorges Dam.
Comparing Figures 2 and 3, it can be seen that the CO2 emitted from transport is directly related to traffic volume and moving distance. The larger the traffic volume, the more the CO2 will be emitted. The longer the container is transported, the more the CO2 will be emitted. Emission from waterway transport is much less than that from highway. For example, the traffic on link from Chongqing port to Zigui port is 250,000 TEUs and the distance is 576 km. The traffic on link from Chongqing to Chengdu is 190,000 TEUs and the distance is 283 km. Although the former link has more traffic and is longer, the CO2 emissions are 19,000 t, only 39% of the latter. It can be seen that transporting containers by trucks generates about six times more CO2 than that by ships.
In order to find the best solution to the network design problem, we solve the model under several scenarios of traffic increments. Considering that infrastructure construction should be able to work many years and traffic increments would be large, we set four scenarios, namely, (1) without increment, (2) increase by 15%, (3) increase by 30%, and (4) increase by 50%. We set
Solutions under the four scenarios (million Yuan).

For Scenario 1, the optimum solution is “Do Nothing,” and the transport and environmental costs are 3577.26 and 7825.10 million Yuan, respectively. For Scenario 2, the corresponding costs of the “Do Nothing” and the “Expansion by 20% (optimum solution)” are 4114.91/8999.77 and 4087.84/8961.78 million Yuan, respectively. Although 40 million Yuan is spent for the expansion, the “Value of the Objective Function” is 25.06 million Yuan less. It means under the optimum solution, the net profit of the investment of the 40 million Yuan is 25.06 million Yuan.
Similarly, in Scenario 3, the net profit of the optimum solution is 52.98 million Yuan. And in Scenario 4, the net profit of the investment of the 120 million Yuan is 72.75 million Yuan. It can be seen that as the traffic increases, the ship-lock should be expanded, and the construction of pass-dam highway is never the solution. We take Scenario 3 as an example to analyze the reasons. For Scenario 3, the costs and benefits of the four expansion schemes of the ship-lock are shown in Figure 4, and the costs and benefits of the four construction schemes of the pass-dam highway are shown in Figure 5, where the benefit means the saved transport cost or environmental cost, while the construction cost is considered as the negative benefit.

Construction costs and induced benefits of lock expansion.

Costs and benefits caused by pass-dam highway construction.
From Figure 4, it can be seen that both environmental and transport benefit increase due to ship-lock expansion, and the total benefit goes up until the point of extending the ship-lock by 40%. After that, the saved costs cannot offset the construction cost. Thus, extending the ship-lock by 40% is the optimum solution for Scenario 3. In the optimum solution, the expansion will cost 80 million Yuan and may save 38.95 and 94.03 million Yuan for transport and environmental costs, respectively, in 1 year. The total annual benefit is 52.98 million Yuan. Although the net benefit decreases after the point of extending the ship-lock by 40%, it remains positive as long as the ship-lock is extended. The reason is that expansion of ship-lock enlarges waterway’s capacity and makes more container traffic shift from highway to waterway, which is much cheaper and environment friendly.
In Figure 5, the net benefit keeps going down due to the construction of the pass-dam highway. Taking the point of increasing the capacity of the pass-dam highway by 40% as an example, we can see that the construction cost is 64 million Yuan and can save 11.05 million Yuan for container transport in 1 year. However, environment benefit is −4.25 million Yuan. As a result, the annual net benefit is −57.20 million Yuan. It can be seen that construction of pass-dam highway can save the transport cost because the expended highway may attract container traffic from waterway to alleviate the congestion. However, environmental cost will increase because more containers will be transported by highway. As a result, the net benefit is never positive. It is found that the annual net benefit may decrease 15 million Yuan due to the 10% increment in highway capacity.
The reasons in other scenarios are similar. In Scenario 2, the optimum solution is to expand the ship-lock by 20%. Construction of pass-dam highway needs investment and cannot bring enough transport and environmental benefits. Therefore, the net benefit of building pass-dam highway is negative. In Scenario 4, the traffic demand is increased by 50%, and the optimum solution is to expand the ship-lock by 60%. The result indicates that larger ship-lock can generate more benefits when the traffic demand increases. However, in Scenario 1, the optimum solution is “Do Nothing.” Although expanding ship-lock can also decrease the transport cost and environmental cost, the benefits are less than the investment due to the small traffic demand.
To sum up, it can be seen that expansion of ship-lock can not only reduce transport cost but also reduce environment cost. Meanwhile, the expansion may meet the needs well in the future. Construction of pass-dam highway can alleviate the congestion but generates much more environmental load, thus it is not an environment friendly solution.
Conclusion
We dealt with the bottleneck problem of the transport capacity of the ship-lock at the Three Gorges Dam. To find the optimal solution based on the general idea of solving the problem by expanding the ship-lock capacity or constructing pass-dam highway, we built a bi-level programming model, where the upper model optimizes the expansion or construction scheme, while the lower model finds users for the travel paths. The objective of the model is to minimize the total costs, which include the infrastructure construction cost, transport cost, and environmental cost induced by container transport. To solve the bi-level model, we design a particle swarm algorithm. According to the calculated results, some findings are as follows:
The Yangtze River waterway has advantages in saving transport cost and reducing environmental load. It is worth to expand the ship-lock at the Three Gorges Dam.
Pass-dam transport can alleviate the traffic congestion at the Three Gorges Dam in short term. However, development of pass-dam transport will increase the mode share of highway to lead more environmental load.
Developing waterway transport by expanding the ship-lock can not only solve the traffic congestion problem but also reduce carbon emissions from container transport. Moreover, the transport cost can also be reduced because of the increase in the mode share of the waterway transport.
Footnotes
Academic Editor: Gang Chen
Declaration of conflicting interests
The author(s) declared no potential conflicts of interest with respect to the research, authorship, and/or publication of this article.
Funding
The author(s) disclosed receipt of the following financial support for the research, authorship, and/or publication of this article: This research is supported by the Fundamental Research Funds for the Central Universities (Grant No. 3132016303).