
Abstract
This study aims to provide a current survey on the situation of freeway accidents in China. The results show that the accident rate, death toll, injury toll, and direct loss of property are 3.2, 8.4, 7.2, and 24.3 times that of the average for an ordinary highway in China. Freeway accidents occur mainly in Southern (20.77%) and Central (20.2%) China. With detailed data from Guangdong Province, the number of accidents in freeways with 80 km/h design speed (29.58/km/103 pcu) was more than three times that in freeways with design speed of 100 km/h (9.54/km/103 pcu) and 120 km/h (9.42/km/103 pcu). The total accident rate increased monotonously with the decrease in horizontal radius. The results indicate that 54.54% (/km/103 pcu) of accidents occurred on a steep slope (4%–5%), representing about 10 times that of 3%–4% slope and 20 times that of the less than 3% slope. Based on the data, the safety situation of China’s highway transportation is obviously grim, and improving freeway heavy traffic management in economically developed regions, strengthening the safeguarding of mountain freeways, applying small radius and large vertical grade with caution, and developing a monitoring system of tunnels and interchanges could be used as effective measures to prevent freeway accidents.
Introduction
By the end of 2015, freeway mileage in China reached 125.4 thousand kilometers, accounting for 2.8% of highway in the country (4.50 million kilometers). Compared to other highways, the freeway is often designed with relatively good driving environment, such as high alignment indices, good pavements, total enclosure, absence of pedestrians, no interference with low speed, and excellent traffic safety devices. Thus, the accident rate and death toll in freeways are within an average of 30%–51% and 43%–76% of ordinary highways in developed countries. 1 However, the accident rate, death toll, injury toll, and the direct loss of property in freeways are 3.2, 8.4, 7.2, and 24.3 times that of the average for ordinary highways in China. Therefore, determining what the real laws are on the accident that occurred in freeways and how the different types of freeway environment affect the rate of accidents based on reliable databases.
Over the past several decades, historical surveys covering the features and frequency of accidents involving freeways have been a very active research area.2,3 In the 1940s, Smeed 4 conducted a large-scale investigation on traffic accidents and studied the relationship between population, vehicle parc, and the accident rate based on the statistics method. Zegeer et al. 5 collected details on highway side accidents for 5000 miles of freeways from seven countries to study the relationship among side slope, side clearance, side obstacles, and highway side accidents. They found that vehicle accident ratio declined dramatically when the side slope changed from 1:3 to 1:7. However, the accident ratio dropped by only 2% when the side slope was changed from 1:2 to 1:3. Elvik 6 selected accident data of 20 typical freeways from eight countries in Europe and proposed an identification method for the danger segment. Charlton and de Pont 7 investigated accidents on horizontal curves and found that sharp curves led to high accident ratio (70%). Previous related studies have focused mainly on risk analysis and accident prediction for freeways using limited samples. Few attempts have been made to collect sufficient samples to analyze accident percentages concerning freeway facilities in China. These attempts have investigated mainly the features common to all types of freeway accidents, with a relatively small number of samples analyzed.8–10 In terms of freeway accidents within China, no specialized accident databases and highway design have been created or made available, much less investigations that clarify China’s current safety situation. Thus, a study on accidents freeway environment in China is carried out.
This article is organized as follows. The section immediately following describes major sources used for collecting samples. In the next section, the distribution of accident percentages related to highway types, location, design speed, horizontal curve radius, vertical grades, and characteristics of accidents in tunnels and interchanges is presented. In the last section, some conclusions concerning the measures that need to be taken to reduce this frequency are drawn.
Data sources
In China, the National Statistics Annual Report of Road Traffic Accidents (NSARRTA) is released annually. Comprehensive data are provided in the report, including the distribution of accidents by time, territory, and road type. Generally, statistics on the national and provincial accident rates, death toll, injury toll, and the direct loss of property are gathered in the annual report. Macro data from the annual report are credible and can be used to compare accidents in the freeways with those in other highways. However, until recently, the number of reported accidents in NSARRTA was quite incomplete. Accidents in many old freeways are not reported, and minor accidents are seldom recorded because of technical or other reasons. Specifically, data on injuries due to accidents with details on the road environment have not been collected. Thus, detailed statistics on injuries due to accidents in different types in freeway environment are not available, making sample collection a time-consuming and difficult task in this study. Road design data are difficult to gather from the administration center because each freeway has its own center. Furthermore, while some old freeway centers maintain records on accidents, the design speed data are missing.
Sufficient samples to conduct a meaningful statistical analysis are acquired using four major sources, including the NSARRTA (2013), Statistical Bulletin of Transportation Industry Development (SBTID, 2013), Traffic Management Committee of Public Security Department of Guangdong Province (TMCPSDGP), different Traffic Police detachments (TPD for seven freeways, 593.099 km in total), different Freeway Administration and Maintenance Centers (FAMC for seven freeways, 593.099 km in total), and additional results provided by other scholars. Among these sources, the NSARRTA data released in 2013 were used to analyze the accidents based on accident severity, highway type, and province in China. Data from the TPD and FAMC of the various freeways were used to analyze the distribution of accidents based on design speed and distribution of accidents by alignment. Data from the TMCPSDGP were used to analyze the accident characteristics of tunnels and interchanges. As to the sample size, see Table 1.
Sample source and size.

Research methods
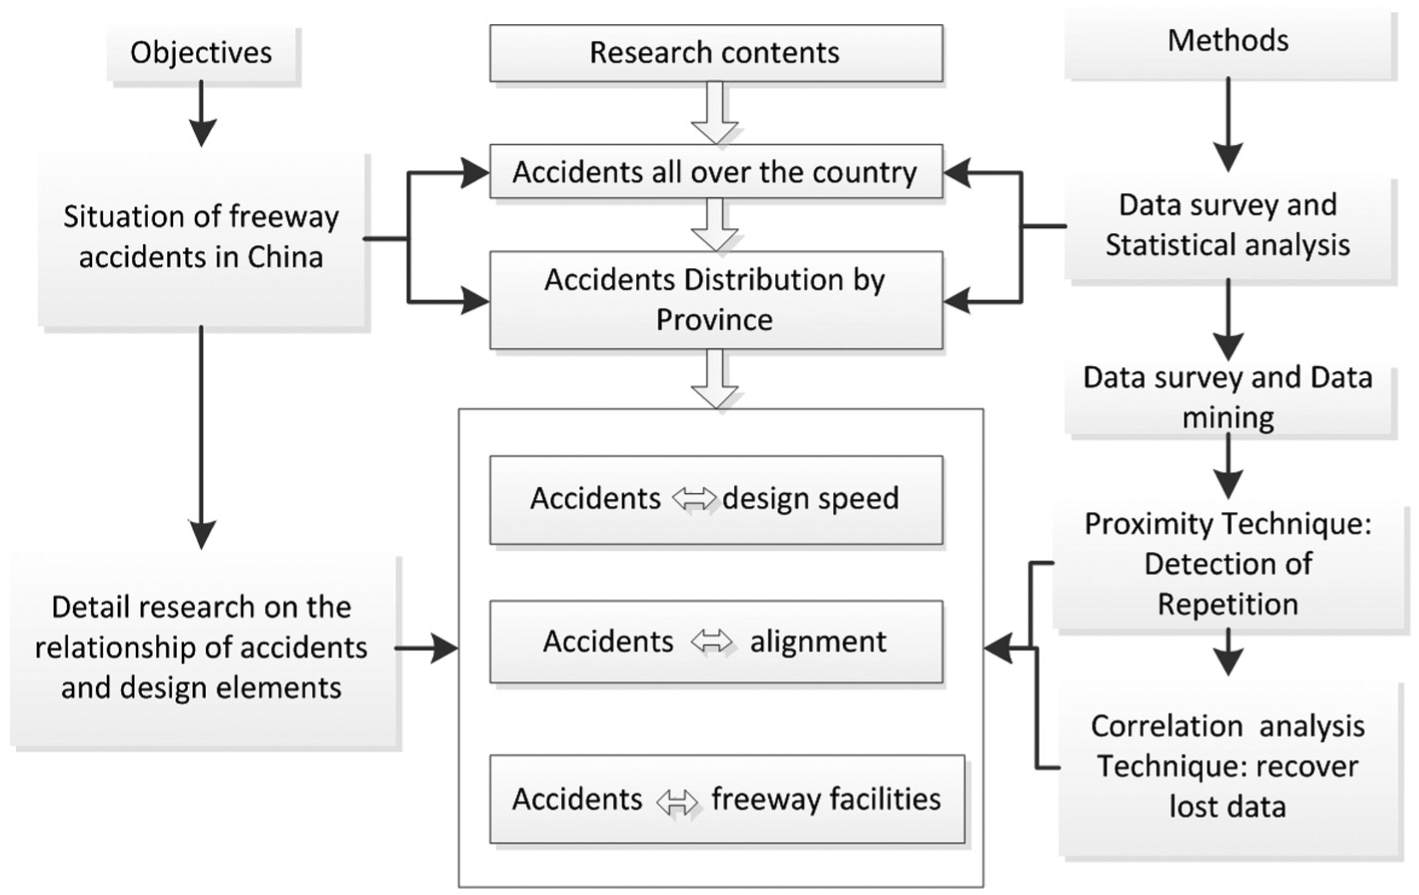
Data from NSARRTA released in 2013 are national-level data and were used to analyze the distribution of accidents by severity, highway type, and province in China. Detailed information on the seven freeways in Guangdong Province was analyzed to identify the relationship between design speed, amount of accidents, and distribution of accidents by alignment. The TMCPSDGP data were used to analyze the characteristics of accidents in tunnels and interchanges. The research ideas of this article can be expressed by Figure 1.
Flowchart of the article.
However, accident records in China are not so satisfied by detailed analysis. We collect accident data mainly from police office and road administration. The data from police focus on accident severity and the data from road administration focus on road facilities. Thus, they record the same accident in the different manner and also ignore the record they do not care. For this reason, we applied data mining (proximity and correlation analysis technique) to improve the accident record.
Detection of repetition by proximity technique
We set up the following proximity model to judge whether two records, respectively, from police office and road administration are the same.
If:
Accident data: Date.p = Date.r;
Accident time: |Time.p-Time.r| ≤ 30 min;
Accident site: |K.p-K.r| ≤ 100 m;
Vehicle type: Type.p = Type.r;
Accident severity: Severity.p = Severity.r.
Note: p represents police and r represents road administration.
Then, two records, respectively, from police office and road administration are the same.
Recover the lost data by correlation analysis technique
Some important records are missed in the data, such as accurate accident place. We use information from complete records to find the correlation of certain elements. Then, we use the relationship between the certain elements to recover the lost information.
The model should be

where Xi, Xj, …, Xk are associated information of road traffic accident, such as accident type and vehicle involved; Y is attribute set of road traffic accident, such as accident place and direction;
For example, on the same downgrade segment, we obtain 213 accident completed records but another 92 uncompleted records which only missed the accident place direction. We set up the correlation model as in Table 2.
Correlation model of downgrade segment.

With confidence coefficient, we can recover the 92 uncompleted records.
Results
Distribution of accidents by accident severity and highway type
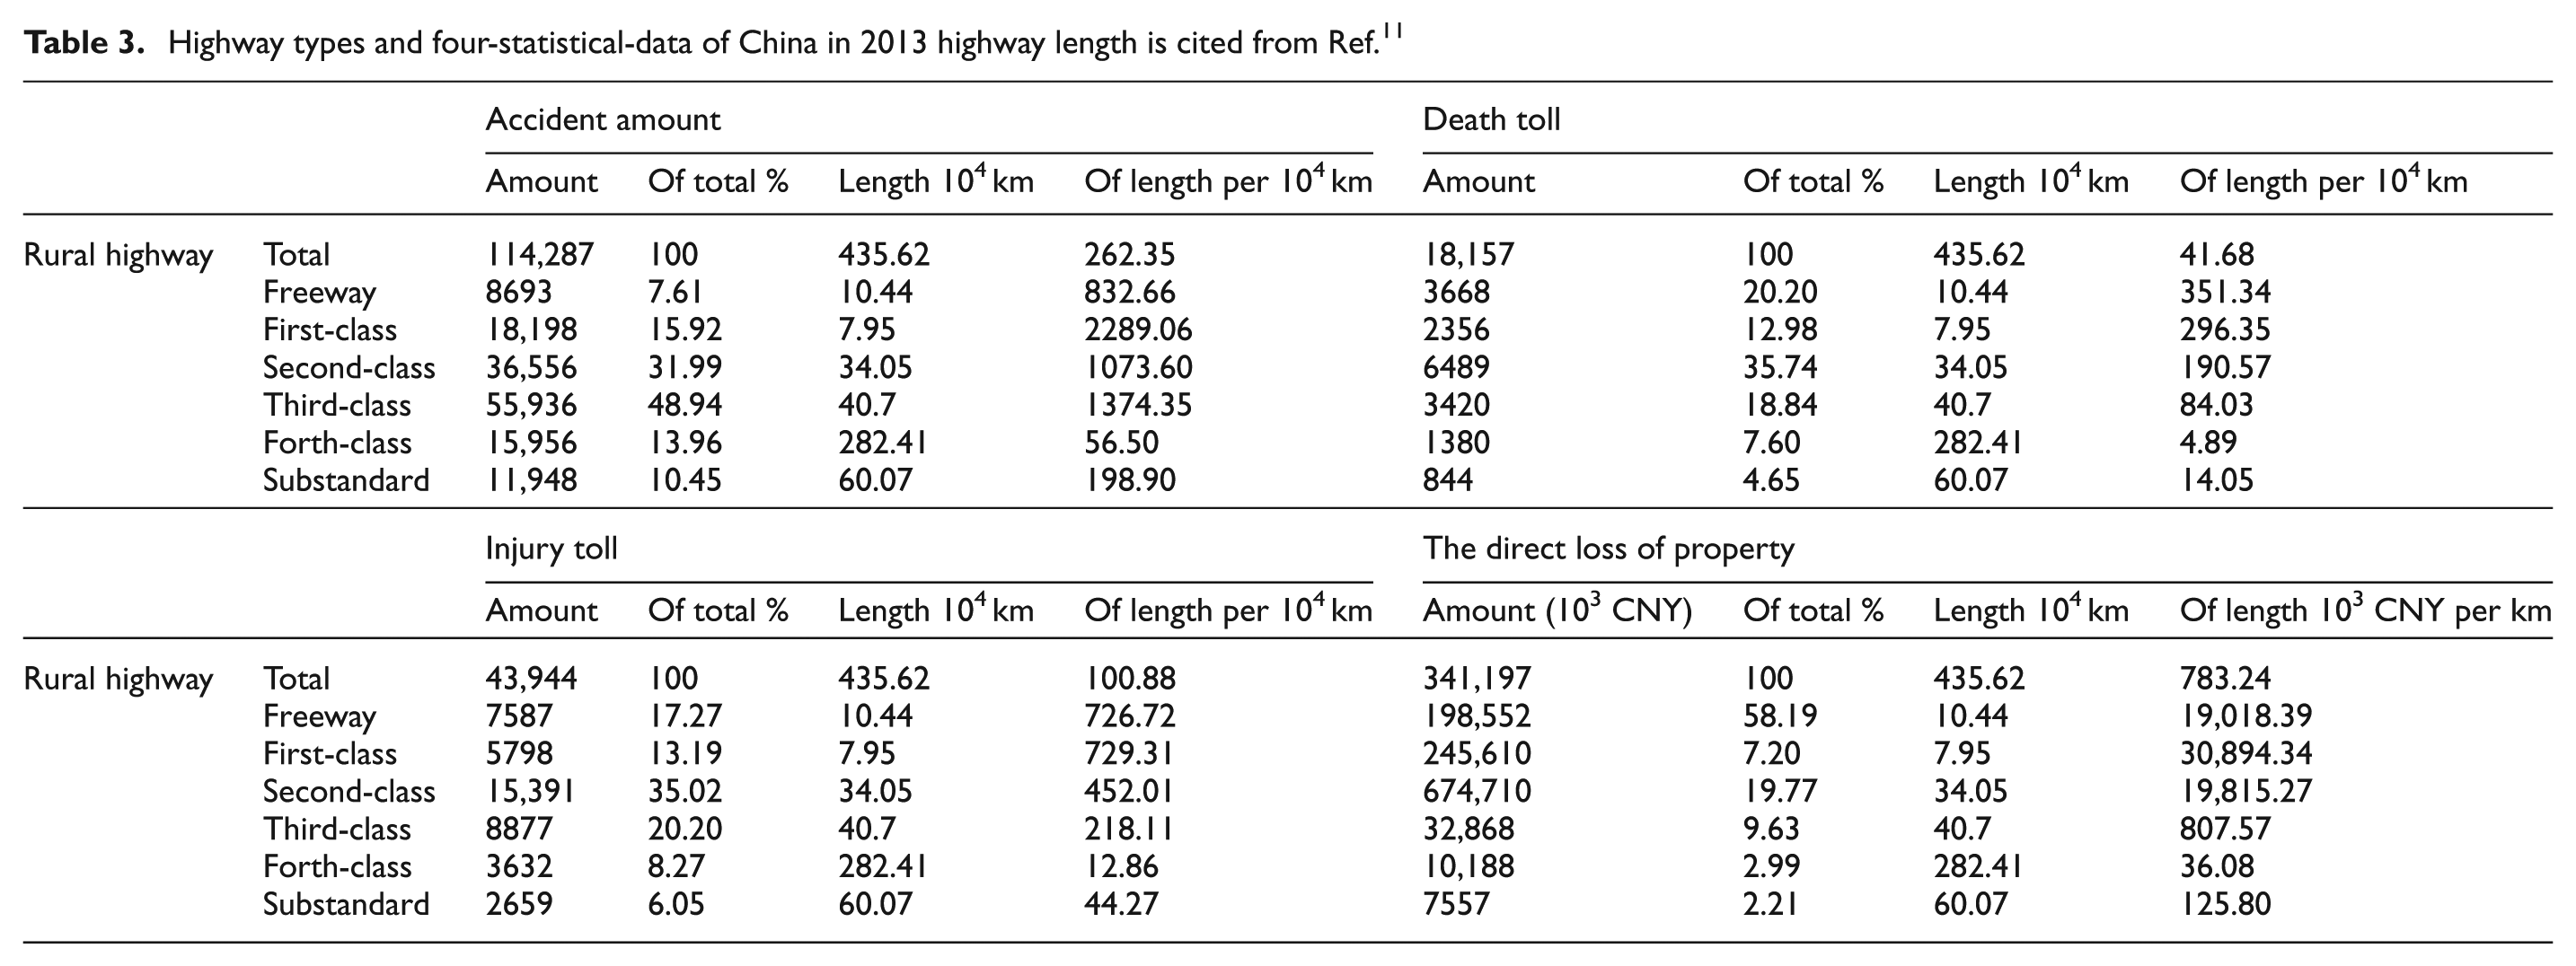
Accident rate, death toll, injury toll, and direct loss of property of different types of highways have been recorded in NSARRTA 2013, otherwise called four-statistical-data. Highways in China are classified into two broad classifications: rural highways and urban roads. Urban roads are those that connect areas in the urban or to rural roads. Rural highways are those that run between cities, villages, or factories. A freeway is a type of rural highway. At the end of 2013, the total road length of China was about 4.36 million kilometers, among which the freeways accounted for 104.4 thousand kilometers or 2.4% of the total road length. However, the accident rate in freeways accounts for 7.61% of all traffic accidents, the death toll accounts for 20.20%, injury toll accounts for 17.27%, and the direct loss of property accounts for 58.19%, as shown in Table 3; these numbers are 3.2, 8.4, 7.2, and 24.3 times those of the highway’s average in China.
Highway types and four-statistical-data of China in 2013 highway length is cited from Ref. 11
Distribution of freeway accidents by province
Mainland China can be divided into 31 provinces and 7 divisions according to their geographical zones: Eastern, Southwest, Central, Northern, Southern, Northwest, and Northeast China.
More than 40% of accidents occurred in Central and Southern China, 20.2% in the central part, and 20.77% in the south, as shown in Figure 2. Concretely speaking, the provinces with the highest percentages of accidents are Guangdong (10.74% and 0.16 accident per km), Hunan (8.33% and 0.14 accident per km), and Fujian (7.45% and 0.16 accident per km). These provinces are considered to be economically developed regions in China, with the highest average annual Gross Domestic Product (GDP) during the observation period, the highest highways density (as shown in Table 4), and the largest percentage of mountainous highways. More accidents occur in provinces with a larger number of vehicles, such as Shanghai (1.30% and 0.14 accident per km) and Zhejiang (4.61% and 0.11 accident per km), whereas Tsinghai (0.58% and 0.04 accident per km) and Neimenggu (1.15% and 0.02 accident per km) have lower accident frequencies because of smaller traffic volume.

Total accident amount of freeway in different provinces in 2013.
Total accident amount of freeway in different provinces of China in 2013.

From the above analysis, we find Guangdong freeway has the highest percentage of accidents. By the end of 2013, private vehicles are 9.95 million and account for 84.5% of civil vehicles in Guangdong (11.78 millions). Freeway mileage is 5.703 thousand kilometers and accounts for 2.85% of highways in Guangdong province (202.9 thousand kilometers). However, traffic crashes of freeway accounts 20.54% in Guangdong, deaths toll of freeway accounts 31.98%, and injury toll accounts 18.45%.
Distribution of accidents by design speed
Because the province has the highest accident rate, Guangdong has been selected as typical province on which we conducted a detailed survey. Five-year data from TMCPSDGP and the seven different freeway TPDs and FAMCs in Guangdong were collected and analyzed in this article. According to the freeway classification by design speed, freeways in China are classified into three broad classifications: 80 km/h-freeway, 100 km/h-freeway, and 120 km/h-freeway. Traffic accidents can be classified into four broad classifications based on accident classification by personal injury and property loss:
Minor accident: one or two persons with slight injuries, or less than 1000 CNY property loss;
Ordinary accident: one or two persons seriously injured, or more than two persons with slight injuries, or 1000–30,000 CNY property loss;
Major accident: death of 1 or 2 persons, or 3–10 persons seriously injured, or 30,000–60,000 CNY property loss;
Extra serious accident: death of more than 3 persons, 11 persons seriously injured, or death of 1 person and more than 8 persons seriously injured, or death of 2 persons and more than 5 persons seriously injured, or more than 60,000 CNY property loss.
Data of accidents from the seven TPDs were classified into the four broad classifications of different design speed freeways. The number of accidents in each category can be seen in Figures 2–4 and Table 5.
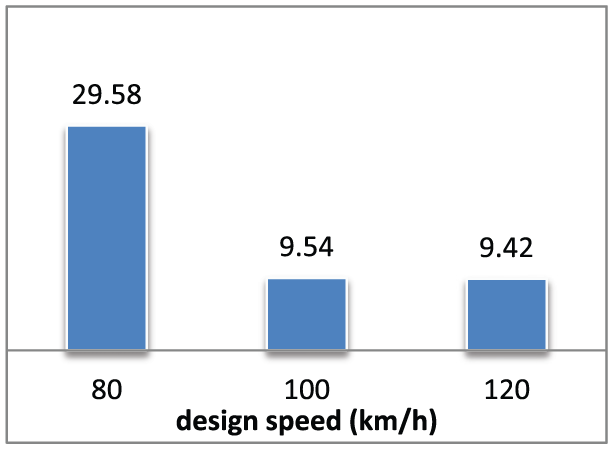
Accidents by design speed (/km/103 pcu).
Distribution of four kinds of accidents (%).
Percentage and number of accidents by accident type and freeway design speed (2008–2012 years).

Total in the “% of total” is the last low “Total” in the Table.
The total accidents number of certain design speed freeway, and the last low “Total” is sum total of 3 kinds design speed freeway.
Figure 2 and Table 5 indicate that 3268 (29.58/km/103 pcu) accidents occurred on freeways with 80 km/h design speed, which was more than three times that of 100 km/h (9.54/km/103 pcu) and 120 km/h (9.42/km/103 pcu). These accidents could have occurred because 80 km/h freeways are often located in mountainous areas, which have low design speed and bad freeway environment that is not as good as that of high one, because these environments have small horizontal curve radius, large vertical grade, short sight distance, and so on.
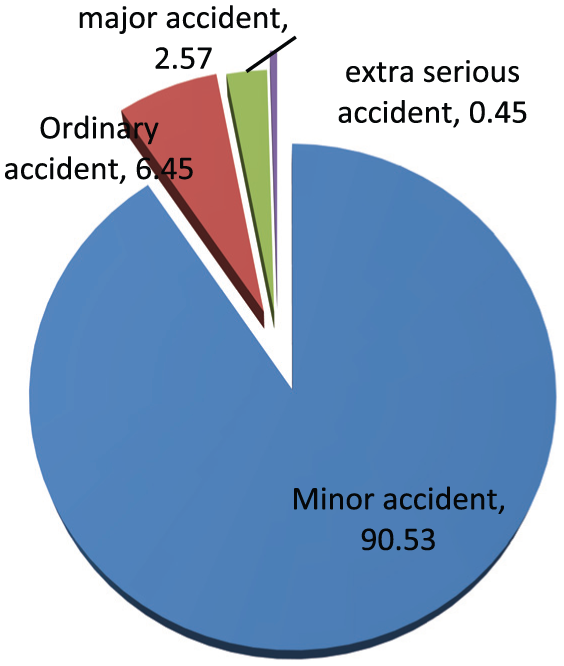
Among the 7108 samples, 6436 were minor accidents (90.53%). The rest can be categorized as ordinary (6.45%), major (2.57%), and extra serious (0.45%) (see Figure 4).
Figure 5 shows that serious accidents (ordinary, major, and extra major accidents) have an increasing trend as the design speed increased. The higher speed limits for freeways with design speed of 120 km/h resulted in higher amounts of major accidents (57.00%) and extra serious accidents (32.94%). This increase may be because the high design speed leads to higher driving speed, which results in more serious accidents. Figure 5 shows that a large percentage of ordinary, major, and extra serious accidents occurred in100 km/h freeways. A detailed analysis of the data indicates that the higher percentage of accidents could be because most of 100 km/h freeways have special sections located in bad terrain conditions, resulting in a huge difference in operation speeds between adjacent segments, which poses considerable danger for drivers. In some conditions, tunnels or large bridges are used to address bad terrain conditions, resulting in a change of the driving freeways. Small radius is more likely to cause accidents, with the addition of small traffic volume (340 pcu/h) compared to average volume (5290 pcu/h), the accident rates/km/103 pcu of small radius segments are quite high.

Four classifications of accident percentage.
Accidents by horizontal curve radius (/km/103 pcu).
Against common rules, we find from Figure 7 that the probability of collision increases along with the decrease in radius. However, non-collision accidents do not increase monotonously with the decrease in radius. When the radius is from 800 to 1000 m, the accident rate (2.92/km/103 pcu) becomes much higher than that of 600–800 m (0.92/km/103 pcu). Because of small sample size for 600–800 m, the real reason is not clear and further studies need to be carried out.

Distribution of different kinds of accidents by horizontal curve radius (/km/103 pcu).
Figure 8 also indicates that collision accidents account for 81.12%, whereas non-collision accidents and rollover accidents account for 18% of the majority. Although the freeway is totally closed to pedestrians, people intruding onto the freeways often induce accidents. Fortunately, intrusions are a fairly rare occurrence and only two cases have been reported in the data.

Four classifications of accident percentage of horizontal curves.
Distribution of accidents by vertical grade
According to Technical Standards of Highway Engineering and Design Specification for Highway Alignment12,13of China, when the design speed is higher than or equal to 80 km/h, the maximum vertical grade is 5%. Absolute vertical grades have been classified into three kinds: less than 3%, 3%–4%, and 4%–5%. The number of accidents in each category based on horizontal alignment can be seen in Figures 9–11 and Table 8.

Total amount of distribution of accidents by vertical grade.
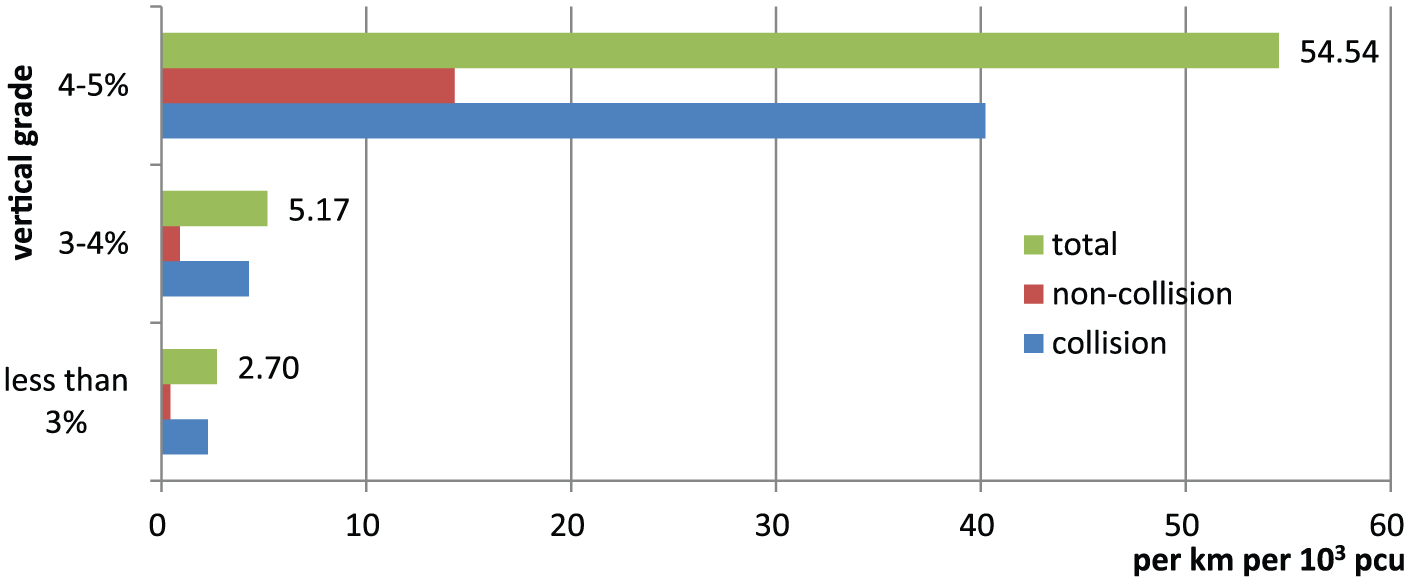
Different types of accident distribution by vertical grade.

Four classifications of accident percentage of vertical alignment.
Figures 9 and 10 show that the total amount of accidents increases monotonously with the decrease in vertical grade. The total amount of accidents (54.54/km/103 pcu) is the highest among all other cases when the vertical grade is larger than 4%. Further analysis of the data collected shows that only freeways with 80 km/h design speed can set out such kinds of vertical curves according to Technical Standards of Highway Engineering in China (see Table 6). As explained above, most of the 80 km/h design speed freeways are located in mountainous areas, which have a more complex driving environment. Large grade segments in mountainous areas make it difficult to control vehicles, particularly heavy trucks. This kind of segment is inclined to high accidents, with the addition of small traffic volume (340 pcu/h) compared to average volume (5290 pcu/h), the accident rate/km/103 pcu of large vertical grade segments are quite high. When the vertical grade is smaller than 4%, all kinds of accidents obviously decline (2.83/km/103 pcu for total).
Percentage and number of accidents by horizontal radius.

Including crashing moving vehicle(s) and static vehicles(s).
Crashing static objects, such as safety guardrails and traffic signs.
Including side rollovering and rollover.
Including crashing pedestrian, falling into cliff, driving into ditch, being on fire, and so on.
Minimum radius and maximum grade of different design speed.

Percentage and number of accidents by vertical grade.
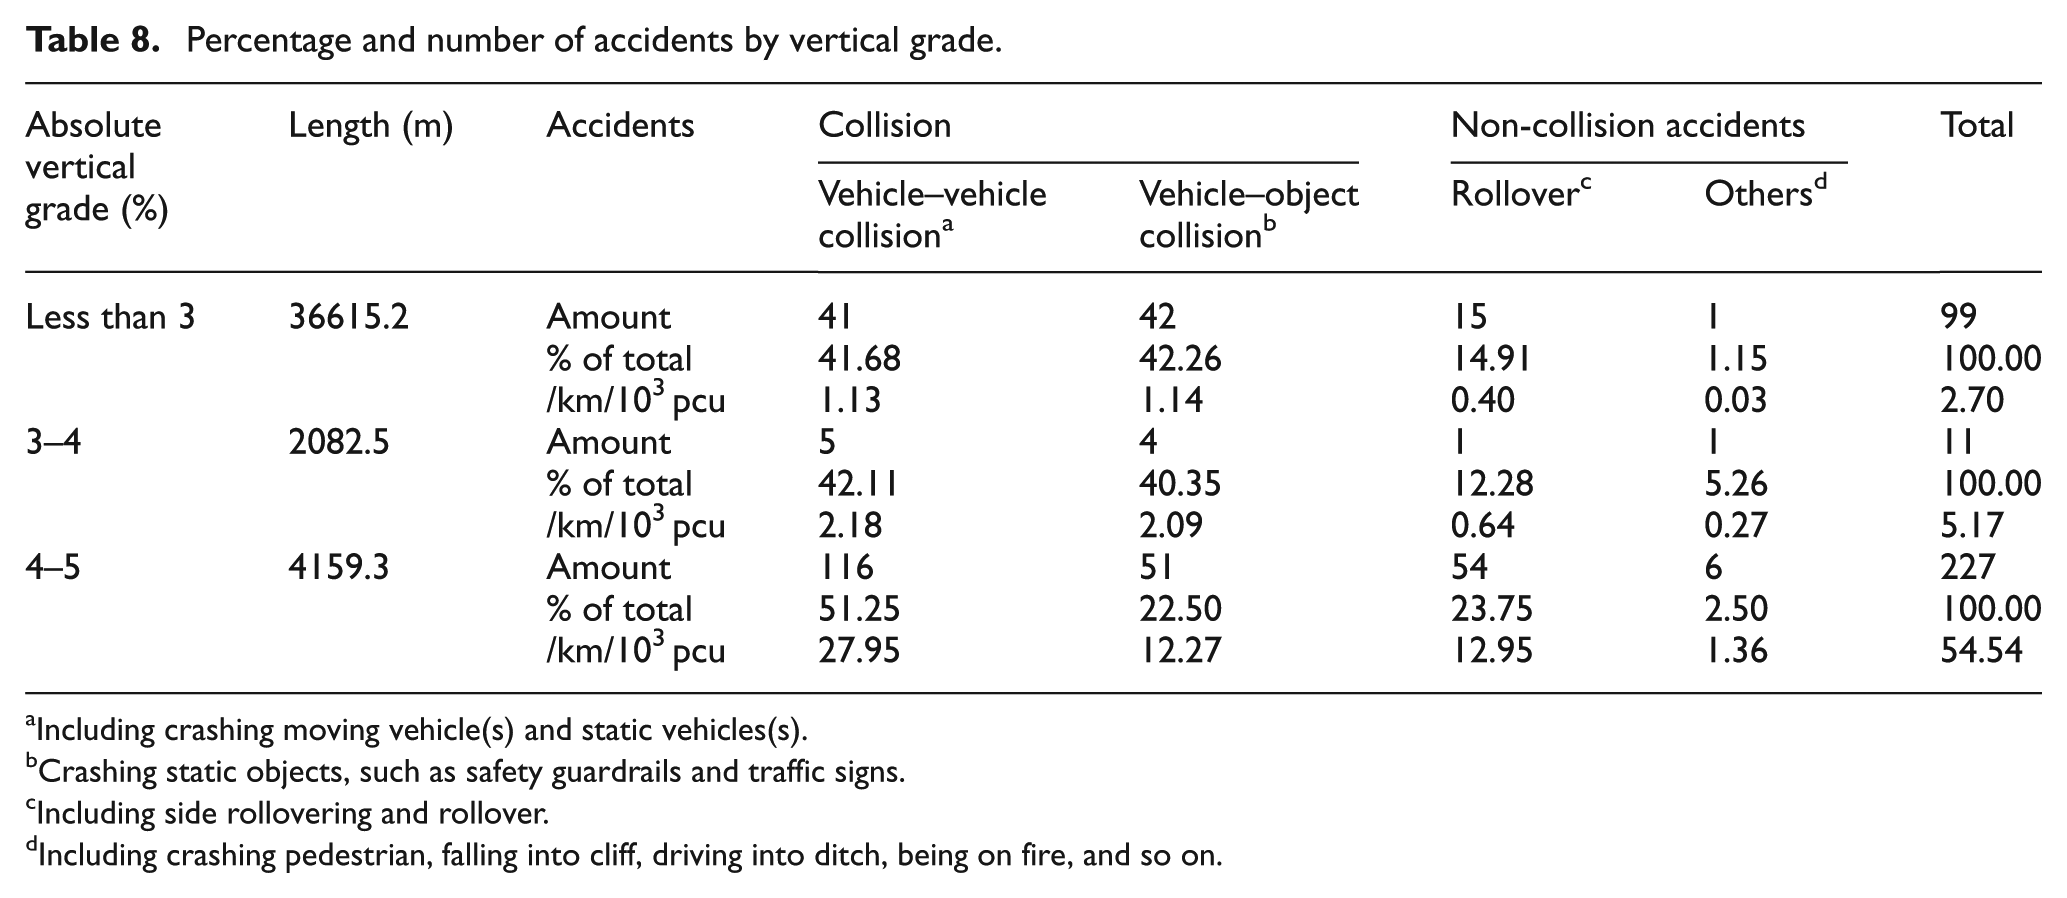
Including crashing moving vehicle(s) and static vehicles(s).
Crashing static objects, such as safety guardrails and traffic signs.
Including side rollovering and rollover.
Including crashing pedestrian, falling into cliff, driving into ditch, being on fire, and so on.
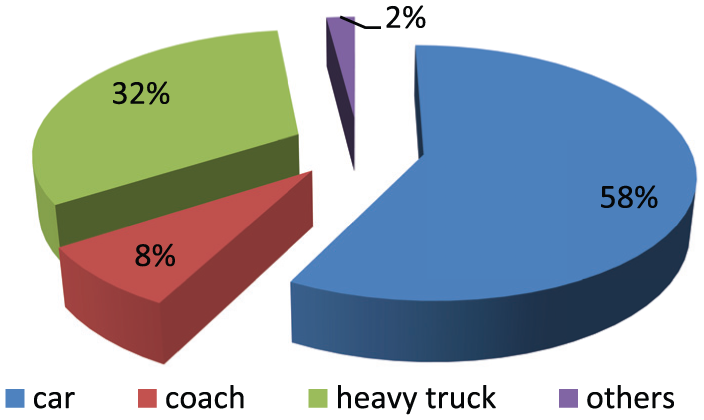
Figure 11 also indicates that collision accidents (77%) accounted for a significant majority of accidents because of the vertical grade, whereas among non-collision accidents, rollover accidents (21%) accounted for the majority.
Accident characteristics of tunnels and interchanges
Characteristics of accidents in tunnels
Data on accidents in tunnels were acquired from TMCPSDGP. Accident data from 41 tunnels were surveyed and 757 accidents analyzed. Among the 41 tunnels, 14 tunnels are shorter than 500 m with a total length of 3447.65 m; 10 tunnels are between 500 and 1000 m with a total length of 6958.52 m; 13 tunnels are between 1000 and 3000 m with a total length of 22,744 m; and 4 tunnels are longer than 3000 m with a total length of 15,405.35 m. The accident type statistics in highway tunnel sections are shown in Figure 12. The statistics show that rear-end collisions, collisions onto the tunnel wall, and rollover accidents accounted for the majority of total number of accidents in tunnel sections (approximately 96.49%). The proportion of accidents caused by fire or other reasons is very small. In terms of accident by vehicle type distribution (Figure 13), heavy trucks and cars were the majority (approximately 89.85%), while the proportion of other vehicle types is relatively small.

Distribution by accident type in tunnel sections (%).
Vehicle distribution in tunnel sections (%).
Characteristics of accidents in interchanges
In total, 105 interchanges and 2738 accidents in Guangdong province were analyzed. Among the 105 interchanges, 75 were trumpet interchanges. Figure 14 shows that rear-end collisions, side collisions, and collision onto guard bar comprised the majority of total number of accidents within the scope of the interchange (approximately 85.07%) and that these accidents were concentrated mainly in the sections of the entrance–exit ramp. After statistical analysis, the proportion of accidents in entrance–exit ramp to total number of accidents in interchange sections was 83.33%, whereas the proportion of other accident types is 16.67%.

Distribution by accident type of interchange (%).
Conclusion
Many of the characteristics associated with China’s freeway accidents are presented in this study. First, although freeway mileage is 104.4 thousand kilometers, it accounts for only 2.4% of highways in China (4.36 million kilometers), the overall accident rate in freeways accounts for 7.61% of all traffic accidents, death toll accounts for 20.20%, injury toll accounts for 17.27%, and direct loss of property accounts for 58.19%, representing 3.2, 8.4, 7.2, and 24.3 times the average for highways in China. The reasons for these accidents include high driving speed, large traffic volume, and low-level management.
Judging from the spatial location distribution, freeway accidents occur mainly in Southern (20.77%) and Central China (20.2%). The former is considered to be one of the most economically developed regions, with the highest highway density and the largest number of traffic volume in China. Guangdong (10.74% and 0.16 accident per km) and Fujian (7.45% and 0.16 accident per km), whose accident percentages are the highest in China, are located in Southern China. The latter areas have many mountain freeways, and the limited traffic infrastructure combined with inadequate driver training and management resulted in a higher probability of serious accidents occurring.
Freeways with 80 km/h design speed are usually located in mountainous areas and are areas set out with worse technical standards than those of 100 or 120 km/h design speed, such as small horizontal curve radius, large vertical grade, and short sight distance. Thus, accidents on freeways with 80 km/h design speed (29.58/km/103 pcu) represent more than three times that of the 100 km/h (9.54/km/103 pcu) and 120 km/h (9.42/km/103 pcu) freeways. Minor accidents (91.08%) are the predominant crash type without serious wounds. Ordinary (5.22%) and major (3.40%) accidents account for certain percentages. However, serious accidents (ordinary, major, and extra major accidents) exhibit an increasing trend with large design speed (100 and 120 km/h) freeways, which tend to have higher speed limits. The percentage for freeways with design speed of 100 km/h is relatively higher than that for freeways with design speed of 80 km/h. The higher percentage of accidents may be because of the higher speed limits in this kind of freeway. Freeways with design speed of 100 km/h are usually located in areas with a certain percentage of distressing sections, which limit the entire freeway from 120 km/h, thereby resulting in huge differences in operation speeds between adjacent segments, which could be quite dangerous for drivers.
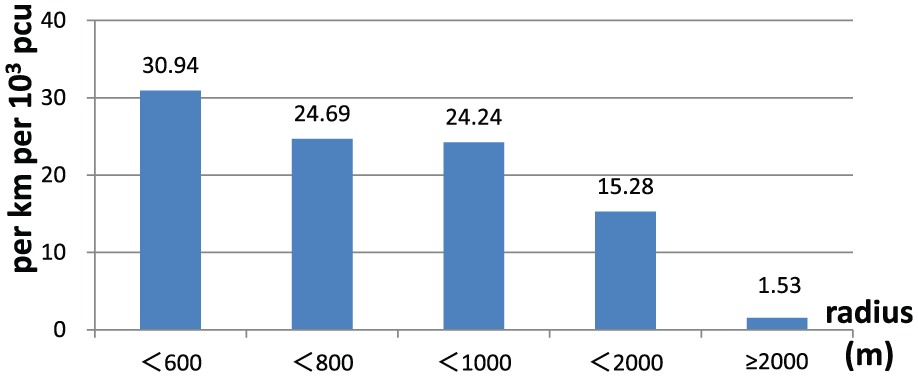
The total amount of accidents increases monotonously with the decrease in horizontal radius. Among the important critical radii are 2000 and 1000 m. When the radius was larger than 2000 m, the total accident rate was lesser (1.53/km/103 pcu) than that of small ones (15.28/km/103 pcu), and it appeared that all kinds of accidents had nothing to do with radius. Meanwhile, when the radius is smaller than 1000 m, the total accident rate is apparently higher than that of bigger ones, but the difference was not too significant. Collisions (81.12%) still accounted for a significant majority of the accidents. The probability of collision increased along with decrease in the radius. Non-collision accidents do not increase monotonously with the decrease in the radius. However, the reason for these results cannot be determined because of the small sample size in this study.
Moreover, 54.54% (/km/103 pcu) of accidents occur on a steep slope (4%–5%), about 10 times that of the rate for the 3%–4% slope and 20 times that of the slope that was less than 3%. Driving on a large grade slope makes it difficult for drivers to control their vehicles, especially for heavy trucks. With the addition of 4%–5% grade often used in mountain freeways, drivers face a much more complex environment, resulting in a larger number of accidents. In terms of accident types, collision accidents (77%) still accounted for a great majority.
Rear-end collisions, collision onto tunnel wall, and rollover accidents comprise the majority (96.49%) of accidents in tunnels. The proportion of accidents caused by fire or other reasons is very small. Rear-end collisions, side collisions, and collisions onto guard bar represent the majority of the total number of accidents within the scope of interchange, comprising approximately 85.07%, with accidents occurring mainly in the sections of the entrance–exit ramps.
In summary, analyses on accidents in freeways indicate that China’s freeway environment has some issues in terms of safety. Improving freeway heavy traffic management in economically developed regions, strengthening the safeguarding of mountain freeways, applying small radius and large vertical grade with caution, and developing a monitoring system for the tunnels and interchanges are some solutions that could be considered as effective measures to avoid freeway accidents. However, the aforementioned results were acquired based on different samples and hence some of the conclusions were based on a small number of samples with certain limitations. Data used to analyze the distribution of accidents based on severity, highway type, and province were collected from NSARRTA (2013), which is incomplete because it ignores minor accidents and accidents in old freeways. Moreover, with the exception of the four-statistical-data, no other detailed accident records with road environment could be found. Thus, the distribution of accidents based on design speed, horizontal alignment, and vertical grade was analyzed based on the samples of TPDs and FAMCs of seven freeways. Data from TMCPSDGP were used to analyze the characteristics of accidents in tunnels and interchanges. More in-depth analyses could be conducted by combining the results from this study with the results from the subsequent years or with a larger sample size. The additional data would also enable comparisons of different alignment combinations.
Footnotes
Academic Editor: Yongjun Shen
Declaration of conflicting interests
The author(s) declared no potential conflicts of interest with respect to the research, authorship, and/or publication of this article.
Funding
The author(s) disclosed receipt of the following financial support for the research, authorship, and/or publication of this article: This research was supported by the National Natural Science Foundation of China (Nos 51408229, 51308059, 51278202, and 51378222), Guangdong Communication Department (2013-02-068, 2015-02-003, and 2015-02-004), and China Postdoctoral Science Foundation (2014M552399).