
Abstract
Four kinds of rail steels were tested to investigate the wear behaviors of wheel–rail materials under three kinds of axle loads. Results indicate that the increase in axle load not only significantly enlarges the wear loss but also enlarges the depth and the length of the fatigue cracks. However, with the decreases in the hardness ratios, some ripples are exhibited on the surface, and the wear surfaces become much rougher; the subsurface analyses deliver the presence of extremely rough surface, and the deformation depths are irregular. The relationship between the total wear loss of the wheel/rail system and the hardness ratio indicates that the hardness ratio of wheel/rail steels has slight impact on the total wear loss at a low axle load; however, the decrease in the hardness ratio enlarges the total wear loss significantly at a high axle load. In summary, a quenched rail should be chosen for the heavy-haul railway, and the hardness of the wheel steel should be raised to a degree close to the rail. However, a hot rolled rail is much suitable for the high-speed railway, and the wheel hardness should be smaller than the rail.
Introduction
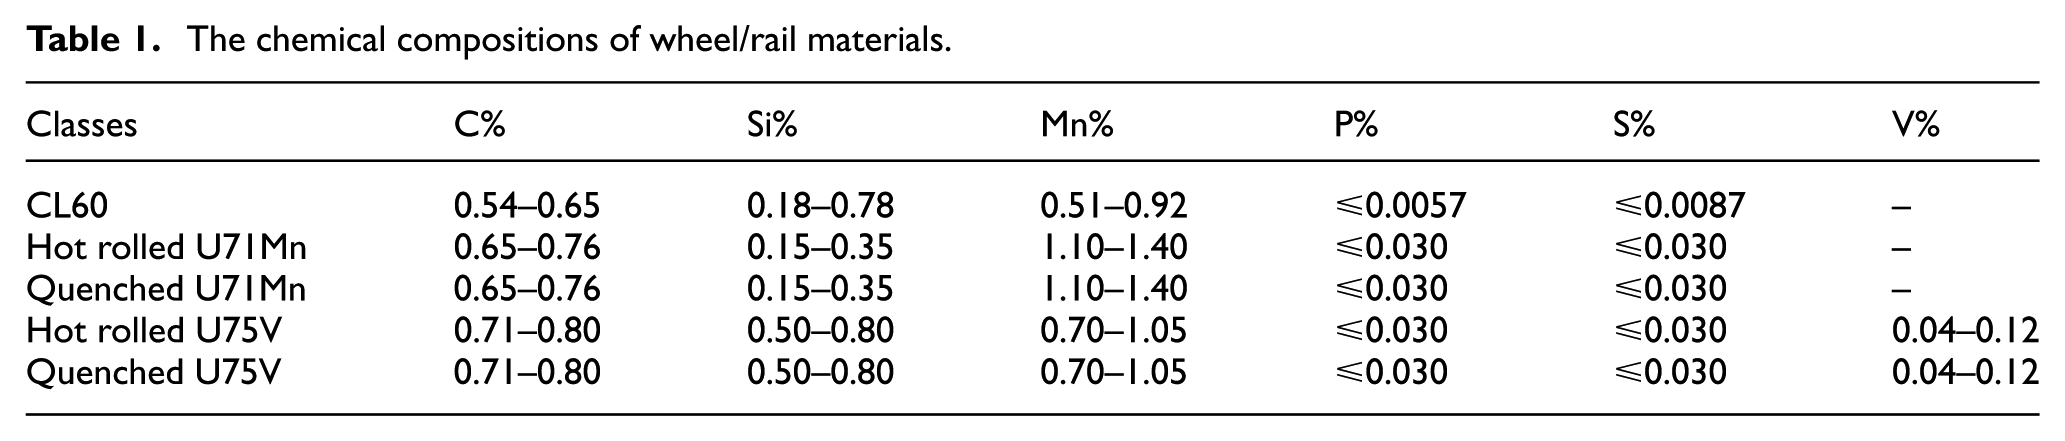
Wheel/rail interface plays a fundamental role in determining the reliability of railway transportation, especially for the heavy-haul and high-speed railways. It is well known that the increase in axle load and traffic volume of railways leads to excessive wear of wheel/rail materials and remarkably decreases service life of the wheel/rail system.1–3 As a consequence, a new impulse in the study of wear and failure mechanisms and new materials has been under investigation in recent years.4–8
A major method in the development of new wheel/rail materials, especially the rail steel, is to improve the wear resistance and rolling contact fatigue (RCF) resistance through higher hardness. 9 Increasing hardness is relatively easy to achieve by adding alloying element (mainly manganese and vanadium) and applying heat treatment. 10 Generally, many engineers prefer to prolong the rail life by sacrificing the wheel life. Since the wheel and rail rub against each other, the influence of rail on wheel performance should be considered under the condition of improving the rail strength unilaterally. Moreover, wear and RCF are competitive because wear continuously removes surface layers where cracks have been nucleated, limiting the possibility of severe damage occurrence.11,12 Hence, the rail strength should be controlled under a proper status. In the past time, many researchers have been attracted to study the wear behaviors of wheel or rail steels; however, there are few attentions paid on the wear behaviors of the wheel/rail systems. In this work, the effects of rail materials and axle loads on the wear and damage performances of different rail and wheel steels are studied. The wear scars and the wear debris in microstructure have been investigated; also, the relationship between the total wear loss of the wheel/rail system and the hardness ratio of the wheel/rail steels has been made.
Experimental details
MMS-2A rolling–sliding testing apparatus
Rolling–sliding wear tests are carried out to simulate a train passing through a straight line using an MMS-2A rolling–sliding testing apparatus, as shown in Figure 1.

MMS-2A rolling–sliding testing apparatus.
The testers are composed of two rollers severing as a rail roller (upper sample) and wheel roller (lower sample). A screw bolt (no. 13 in Figure 1) is used to fix the wheel and rail rollers. The normal forces of wheel/rail interface are measured and recorded on the computer using a vertical force sensor (no. 17 in Figure 1). A small wheel and rail configurations are designed on the basis of electric multiple unit (EMU) wheel tread and 60 kg/m rail profiles used in China railway. The scale of the wheel/rail profiles, relative to full size, is 1:21. Wheel rollers are disks of 40 mm in diameter, while the rail rollers share the same diameter; wheel and rail test disks are cut from the real wheel rims and rail sections. To ensure the homogeneous properties, the rail disks are cut with their axis perpendicular to the rail long axis, whereas the wheel disks are cut with their axis perpendicular to the wheel tread tangent. The scheme of geometric size and the sampling positions of wheel/rail rollers are shown in Figure 2.
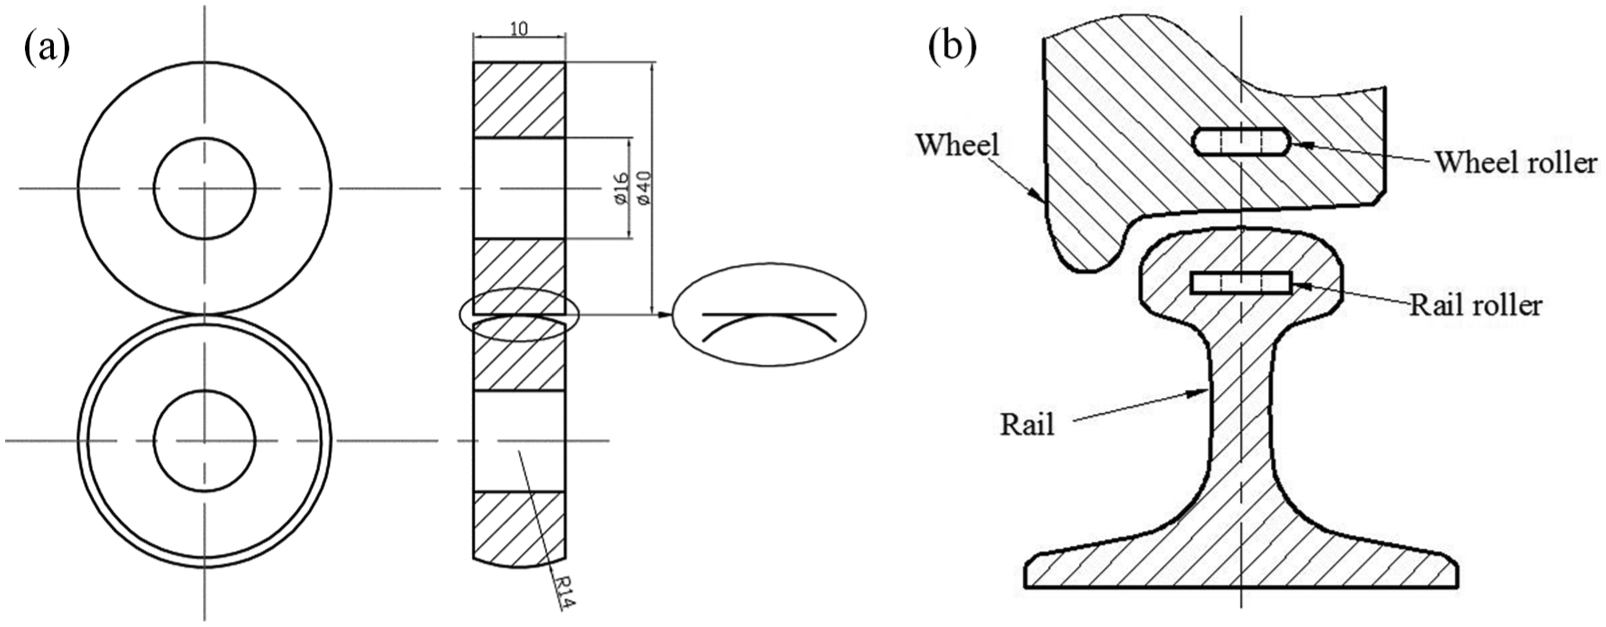
(a) Scheme of wheel and rail rollers (size in mm) and (b) sampling positions.
Experimental parameters and materials
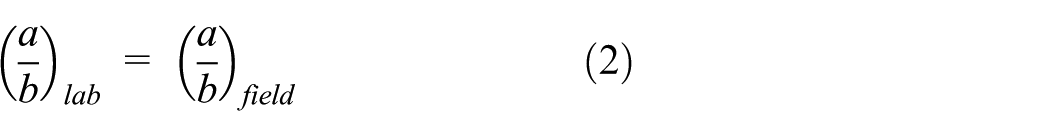
Rail disks are made of four kinds of rail steels: hot rolled U71Mn, quenched U71Mn, hot rolled U75V, and quenched U75V, which are kindly provided by ANSTEEL, whereas wheel disks are made of CL60 wheel steel, and this is provided by MASTEEL. Both ANSTEEL and MASTEEL are famous steel works in China. The chemical compositions of disk materials are given in Table 1.
The chemical compositions of wheel/rail materials.
On the basis of Hertzian contact rule, 1 the following equations could be established

where (q0) lab and (q0) field are the maximum contact stresses in the laboratory and field, respectively; (a/b) lab and (a/b)field are the ratios of semi-major axis to semi-minor axis of the contact ellipses between the wheel and rail in the laboratory and field, respectively.
The maximum contact stress q0 can be calculated by the following equations


where p is the normal force; a and b are the lengths of semi-major axis and semi-minor axis of the contact ellipses; E1, E2 and µ1, µ2 are Young’s moduli and Poisson’s ratios of the wheel and rail materials, respectively; E1 = E2 = 2.1 × 10⁵ MPa, µ1 = µ2 = 0.3; A is the equivalent geometric radius of wheel/rail; and Rw1, Rw2, Rr1, and Rr2 are the radii of principal curvature of the wheel/rail contact point, respectively.
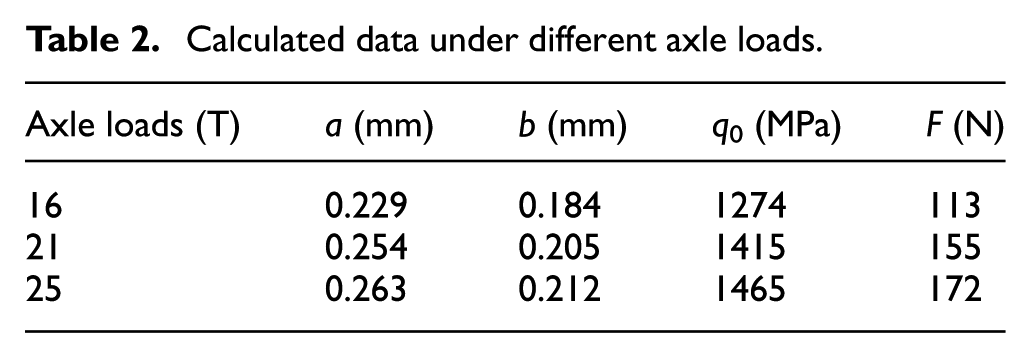
The geometric sizes of wheel/rail rollers in the field are that Rw1 = 840 mm, Rw2 = Rr2 = 300 mm, and Rr1 = ∞, while in the laboratory, Rw1 = Rr1 = 40 mm, Rr2 = ∞, and then Rw2 can be calculated as 14 mm. The lengths of semi-major axis and semi-minor axis, the maximum contact stresses q0, and the normal forces can also be calculated as shown in Table 2.
Calculated data under different axle loads.
The rotational speed of the wheel roller is 400 r/min; a rotational speed of 390.48 r/min for the rail roller can be obtained using two gears with a ratio of 98/82. The slip ratio is defined by the following formula

where λ is the slip ratio between the wheel and rail rollers; ωw and ωr are the rational speeds of the wheel and rail rollers, respectively; and Rw and Rr are the radii of the wheel and rail rollers, respectively. Thus, the slip ratio calculated by equation (8) is 2.38%.
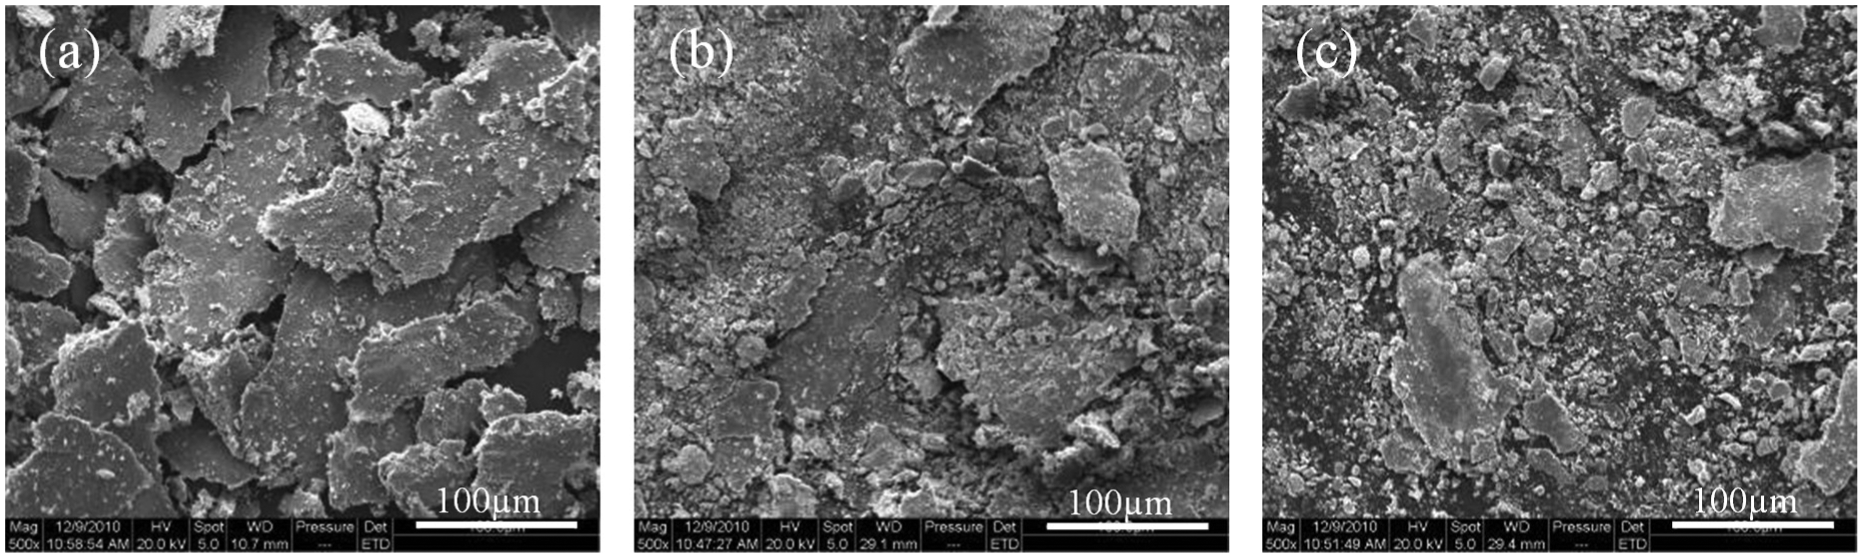
The cycle number of the loading is 5.76 × 10⁵. All tests are carried out at room temperature and a relative humidity of 65%–70%. The wear debris is collected after each test. To ensure similar test conditions, all test disks are dismantled, cleaned in an ultrasonic bath of alcohol and weighed by an electronic analytic balance. The roughness measurement is performed on each sample before and after each wear test with a surface profilometer (JB-6C China). And the original roughnesses of rail and wheel samples are about 0.064 ± 0.002 and 0.186 ± 0.002 µm, respectively. At the end of each test, disks are sectioned and prepared for metallographic observation using a scanning electron microscopy (SEM; Quant 200), and the wear debris is observed as well. Figure 3 shows the SEM micrographs of wheel–rail steel subjected to CL60, hot rolled U71Mn, quenched U71Mn, hot rolled U75V, and quenched U75V, respectively. Since the carbon content of all the rail/wheel steels is lower than or close to the eutectoid point, all samples show ferrite–pearlite microstructure. As expected, the lower the carbon content, the higher the ferrite proportion. When the content of pearlite increases, a higher strength can be obtained. After repeated measurements for 10 times, hardness comparisons between laboratory results and standard values are shown in Table 3. The samples with different carbon contents and different heat treatments show various hardness: the lesser the carbon content, the lower the hardness, and the quenching treatment could achieve better hardness property. It can also be found from Table 3 that the hardness fluctuations almost fall into the standard values; thus, the hardness results in the laboratory tests are quite credible. The hardness ratios of wheel/rail steels are 0.866, 0.812, 0.793, and 0.726 which correspond to the hot rolled U71Mn, hot rolled U75V, quenched U71Mn, and quenched U75V rail steels, respectively.

SEM micrographs of the microstructure: (a) CL60 wheel, (b) hot rolled U71Mn rail, (c) quenched U71Mn rail, (d) hot rolled U75V rail, and (e) quenched U75V rail.

Results
Wear resistance analysis
Figure 4 indicates the wear losses of rail and wheel samples. The wear loss is the difference in values of the sample masses before and after the wear test. The mass of each sample is measured for 10 times. The increase in rail hardness causes a decrease in the wear losses of rail samples (Figure 4(a)); however, the wear losses of wheel samples increase rapidly (Figure 4(b)). Also, the increase in rail hardness enlarges the total wear loss of wheel/rail system, as shown in Figure 4(c). Furthermore, the wear losses increase rapidly with the axle loads increasing from 16 to 25 T regardless of wheel or rail samples, which is in agreement with previous reports.16,17 As a result, the total wear loss of each wheel/rail system increases significantly. Macrographs of hot rolled U71Mn wheel/rail system under different axle loads are shown in Figure 5. It is found from Figure 5 that the increases in axle loads enlarge the widths of wear scar significantly both for wheel and rail samples. Compared with Figure 5(a) and (b), the amount of the removed material from wheel sample is much larger than that of rail sample in the same wheel/rail system. Former researchers claimed that the fine lamellar pearlitic structure was one of the most important factors improving wear resistance.18,19 Figure 6(a)–(c) shows a similar ferrite–pearlite microstructure. As carbon content increases, the interlamellar spacing and pearlitic length scale decrease. It indicates that the wear resistance of rail samples is much better than that of the wheel samples in the same wheel/rail system as shown in Figure 4. Moreover, it can be seen from Figure 7 that the friction coefficients of different wheel/rail systems are almost the same under the same axle load. However, the increases in axle loads enlarge the friction coefficient significantly, and the values are about 0.36, 0.42, and 0.53 for the axle loads of 16, 21, and 25 T, respectively.

Wear loss of samples under different axle loads: (a) rail samples, (b) wheel samples, and (c) wheel and rail samples.

Macrographs of hot rolled U71Mn wheel/rail system under different axle loads: (a) wheel samples and (b) rail samples.

SEM micrographs of the microstructure: (a) CL60 wheel samples, (b) hot rolled U71Mn rail samples, and (c) quenched U75V rail samples.

Friction coefficient plotted against rail materials under different axle loads.
Analysis of worn surfaces and wear debris
In an attempt to identify the wear mechanism of wheel/rail samples taking place under different axle loads, the wear scars were examined by SEM. Figures 8 and 9 show the micrographs of the wear scars of different wheel/rail samples. In the case of wheel samples, delamination of large flakes has been observed which results in a very rough wear scar bed. This is generally evident in case of severe wear conditions, not only for different materials but also for different axle loads. Fracture ridges and fractured flakes have created dimples in the scar bed which show plowing action on the sample and typical gouging (especially shown in Figure 9(b) and (c)). 20

Wear scars of the hot rolled U71Mn wheel/rail samples under different axle loads: (a) wheel under 16 T, (b) wheel under 21 T, (c) wheel under 25 T, (d) rail under 16 T, (e) rail under 21 T, and (f) rail under 25 T.

Wear scars of different wheel/rail materials under the axle load of 16 T: (a) wheel samples coupled with hot rolled U75V rail, (b) wheel samples coupled with quenched U71Mn rail, (c) wheel samples coupled with quenched U75V rail, (d) hot rolled U75V rail samples, (e) quenched U71Mn rail samples, and (f) quenched U75V rail samples.
Figure 8(a)–(c) shows typical wear scars of wheel samples coupled with the hot rolled U71Mn rail steel after 24 h of rotating at 16, 19, and 25 T, respectively. At a low axle load of 16 T, the delaminated flakes are rather fine, and many delaminated layers can be observed on the wear scar. As the axle load increases, the size of the delaminated flakes enlarges significantly. It looks like a whole piece of flake delaminating from the surface (Figure 8(c)). Furthermore, as the axle load increases, some thin flake dusts are adhesive to the surface with some local delamination on the rail samples, as shown in Figure 8(d)–(f). The analysis above indicates that the wear degree varies from mild to severe while the axle load increases.
The wear scars of different wheel/rail samples under the axle load of 16 T are shown in Figures 8 and 9. The roughnesses of different rail/wheel samples under the axle load of 16 T are presented in Figure 10. For the wheel samples, flake delaminations and some dimple formations are observed. At a highest hardness ratio (0.866), as shown in Figure 8(a), some thin flakes are confirmed on the surface. As the hardness ratio decreases to 0.816 (Figure 9(a)), the wear surface exhibits some ripples, and wear particles with much smaller size are produced predominantly in the troughs of the ripples. In addition, some large flakes and big dimples with low depth are produced on the surface. With the hardness ratios continually decreasing, as shown in Figure 9(b) and (c), the wheel surfaces are extremely rougher in comparison with the wheel surface at a higher hardness ratio (Figure 10(a)): it is not caused by the delamination of the flakes from the surface but some large particles being torn away from the surface. However, the roughnesses of the wear scars on rail samples are much smoother than those on the coupled wheel steels, as depicted in Figure 10. As the hardness ratio decreases, the wear scars of the rail samples become much smoother (Figure 10(b)). At high hardness ratios, there are many thin flake dusts adhesive to the surface of rail samples, as shown in Figures 8(d) and 9(d). With the decrease in hardness ratio, some fine delaminated flakes are exhibited on the rail surface, as shown in Figure 9(e). And when the hardness ratio is much lower, some pits generally evident of the fatigue damage can be observed, 21 as shown in Figure 9(f).

Roughnesses of different wheel/rail samples under the axle load of 16 T: (a) wheel samples and (b) rail samples.
SEM micrographs of wear debris from different wheel/rail systems are shown in Figures 11 and 12. Figure 11(a) and (b) shows the wear debris produced from hot rolled U71Mn wheel/rail system under the axle load of 16 and 25 T, respectively. At a low axle load (16 T), large smooth thin flakes are produced, and the flakes are usually only several micrometer thick but utmost to 100 µm in size approximately. With the increase in axle load, a wide size variation in debris particles can be observed in Figure 11(b). In this regime, not only a definite flake morphology is found for large particles of 200–300 µm in size but also some particles of <10 µm in size are generated. Wear debris depicted in Figure 12 is produced from the wheel/rail system with different rail materials at the axle load of 16 T. Compared with the wear debris of Figures 11(a) and 12(a), the retaining flake morphology in Figure 12(a) is smaller and less regular with rougher surfaces and shows a greater range of particle size. Moreover, Figure 12(b) and (c) shows the wear debris produced from the wheel/rail system of quenched U71Mn rail and quenched U75V rail, respectively. The flakes are much smaller than those shown in Figure 12(a), and the particles of <10 µm in size are in domination.

Wear debris of hot rolled U71Mn rail under different axle loads: (a) 16 and (b) 25 T.
Wear debris of different rail materials under the axle load of 16 T: (a) hot rolled U75V rail, (b) quenched U71Mn rail, and (c) quenched U75V rail.
Discussions
On the basis of the above analysis, it could be concluded that not only the increase in axle loads but also the decrease in the hardness ratio of wheel/rail steels contribute a lot to the wear performances of different wheel/rail steels. Moreover, the wear performance is determined by the wear mechanism. The main wear mechanisms of the wheel/rail steels under different conditions can be confirmed according to specific definition made by Bolton and Clayton. 22 When the wheel/rail system of hot rolled U71Mn rail steel is under a low axle load (16 T), the delaminated flakes are rather fine, and many delaminated layers can be observed on the wear scar; also, the observation of the wear debris shows many large thin flakes, and the flakes are in regular shape. Furthermore, the microstructure and the morphology of the rolling section of wheel/rail samples in longitudinal direction have been observed to investigate the damage performance, as shown in Figure 13. Plastic deformation along with the rolling direction and many fatigue cracks occur on the wheel/rail subsurface. As shown in Figure 13(a), some visible fatigue cracks generate and grow in low depth, which is the evident of the extremely thin delaminated flakes (Figure 8(a)). These are due to type I wear mechanism. As the axle load increases to a higher level (25 T), the delaminated flakes in irregular shape become much thicker, which is due to the fatigue cracks that grow much deeper and longer (Figure 13(b)). And this is the symbol of type Ш wear.

Subsurface changes of different wheel samples: (a) hot rolled U71Mn rail under the axle load of 16 T, (b) hot rolled U71Mn rail under the axle load of 25 T, (c) hot rolled U75V rail under the axle load of 16 T, and (d) quenched U75V rail under the axle load of 16 T.
What is more, the hardness ratios of wheel/rail steels play an important role in dominating the main wear mechanism. As analyzed above, type I wear mechanism dominates at a highest hardness ratio (0.866). With the hardness ratio decreased to 0.816, some ripples are exhibited on the surface, and wear particles with much smaller size are produced predominantly in the troughs of the ripples, and the microstructure of the subsurface shows that the subsurface microstructure consists of highly deformed ferrite and pearlite with small undulations in the deformation pattern (Figure 13(c)), which is the typical type II wear. With the continuous decrease in hardness ratio, the wheel surfaces are extremely rougher in comparison with the wheel surface at a higher hardness ratio: it is not caused by the delamination of the flakes from the surface but some large particles being torn away from the surface. The subsurface analyses (Figure 13(d)) deliver that the presence of extremely rough surfaces is confirmed, and deformation depths are irregular throughout individual specimens, which results from type Ш wear.
Moreover, the relationship between the total wear loss of the wheel/rail system and the hardness ratio of wheel/rail steel is shown in Figure 14. The linear simulation curve fitting (y = b*x + a) of the relationship has been made, and the results are shown in Table 4. As the hardness ratio of wheel/rail steel is not too large (<1.0), the total wear losses of the wheel/rail systems decrease with the increase in hardness ratios. Interestingly, at a low axle load (16 T), the absolute value of the slope is quite small (−1.05503); however, at high axle loads (21 and 25 T), the absolute values of the slopes turn into much larger (−3.33713 and −3.56373 correspond to the axle loads of 21 and 25 T, respectively). As the wear tests were carried out to simulate a train passing through a straight line, this indicates that the hardness ratio of wheel/rail steels has slight impact on the total wear loss at a low axle load. However, the decrease in the hardness ratio enlarges the total wear loss significantly at a high axle load.

Relationship between wear loss of the wheel/rail system and hardness ratio.
Fitting results of the relationship between wear loss and hardness ratio.

It is presented that for the straight line of the real wheel/rail condition, the wear and plastic deformation are dominant in heavy-haul rail, whereas the major damage of high-speed rail is fatigue. 23 For the wheel/rail systems under the axle load of 16 T, as shown in Figures 8(d) and 9(d)–(f), with the decrease in hardness ratio, the surface fatigue damage performance of rail steels becomes much worse. Moreover, the wear losses of rail samples, as shown in Figure 4(a), indicate that with the decrease in hardness ratio, the wear performance of rail steels becomes much better. As all the wheel/rail systems consist of CL60 wheel steel and different rail steels, if the main damage behaviors of rail steels are only considered, a proposal could be made that quenched rail with better wear resistance is suitable for heavy-haul railway, and hot rolled rail with better fatigue resistance is much more suitable for high-speed railway. However, the total wear loss of wheel/rail system with lower hardness ratio is much larger, as shown in Figure 4(c). Results from Figure 14 also indicate that the increase in hardness ratio reduces the total wear loss of wheel/rail system significantly at a high axle load. From the view of wheel/rail system, the proposal could be made that the hardness ratio of the heavy-haul railway should be raised, namely, the hardness of the wheel steel for heavy-haul railway should be raised to a degree close to the rail. However, for high-speed railway, the wear caused by hardness difference is beneficial for removing the fatigue cracks; thus, the wheel hardness should be smaller than the rail.
Conclusion
In this article, the wear behaviors between CL60 wheel steel and four kinds of rail steels under the creepage of 2.38% have been investigated by analyzing wear loss and micro-morphology. The main conclusions could be summarized as follows:
At a low axle load, the delaminated flakes are rather fine, and many delaminated layers can be observed on the wear scar; also, the observation of the wear debris shows many large thin flakes, and the flakes are in regular shape, which is due to the fatigue cracks that grow in low depth. With the increase in axle loads, the fatigue cracks grow much deeper and longer, and many flakes in irregular shape delaminate from the surface.
At a high hardness ratio of wheel/rail steel, the delaminated flakes are in regular shape and the thicknesses are much small, the subsurface microstructure consists of highly deformed ferrite and pearlite with small undulations in the deformation pattern, and the fatigue cracks grow in much low depth. With the decreases in the hardness ratios, some ripples are exhibited on the surface, and the wear scar becomes much rougher; the subsurface analyses deliver that the presence of extremely rough surfaces is confirmed, and deformation depths are irregular throughout individual specimens.
As the wear tests were carried out to simulate a train passing through a straight line, the relationship between the total wear loss of the wheel/rail system and the hardness ratio of wheel/rail steel indicates that the hardness ratio of wheel/rail steels has slight impact on the total wear loss at a low axle load. However, the decrease in the hardness ratio enlarges the total wear loss significantly at a high axle load.
In consideration of the dominant damage of heavy-haul railway and high-speed railway in the straight line of real wheel/rail condition, a quenched rail should be chosen for the heavy-haul railway, and the hardness of the wheel steel should be raised to a degree close to the rail. However, a hot rolled rail is much suitable for the high-speed railway; also, the wear caused by hardness difference between wheel and rail is beneficial for removing the fatigue cracks; thus, the wheel hardness should be smaller than the rail.
Footnotes
Academic Editor: Pranab Samanta
Declaration of conflicting interests
The author(s) declared no potential conflicts of interest with respect to the research, authorship, and/or publication of this article.
Funding
The author(s) disclosed receipt of the following financial support for the research, authorship, and/or publication of this article: This work is supported by Foundation of State Key Laboratory of Traction Power (no. TPL 1301), the Fundamental Research Funds for the Central Universities (no. SWJTU12CX037), and project supported by the Innovative Research Teams in Universities (no. IRT1178).