
Abstract
Monte Carlo simulations were performed for three-dimensional Ising model to study the relationships between magnetic Barkhausen noise and elastic stress of steel. The magnetization process was simulated and the dimensionless magnetic Barkhausen noise was calculated by the differentiation of magnetization. Coupling constant of energy exchange in Ising model is considered to be inversely proportional to applied tensile stress. The simulation results show that as coupling constant decreases, the magnetic Barkhausen noise increases, as proved by the experimental results.
Introduction
Non-destructive evaluation (NDE) technologies are widely used for assessing microstructure and mechanical properties of engineering parts. Among various NDE techniques, magnetic Barkhausen noise (MBN) is well known to be sensitive to several mechanical properties such as stress and hardness of ferromagnetic materials. MBN is caused by the discontinuous magnetic domain wall movement under external magnetic field. The MBN can be affected by phase, grain size, carbide precipitates, dislocations, and so on. Accordingly, from the macro-scope, the MBN can be used to characterize mechanical properties such as residual stress and hardness. Relationships between mechanical properties of ferromagnetic materials and MBN have been reported in numerous literatures.1–16 In the previous studies, MBN was commonly investigated by experiment. Recently, numerical methods are introduced to the area of MBN. Yamaguchi studied relationships between MBN and grain size, local dislocation and temperature of ferromagnetic materials by Ising model.17–19 Perez-Benitez et al. 20 used the random field Ising model with long-range interaction to simulate MBN. According to their study, the proposed method neatly reduces computational costs of simulation when compared with the traditional method. Results show that an internal demagnetizing effect that proceeds from the magnetic long-range interactions induces the appearing of a magnetic pattern in the region of magnetic avalanches. Sahai et al. 21 simulated the effect of thermal and mechanical parameters on magnetic Barkhausen emission (MBE) using Monte Carlo simulation for the two-dimensional Ising model. The effect of temperature, stress, and local disorder on MBE activity was discussed. Simulation results calculated by their model could show good agreement with well-established facts of temperature and stress dependency with MBM activity.
In this article, numerical simulations based on Monte Carlo method for three-dimensional Ising model were done to study the relationship between MBN and applied elastic stress, which agrees well with the experimental results.
Numerical method
A simulation was performed for an up and down spin system of three-dimensional clusters (Figure 1), which was composed of 203 = 8000 spins arrayed as the single cubic lattice for simplicity. A periodic boundary was used for the spin system. The total Hamiltonian of a spin system describing magnetism is given by equation (1)

where J means coupling constant of exchange interaction,
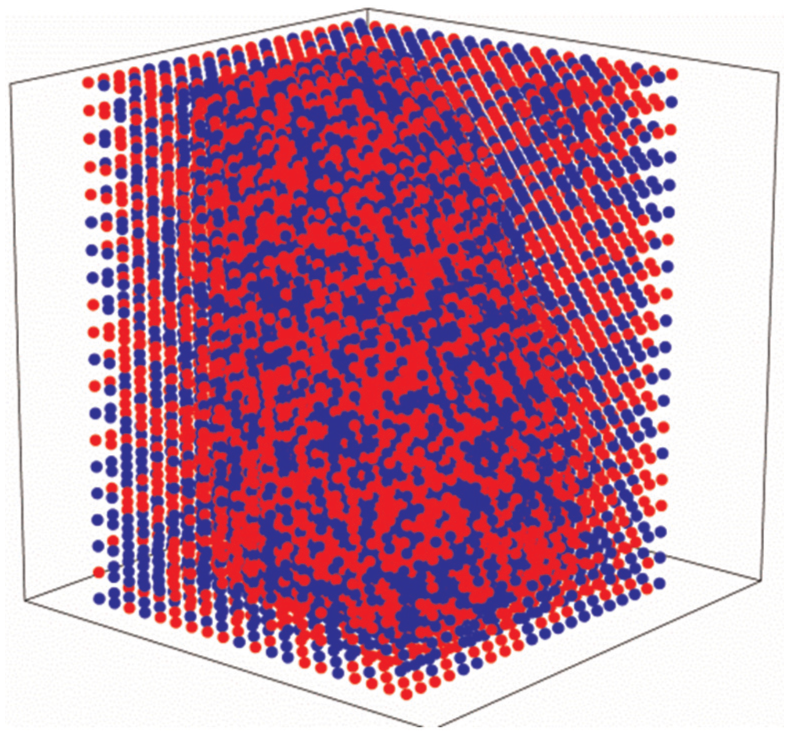
Snap shot of lattice with
The metropolis algorithm used for the Ising model was as follows: 22
Set the desired temperature T and H;
Initialize the spin system with a random state;
Perform a desired number of Monte Carlo sweeps through the lattice: (1) calculate the energy E. If
The Monte Carlo step (MCS) is repeated until getting equilibrium commonly. When the MCS is larger than a certain value of N, the simulation results will not increase with the increase in N. N is the sufficient number of MCS to get the equilibrium of the system. In the simulation of this article, 1 MCS means to scan up to total spin number (203) of times and N = 200 MCS was carried out for 1 applied magnetic field H. The magnetic field changes as a sinusoid wave between −5 and +5 with increment

The procedure is shown in Figure 2. The time history of magnetization (red line) is actually a high-frequency wave curve when it is enlarged, which is shown in the inset of the figure of the magnetization.

Example of a calculation result for magnetization M and the differentiation of the magnetization dM/dt under applied magnetic field.
Experiment
A uniform strength beam made of 22MnB5 steel is used to measure the MBN under five different tensile elastic strains: 0, 100, 300, 500, and 700µ, respectively. The excitation electromagnet consists of magnetizing yoke and magnetizing coil as shown in Figure 3. Sine signal is generated and amplified to drive the excitation electromagnet. Then, an alternating magnetic field is applied to the ferromagnetic sample, thus MBN can be induced. The frequency and amplitude of the sine excitation signal are 10 Hz and 12Vvpp, respectively. The MBN signal is picked up by a ferrite-cored search coil with 2000 turns of 0.11-mm-diameter wire. The picked-up signal is then amplified to a gain of 26 dB and acquired by a 16-bit data acquisition card. In the experiment, each measurement lasts for 10 s. Figure 4 shows the measured MBN sample signal in 0.5 s.

MBN measurement of uniform strength beam under elastic stress.

Measured MBN for high-strength steel uniform strength specimen at 0µ strain.
Results and discussions
In order to simulate the influence of the strain on the magnetic domain, the magnitude of coupling constants are assigned as J = 0.3, 0.4, 0.5, 0.6, and 0.7, respectively. This is reasonable as strain is applied along the direction of applied magnetic field, then magnetic domains are separated more compared and the coupling between spins becomes weaker in the direction of stress. As stress increases, the coupling constant becomes smaller. Bigger coupling constant means smaller stress. Accordingly, in the simulation, J is inversely proportional to the stress. The MBN under different strain conditions are simulated and compared with experimental results.
Figure 5 shows the relationship between MBN and J. As J decreases from 0.7 to 0.3, the MBN amplitude increases obviously. In order to analyze the relationship between MBN and J, root mean square (RMS) of the MBN is calculated as shown in Figure 6(a). RMS of the MBN can stand for the power of the MBN signal. As J decreases, the RMS increases. Figure 6(b) shows the RMS of the measured MBN as a function of strain. As strain increases, the MBN increases. It is well known that elastic stress can cause the change of susceptibility in the direction of stress. As tensile stress increases, the susceptibility increases too. 23 This results in the increase in MBN. Because in the simulation MBN increases as coupling constant decreases, it can be concluded that the tensile stress decreases the coupling constant.

Simulated MBN as a function of exchange interaction constant J.

(a) RMS of calculated MBN as a function of exchange interaction constant J and (b) measured MBN as a function of elastic strain.
Pulse number of MBN is also used to characterize the MBN, as shown in Figure 7. The noise signal is composed of numerous pulses which are directly caused by discontinuous movement of domain walls. Pulse number increases linearly as strain increases and as J decreases. Pulse height distribution of the MBN is also studied as shown in Figure 8. As strain increases, the peak of the distribution increases and the position of the peak increases. The pulse heights of both simulated and experimental MBN accord well with lognormal distribution as shown in Figure 8. Result of the simulation (Figure 8(a)) is clearer than the experiment (Figure 8(b)), because the change in J of simulation is actually much more than the change caused by strain.

(a) Pulse number of calculated MBN as a function of exchange interaction constant J and (b) measured MBN as a function of elastic strain.
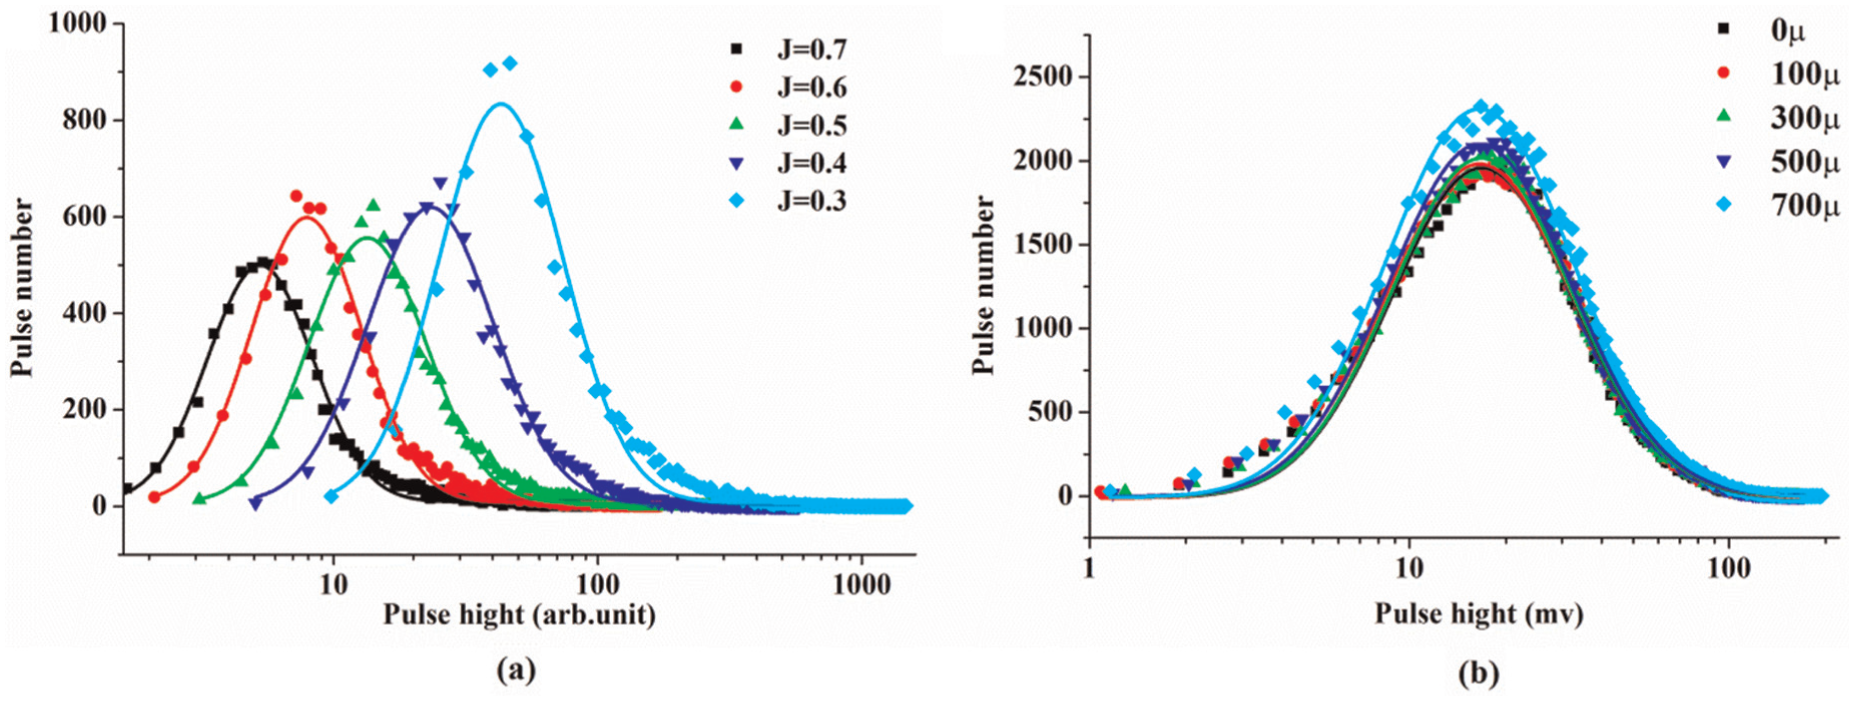
(a) Pulse height distribution of calculated MBN as a function of exchange interaction constant and (b) measured MBN as a function of elastic strain.
Conclusion
In this article, three-dimensional Ising model solved by Monte Carlo method is used to study the relationship between MBN and elastic stress of steel. The coupling constant J is inversely proportional to the elastic stress. In the simulation, as J decreases, MBN increases; in the experiment, as elastic strain increases, MBN increases. The results also show that the pulse heights of both simulated and experimental MBN agree with lognormal distribution.
Footnotes
Academic Editor: Ramoshweu Lebelo
Declaration of conflicting interests
The author(s) declared no potential conflicts of interest with respect to the research, authorship, and/or publication of this article.
Funding
The author(s) disclosed receipt of the following financial support for the research, authorship, and/or publication of this article: This study was supported by the National Natural Science Foundation of China (11502113).