
Abstract
When developing new products, it is important for a designer to understand users’ perceptions and develop product form with the corresponding perceptions. In order to establish the mapping between users’ perceptions and product design features effectively, in this study, we presented a regression-based Kansei engineering system based on form feature lines for product form design. First according to the characteristics of design concept representation, product form features–product form feature lines were defined. Second, Kansei words were chosen to describe image perceptions toward product samples. Then, multiple linear regression and support vector regression were used to construct the models, respectively, that predicted users’ image perceptions. Using mobile phones as experimental samples, Kansei prediction models were established based on the front view form feature lines of the samples. From the experimental results, these two predict models were of good adaptability. But in contrast to multiple linear regression, the predict performance of support vector regression model was better, and support vector regression is more suitable for form regression prediction. The results of the case showed that the proposed method provided an effective means for designers to manipulate product features as a whole, and it can optimize Kansei model and improve practical values.
Keywords
Introduction
When developing new products, it is important to understand user needs, desires, and preferences toward products. The success of a design depends to some extent on how well the designer “knows” the user and how quickly and accurately they catch users’ feelings and transform them into design elements and vice versa. Kansei engineering (KE) 1 is an effective methodology to study the cause-and-effect relationship between product features and users’ affective responses. At present, the studies based on KE are classified into two categories: 2 one is about user feelings, that is Kansei words toward a product such as Hsiao and Chen 3 and Chang; 4 the other explores the interrelationship between product features and affective response (Kansei words) and then gets a better insight into users’ subjective perceptions. For example, Lin et al. 5 presented a new fuzzy logic approach to determine the best combination of mobile phone form elements for matching a given product image. Yang and Shieh 6 introduced support vector regression (SVR) to develop a model that predicted consumers’ affective responses for product form design. By analyzing the relationship in a systematic way, a designed product form that meets specific users’ needs can be obtained more objectively and efficiently instead of only relying on designers’ intuition and experience.
In order to address this issue, this article studied from two aspects: the definition of product form feature and the construction of prediction model. On one hand, it is universally known that a product consists of features which transmit information to users and exert the effects on users’ mental feelings. In the existing studies, a product was broken up into several design features, and each feature was always defined as categorical choices with enumeration. For example, the product form of a mobile phone can be described as several design features-top shape, bottom shape, function button, layout…, each feature had different types of its own.7,8 And drip coffee makers 9 and digital cameras 10 were described in the similar ways. But there are several problems in this definition of the features: (1) The first phase of people’s visual information is the capture of the entirety of objects instead of the constituting units of visual image. 11 Product features with enumeration separate the relationship between the parts and the whole product, and the selection of features based on expert opinions often lacks objectivity, the results would be influenced by experts’ knowledge and subjective thinking. (2) The results of studying several features separately might not be the same as those of studying them as a whole, the absence or presence of product features may change product image, each feature would have different contributions for the whole image, the interactions among product features lead to different emotional attributions. For example, a study that focuses only on a sports car’s windshield suggests that a particular type of windshield satisfies a desired Kansei. However, a study concerning the overall appearance of the sports car may tell a different story that the selected windshield does not fit well. (3) Without considering the characteristics of designer concept representation, the definition of product form feature is not fit for designers’ habits. And extracting product features from existed products does not help to product innovation and design knowledge accumulation. On the other hand, users’ perception forecasting has become one of the most important issues in designing products. Regression models were used to construct the interactions between users’ perceptions and product features in the KE, including linear modeling and nonlinear modeling. Linear modeling techniques, such as multiple regression analysis (MLR), 12 partial least squares regression (PLSR), 13 depend heavily on an assumption of linearity. And nonlinear prediction models such as neural network (NN), genetic programming (GP), 14 and SVR 6 are also used to deal with the inter-attribute correlations and reconcile the nonlinear properties, 15 because users’ psychological perceptions are usually characterized by nonlinearity and uncertainty.
As mentioned before, during the product design process, designers’ concept should be based on the emotion of users. Further, designers’ concept representation is connected with users’ feeling aroused by product features. Based on the characteristics of design concept representation, designers get better insights as to how and what design features should be manipulated to increase users’ specific affective responses. In this study, a regression-based KE system based on form feature lines (FFLs) was put forward, FFLs which extracted from design representation were defined, and linear prediction model (MLR) and nonlinear prediction model (SVR) were used, respectively, to construct the connections between FFLs and users’ perceptions. Designers control product image through operating product FFLs to cater users’ affective needs, and then to improve the core competitiveness of product.
The reminder of this article is organized as follows. Section “Users’ perception and product form feature” presents a brief background review of users’ perception and product form feature. Section “Regression-based KE system based on FFLs” illustrates the methodology, and the basic notions of MLR and nonlinear SVR used in this method are introduced in this section. Section “A case study” discusses the proposed method, and the results of the proposed method are also verified by the case study of mobile phone design. Finally, the conclusions are drawn in section “Conclusion.”
Users’ perception and product form feature
The main aim of design is to make an object understand easily and communicate effectively. 17 Designers must have a deep understanding of users’ emotions and communicate with them. The information from users helps to establish the directions of future design products or provide feedback to complete ones. 18 But product implicit images are subjective, circumstance-related, related with users’ live experience, and the recurrence of part of perception experience in the psychological process, 19 the ambiguity of images shows the richness of meaning and leaves imagine space. Now Kansei words are used widely to express users’ perception for the products in the perceptual cognition experiments. The use of Kansei words provides good efficiency and satisfaction, 20 because they have some valuable clues concerned with users’ product images.
In the design process, the important task for designers is to evoke users’ specific affective responses through manipulating product shapes. One of the challenging issues in this process is to define appropriate representation of product features to effectively transmit users’ perceptions. At the same time, the representation should accord with designer’s cognitive habits. From the view of design flow, industrial designers are first to construct product style, draw feature lines, and then discuss the details. Designers always use two-dimensional curves to express an impression of a product in sketches and then develop three-dimensional (3D) model with these curves. Designers express product image which contains design style with some feature lines. That is to say, product image can be expressed explicitly by some specific curves and these curves also express designers’ intents. Many researchers carried out the studies about product feature lines. For example, Cheutet et al. 21 put forward that roof line, waist line, accent line, and wheelbase can be used to express automobile style from side view, as shown in Figure 1. Zhao and Zhao 22 extracted more than 20 automobile feature lines, and the main feature lines were thought to be the main factors of form style. Tan and Zhao 23 took side profile as the beginning point of design in a computer-aided computer numerical control (CNC) machine industrial design system. In this study, product FFLs were used to define product features. FFLs, which are consistent with product holistic style and accord with design habits, can express product form features explicitly and embody product images implicitly.

Automobile form feature lines from side view. 21
When establishing KE model, it is necessary to decide upon the major features that have a relatively big influence on affection. Based on the characteristics of design concept representation, the critical FFLs are defined with parameters, and product image is reflected as a whole with the parameters of lines. Then, users’ perceptional differences to a product are decided by the differences of design parameters of FFL. Through operating FFLs, users’ image perceptions and product features keep consistence, and it drives design process in the right direction. The cognitive interaction relationship between product form design and users’ perception is shown in Figure 2.

Cognitive interaction relationships between product form design and users’ perception.
In product design domain, designers try to convey product explicit functions and latent symbol meaning (product image) by manipulating product FFLs, and then the product produces emotional appeal to users and meets the target feeling. In the users’ domain, perception can be defined as the process of getting attention or understanding emotional information. There are two types of consciousness about perception: phenomenal and psychological. The former is full of visual sensation; the latter is related with emotion caused by the sensation. 24 According to the order of human cognition, after visual perception, users are inclined to get achieved feeling from inner image through reasoning and affective processing. The relationships between design features and subjective perceptions are deduced from the relationships between FFLs and inner image. Therefore, affective matching can be established whereby users’ perceptual needs would be met. The matching degree of cognitive and emotional process decides the success of product.
In this study, based on designers’ cognitive behavior, product FFLs which are more appropriate for design representation were used to express design features. And the relationships between parameter variables of product FFLs and product image style would be predicted and standardized by more precise math models. Designers make design results more suitable for users’ perceptions.
Regression-based KE system based on FFLs
According to the above discussion, a regression-based KE system based on FFLs for product form design was put forward. In this method, we tried to change the definition of product features in traditional KE and make it fit better with designers’ design representation, and the steps of design process are shown in Figure 3.

Framework of a regression-based Kansei engineering system.
Although there are many factors affecting product form, such as materials and colors, appearance is the only factor that is considered here. We will take other design features into account in the following study.
Each of these steps is described as follows.
Step 1: Collecting Kansei words. Kansei words are collected from websites, magazines, directories or received from design experts through open-ended questionnaires. As many Kansei words as possible should be collected to cover the product image space.
Step 2: Through screening by design experts, the product image space is constructed: F = {F1, F2,…, Fn}.
Step 3: Collecting and screening product samples. According to the differences of form characteristics and similar degree evaluation methods, samples with high similarity or different colors are removed. In order to avoid the influences and controls from colors, textures, and brands, samples with neutral gray are kept and trademarks are deleted. Representative sample collection is represented as: P = {P1, P2,…, Pn}.
Step 4: According to the characteristics of design representation, product FFLs and relative feature elements which affect product image are extracted and described by feature points; the coordinates of each point are recorded.
Step 5: Selecting survey participants. Defining target users according to the products.
Step 6: Kansei words and product samples discussed above are combined to generate a questionnaire survey for describing the users’ perceptions of the products. The semantic differentials (SD) method 25 is used widely to evaluate the collected image adjective pairs. In accordance with the 7 ± 2 limit on an individual’s capacity of processing information, 26 5-, 7-, or 9-point scale is used in the semantic scale to describe the degree of emotional evaluation caused by product samples, and then the image space is formed by the evaluation results.
Step 7: Collecting the evaluation results and calculating the mean values. The evaluation results are organized in a matrix form, shown as equation (1)

where I is the ith representative product; J is the jth Kansei adjective pair; k is the total number of participants;
Although the image space constructed by Kansei words can transfer users’ perception to a product, large volumes of data with complicated relations make a product image unclear. The means of evaluation results are used to decrease the dimensions of data, shown as equation (2)
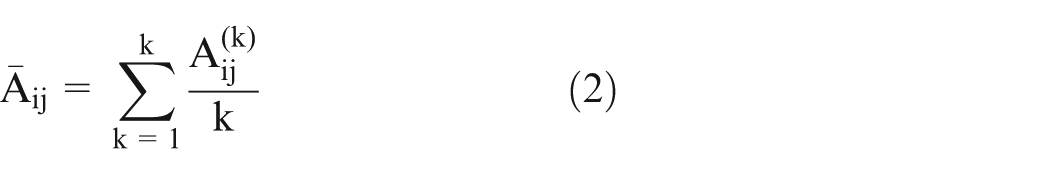
where
Step 8: Reducing image space with factor analysis. Factor analysis as an extraction technology is applied to above SD experimental data. Based on the internal dependency relations of relevant data, the principle component analysis of factor analysis is used to extract common factors, and Kansei words that have less contributions to evaluation variables are deleted; then using varimax method, the selected factors are rotated, resulting in more significantly and easily explainable factors with the given threshold, and the cumulative variance contribution would be more than 85%. Therefore, product key images are obtained. The principal components of the samples are represented as equation (3)

where y1, y2,…, ym are the principal component variables, X = [x1, x2,…, xn] is the vector of data matrix after standardization, (m < n), lij is the loading of factor yi for variable xj.
In order to describe quantitatively the amount of information provided by principal components, the variance contribution rate ci of principal component Yi and the cumulative variance contribution of the first k principal components ηk are defined as equation (4)

In general, k principal components are extracted and the total cumulative contribution of variance ηk is up to 85%.
Step 9: Establishing the relational model. With the regression technique, the prediction model of form features and image elements can be expressed as the function relation expression between independent variables and dependent variables. The model helps designers ensure that the key form design features can be used to predict the effects on the changes of images. •Linear regression
In the MLR model, there is a linear regression relation between a dependent variable y and independent variables x1, x2,…, xm

where α, β1,…, βm are the parameters generally estimated by least square method and ε is the random variable to express errors.
•Nonlinear regression–SVR
SVR method applies a hypothesis space of linear functions in a high-dimensional feature space, trained with a learning algorithm from the optimization theory.
The given samples are supposed as n-dimensional vectors, the samples and the corresponding values can be expressed as

where ω is the weight vector in the regression function, x is the matrix composed by input data, and b is the adjustable coefficient.
The SVR begins by introducing a loss function to minimize the regression risk. The different lost functions are used to establish different SVR models. In this article, the precision of the control algorithm can be achieved by the allowable error ε according to ε-SVR proposed by Vapnik. 27 L is the ε-insensitive loss function and defined as equation (7). It is employed to find out an optimum hyper plane on the high-dimensional feature space to maximize the distance separating the training data into two subsets. Thus, the SVR focuses on finding the optimum hyper plane and minimizing the training error between the training data and the ε-insensitive loss function

where ε is a precision parameter representing the radius of the tube located around the regression function f(x). Thus, SVR is formulated to produce minimized result from the following functional expression


where φ(x) is the high-dimensional feature space that is nonlinearly mapped from the input space x. The constant C is a regulation parameter. The slack variables,

The above support vector machine (SVM) regression is solved through establishing Lagrange function, and the problems are changed as maximizing the dual function of equation (12) for


where
Then, SVM regression transforms into a quadratic programming problem, and the regression function is obtained. Introducing kernel function
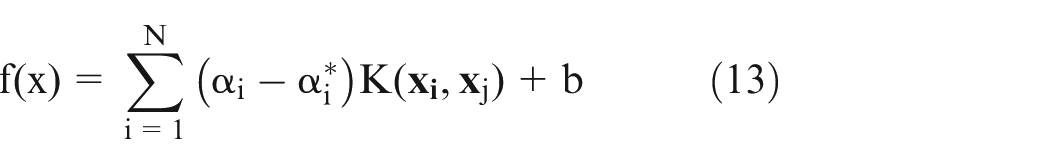
Here,
Step 10: Models verification. Manipulating product FFLs in 3D modeling software is to create new samples. Through the survey with new questionnaires, the image space of new samples is obtained; at the same time, the image distributions of new samples are predicted through the above relational models.
For the two predict models, paired t-test method is used to verify their effectiveness. Paired t-test is always used to compare the degree of differences of mean values in small samples, deduce the probability of the differences, and then determine whether significant difference exists in these two mean values. The predict values and experimental values in these two models are compared. And the root mean square error (RMSE) is also used as evaluation index to evaluate the performance of training models. The RMSE is defined as follows

where
A case study
In this study, the case of mobile phone design was used as an example to demonstrate the proposed method. The criterion for this type of product is based less on functionality yet more on user subjective assessment. Thus, removing nonsubjective factors (such as functionality) could possibly yield more reliable results in this case study.
Preparation stage
In order to reduce the mental workload of survey participants, some representative products were chosen in this case study. After consulting with industrial design experts, 32 mobile phones were collected to represent products’ space. The color, brand, and texture information of the product samples were ignored and the emphasis was placed on the form features only. These collected 32 samples, as shown in Figure 4, will be compared in the survey.

32 mobile phone samples.
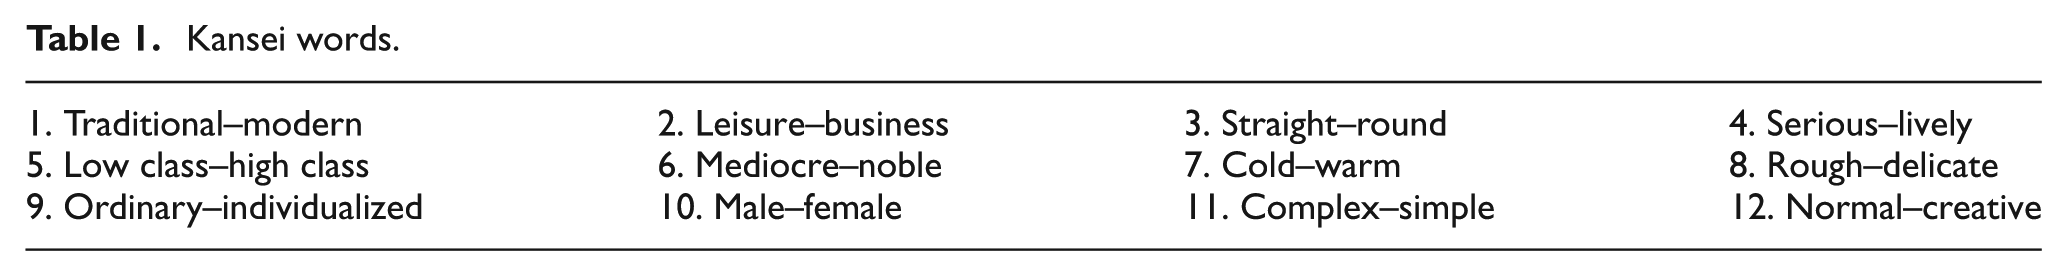
In order to cover image space, Kansei words were collected from websites, magazines, directories, and received through open-ended questionnaires. Three experienced industrial designers screened the adjectives according to experimental requirements and the samples. Adjectives related to product form were kept and any word related to color directly or indirectly, for example, bright or colorful, was removed. As a result, 12 pairs of Kansei words were listed as negative–positive word pairs, as shown in Table 1.
Kansei words.
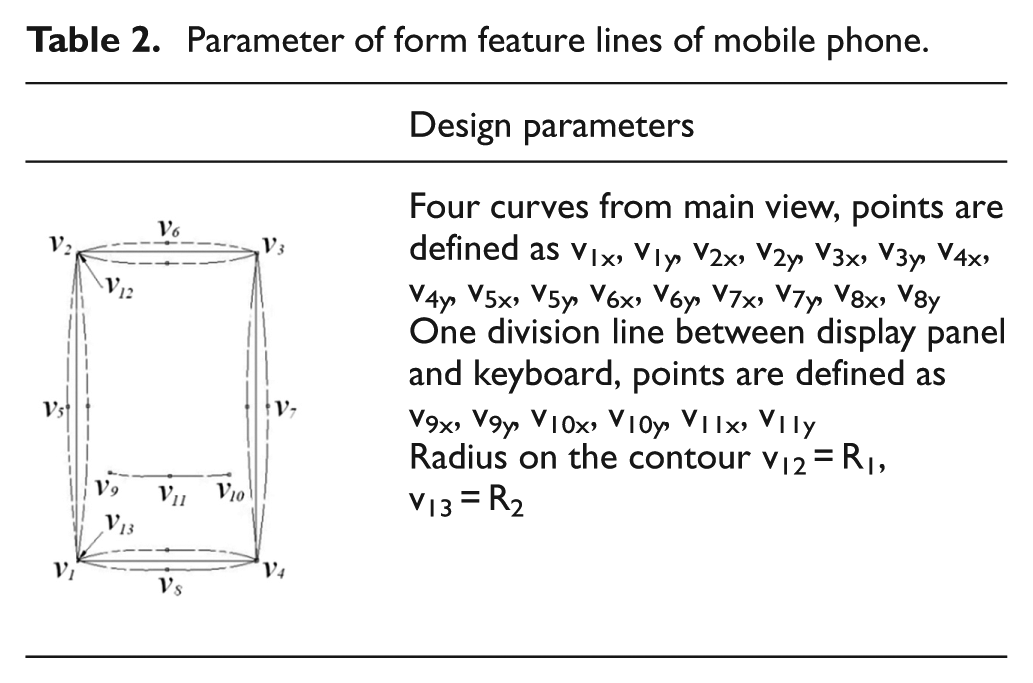
3D feature lines from main view were thought as the main product FFLs of mobile phone. These lines include four curves and a division line between display panel and keyboard. Because the feature lines are approximate arcs, the definition of feature lines was simplified as three feature points, as shown in Table 2.
Parameter of form feature lines of mobile phone.
To collect the evaluation data in a more effective way, a user-friendly questionnaire was designed and the interface was shown in Figure 5. The evaluation data of each participant can be recorded directly; thus, the post-processing procedure of the data was simplified.
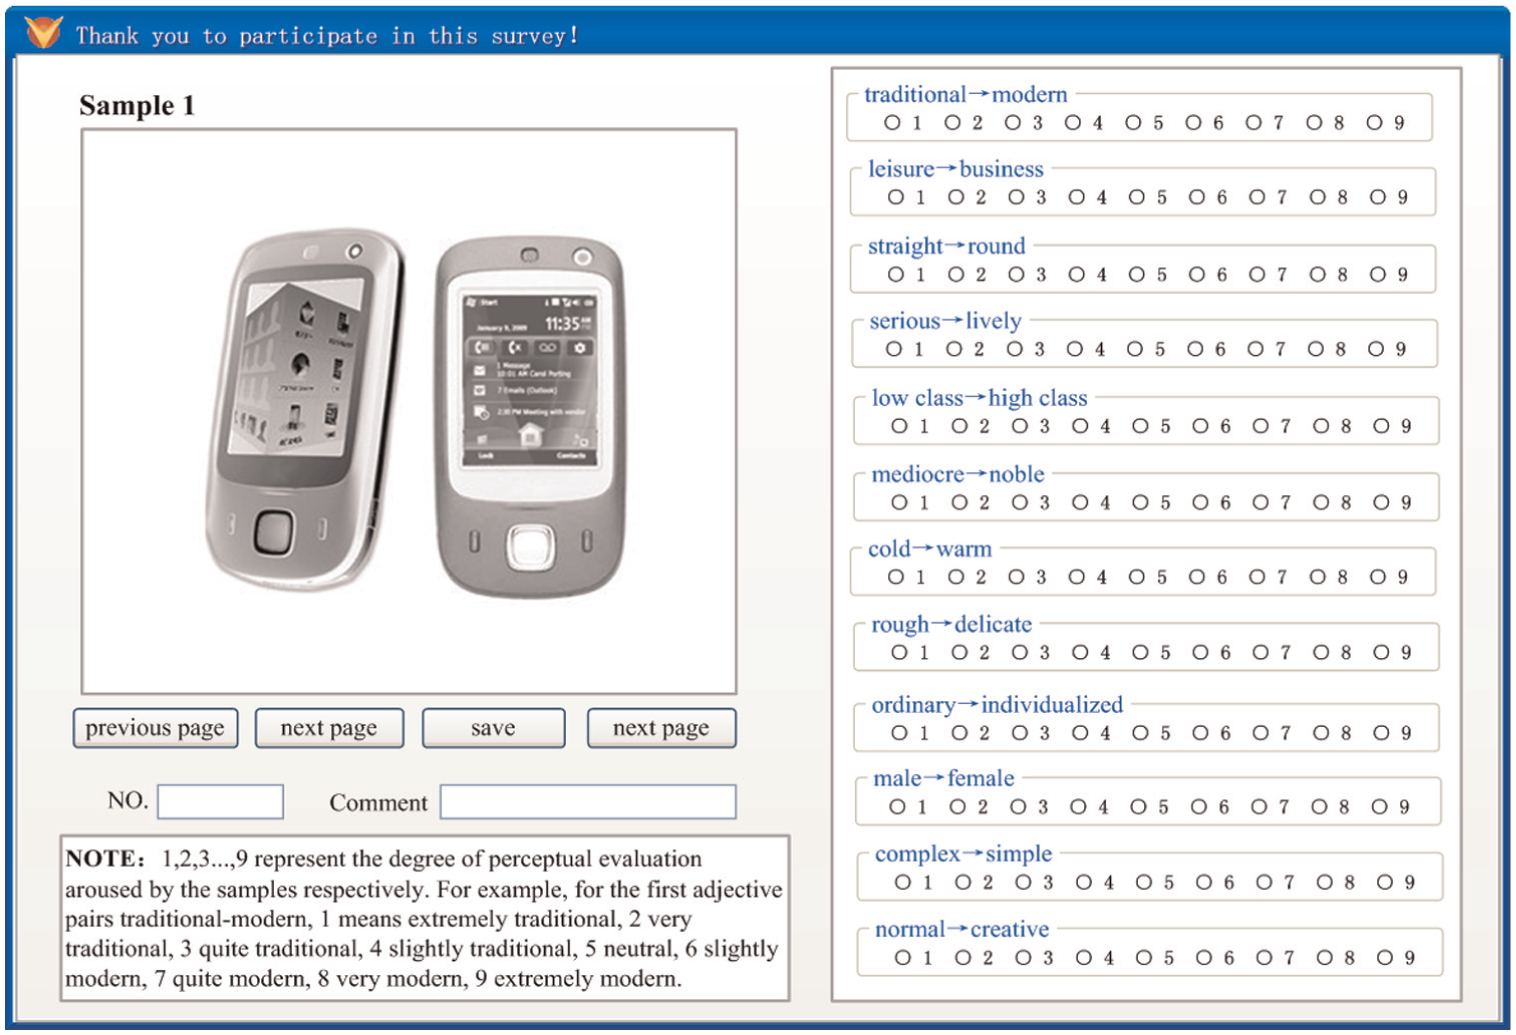
Interface of evaluation program.
In this article, Likert 9 was applied. A score of 9 means that the participant has a very strong impression of the mobile phone sample in terms of the right-side adjective, while 1 for a very weak impression of the right-side adjective or a very strong impression of the left-side adjective. We put the representative sample with Kansei words together in the evaluation program.
Experiment stage
Among the 40 participants, 13 were females, 27 were males; participants with product design background and those with engineering background were 20 and 20, respectively. They were invited to evaluate product images after browsing the pictures of the samples.
Data analysis stage
Statistical analyses were carried out using the statistical package SPSS 17.0. The raw data were collected and processed as average values to reduce dimensions.
Factor analysis was conducted using an extraction method to analyze the means of image evaluation based on the principle component analysis. According to the semantic characteristics, factors can be defined as three-axis factors. Their contribution rates were 56.38%, 20.17%, and 13.11%, respectively, and their cumulative contribution rate was 89.66%. The results are shown in Table 3.
Factor analysis results.

The bold values indicate the 3 groups of Kansei words associated with 3 axis factors.
According to the factor loading value, the image set was composed of four Kansei words which had higher loading values: F = {normal–creative, traditional–modern, ordinary–individualized, leisure–business}.
Construction of regression prediction models
Linear regression model–MLR model
In this stage, the coordinates of FFLs were independent variables and the evaluation mean of Kansei words was dependent variables, and MLR method was carried out to obtain a prediction model. In this model, the least square method was used to find a solution, and each corresponds to Kansei word, as shown in Table 4.
Multi-linear model for the product form lines.

Nonlinear regression model–SVR model
The four Kansei words obtained from above factor analysis and the samples were used to establish SVR model. We chose Gaussian RBF as kernel function. The Gaussian RBF kernel is not only easier to implement, but also is capable to nonlinearly map the training data into an infinite dimensional space. Since the size of product samples is small, it is important to obtain best generalization performance and reduce the overfitting problem. The most frequently used technique to obtain optimal training parameters C, σ2, ε is to conduct a grid search combined with k-fold cross validation (CV). 28 In order to obtain the best generalization performance and reduce the overfitting problem, fivefold CV was used for choosing the optimal parameters. In the article, based on fivefold CV and grid search, the optimal parameters C and g(2048, 0.000122) were obtained by training the training sets in the SVR model. 29
Verification stage
Five mobile phone samples were created using Rhinestone™ software as shown in Figure 6. To eliminate other influences, other design elements were kept the same.

Five models of mobile phone samples.
First, according to the design feature parameters of five new samples, the predicted values of four Kansei words (normal–creative, tradition–modern, leisure–business, ordinary–individualized) were calculated by the prediction models. Next, new questionnaire survey was conducted to collect users’ image evaluation by SD method. The participants, different from the first survey, gave nine-point Likert assessment of the four Kansei words for five samples in evaluation program; all of the evaluation scores for each product sample were averaged to obtain the experimental values.
Significance tests were conducted to compare the experimental results with the predicted values through paired t-test in MLR and SVR models. The results of significance test, as shown in Table 5, are all more than 0.05, which means the experiment values were not different from the predicted values. Therefore, the models are of good adaptability and this method works reasonable well, as expected.
In the SVR model, the predict performance with RBF kernel function and optimal parameters C and g(2048, 0.000122) are shown in Figure 7; the predict values were fitted highly with the experimental data. So we concluded that it is suitable to establish users’ image predict model by SVR method with RBF kernel function.
The experimental values, MLR and SVR prediction values, and the performance comparison (RMSE) are shown in table 6.
Results of significance test for MLR and SVR.
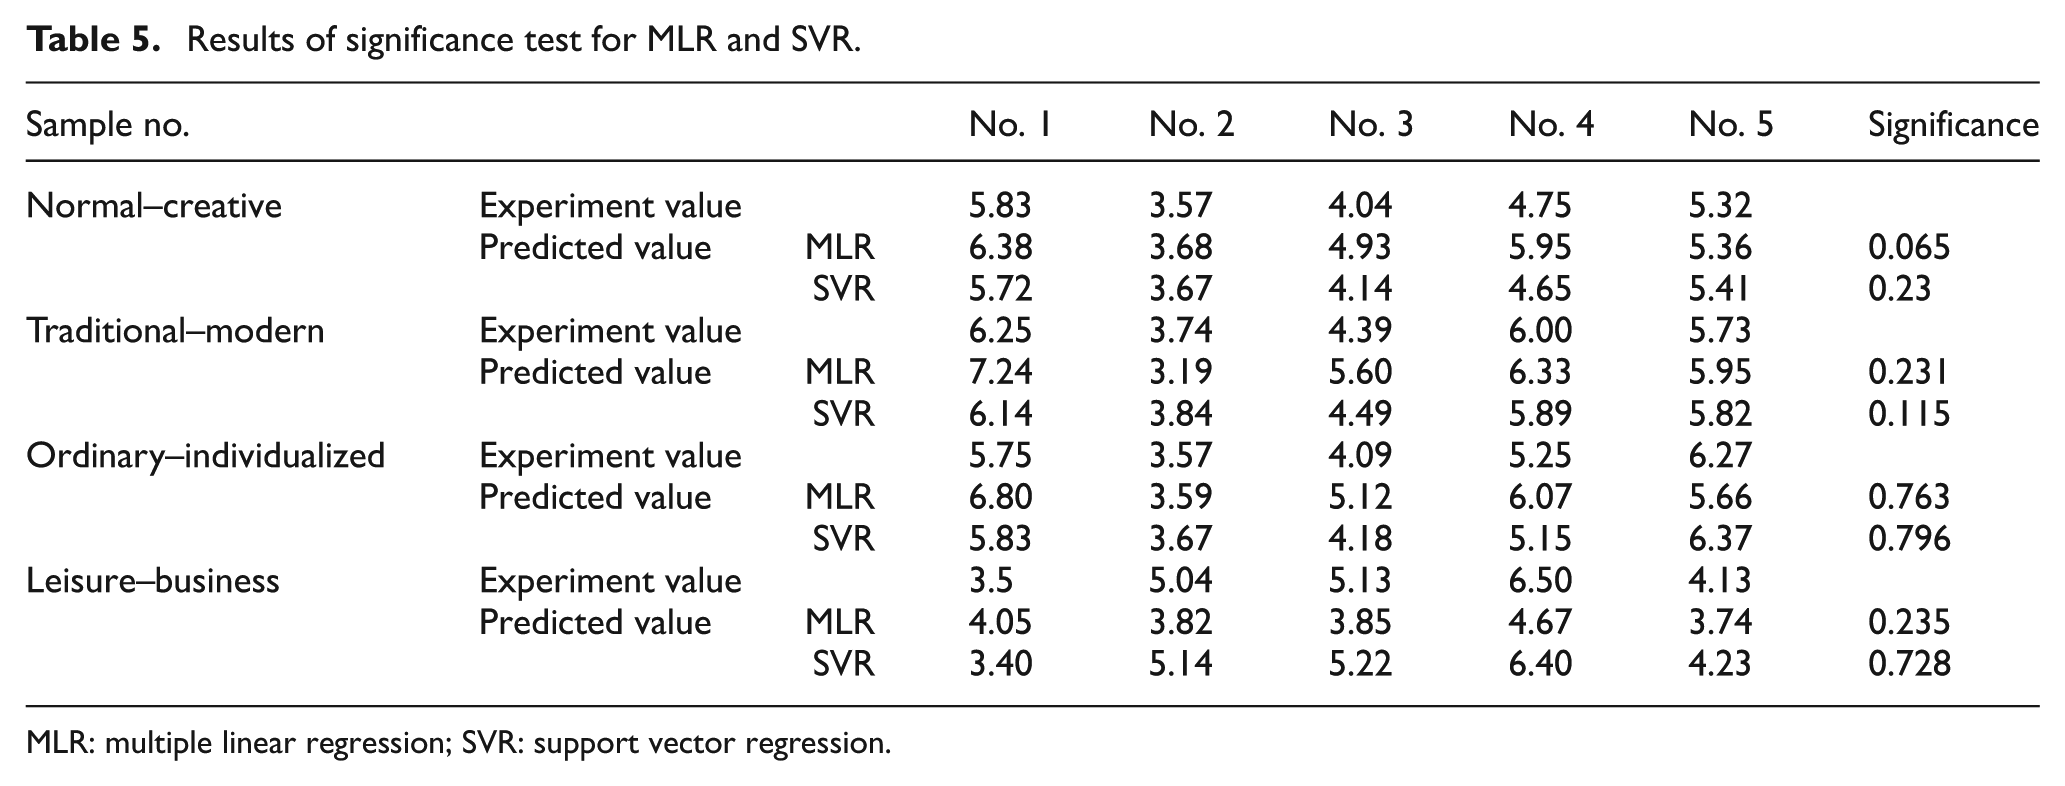
MLR: multiple linear regression; SVR: support vector regression.

Predictive performance of SVR with RBF kernel.
Prediction performance of regression models.

MLR: multiple linear regression; SVR: support vector regression; RMSE: root mean square error.
The predictive performance of MLR and SVR was compared in this study. MLR technique is one of the widely used modeling techniques to describe the relationship between design features and user’s perceptions and the RMSE results from our study have confirmed that MLR models provide a reliable means of predicting users’ perception to the product form, but the comparative results showed that the RMSE values in SVR model are much less than the values in MLR model. For example, for the Kansei words “normal-creative”, the RMSE value is 0.714 in MLR and 0.100 in SVR model; and for “traditional -modern”, the values are 0.762 and 0.102, respectively. This is because SVR has strong generalization capability and desired characteristics such as nonlinearity, global optimal solution, it has advantages to deal with the nonlinearity of many-to-many mappings between product form features and users’ images. From the results of the experiments, it is showed that SVR is better for form regression prediction than MLR. The SVR prediction performance gives better results for product image.
Conclusion
Taking product as a communication media between designers and users, product image tries to explain the information which product conveys or represents. Proper design representation helps to provide design features, interpret useful information, and manipulate the effects on users’ perceptions. At the same time, the knowledge about users’ perception guides designers’ work. This article focused on strengthening the connection between designers’ representation and users’ perception by defining product feature as a whole. The findings of cognitive interactive mechanism between Kansei words and product features, together with design representation, enable the bridging of designers’ creativity and users’ needs, grasp users’ emotional needs accurately, and facilitate the development of competitive new products. 30
In this article, product form features were constructed with FFLs, products with similar image can be constructed by FFLs according to KE, users’ perceptions were influenced by the parameters of FFLs in a quantitative manner, the prediction models including MLR and SVR were established to connect product features and users’ perceptions, and the validation of this method was verified. In MLR and SVR with RBF kernel model, the results of t-test clearly showed no significant differences in the experiment. The RMSE values of MLR and SVR models for “normal-creative”, “traditional-modern”, “ordinary-individualized”, and “leisure-business” are (0.714, 0.1), (0.762, 0.102), (0.801, 0.094), and (1.177, 0.098), respectively. The results showed that these two models provide effective ways to connect users’ perceptions and product form, and SVR predict model has better predictive ability and is suitable in dealing with product form regression prediction. The proposed method is suitable for Kansei research, and it can optimize Kansei models and improve practical values. Meanwhile, it is reasonable to infer that the proposed method can be generalized to other consumer products such as consumer electronics, furniture, and automobiles, but more attention should be paid to the definition of FFLs and the construction of prediction model. Currently, some problems still exist in SVR such as selection of kernels and parameter optimization, which will result in different questions in the application for different products. For example, there are no appropriate kernel functions to choose and the optimization method for product parameters should be improved. These above issues should be further investigated in future studies.
Footnotes
Academic Editor: Teen-Hang Meen
Declaration of conflicting interests
The author(s) declared no potential conflicts of interest with respect to the research, authorship, and/or publication of this article.
Funding
The author(s) disclosed receipt of the following financial support for the research, authorship, and/or publication of this article: This work is supported by grants-in-aid from the National Natural Science Research Foundation of China (No. 51205262, 51435011).