
Abstract
The article observes the amount of vibration on the bearing house of a turning lathe selected in advance through the change of the revolutions per minute and the thickness of the removed material in frontal type of lathe processing. Increase in mechanical vibration values depending on the value of nominal thickness of splinter was observed during changing technological parameters of the drilling process as a consequence of rotation speed of the motor. The vibration acceleration amplitude course changes depending on the frequencies are evaluated together for 400, 800 and 1200 motor r/min. A piezoelectric sensor of the type 4507B-004 from the Brüel & Kjaer Company was used for monitoring the frequency analysis of the vibration, which was attached to the bearing house of the lathe TOS SV 18RB. The vibration signal measured during the processing and during the time period is transformed through the means of a quick Fourier transformation to the frequency spectrum in the range of 3.0–10.0 kHz. Measured values of vibration acceleration amplitude were processed and evaluated by the SignalExpress software.
Graphical abstract
Unwanted vibration in machine tools like lathe is one of the main problems as it affects the quality of the machined parts and tool life and creates noise during machining operation. Bearings are of paramount importance to almost all forms of rotating machinery and are the most common among machine elements. The article describes in more detail the issue of vibrations created when machining the material by lathe turning. It also includes execution, experiment evaluation in this field, and comparison of measured vibrations’ acceleration amplitude values according to the standards.


Keywords
Introduction
Research on mechanical vibration and methods for its elimination presently gained an importance. It relates to the spread of speed machining methods. Till now, the research on vibration issues during metal processing through machining was not sufficient. The difference and benefit of this article when compared to that of the work done by Gerard and from Eze is examining the effect of generating a vibration in the other working and operational conditions set during operation. The research will be focused on vibration measurements with different objectives, namely, to establish the most appropriate setting of operating parameters and optimize the machining process, eliminating the influence of vibrations. The expected result was obtained.1,2
Significant step forward was made in the research on basic and specific principles of vibration during metal machining. Vibration is an undesired effect during machining; therefore, this issue has to be addressed more frequently.3–5
The diagnostic evaluation methods are mainly based on objective and quality of data about the observed system, which we collect through either one-time measurement or long-term observation as is documented in the book by Helebrant and Ziegler 6 and Altıntaş et al. 7 Early determination of emerging defect has a big effect on the fluency and efficiency of production, on evaluation of the machine state, symptoms of machine damage, identification of damage, or life cycle prognosis. In our case, one of the three characteristic parameters will be used for the diagnosis in the field of mechanical vibration, namely, vibration acceleration. The goal of this article is to address the possibility of vibration during frontal drilling as a consequence of changing depth of removed material.
The practical significance of the research is the fact that an overview of the individual resources and the distribution of the sensor element interaction can be obtained using the set of measurements. From these measurements, it is possible to create a systematic concept for obtaining measurements of the intersection of elementary indicators, in the form of a frequency spectrum of signal with clearly distributed amplitude and frequency. Each measurement includes components generated by mutual interference, so only the intersection of several measurements can show useful vibrodiagnostic real signal. The measurement is only one elemental component of the whole concept of measurements, because it focuses only on one type of vibration sources and changes in those resources are production machining parameters.
Monitored indicators are vibration. The essence of diagnostics is to monitor the degree of deformation of the original signal on the output signal. Representative of diagnostic signals is the oscillations of the constituent parts whose intensity is determined by the intensity of shocks in elementary connections, such as bearings and thus the technical condition of these structural elements. The natural frequency of diagnostic signals is generated by a given weight and stiffness parameters of the various parts of the machinery.8,9
Measuring objects are individual parts of a lathe, which is believed to be the greatest effect of vibration, as they are situated close to the major parts of the rotary lathe. It is measured on the surface of a lathe using piezoelectric sensors and the gradual stoking of the sensors at various points of their fixing. Gradually, it makes changes to the process parameters and when any change is made, the measured data are saved in the database. The technique of data processing is provided by a special computer program that translates the measured electrical data into a numeric format of velocity and vibration acceleration. These are subsequently processed into a plot. Interpretation of results is processed as one of the elementary measurements for a particular production machine and the results allow recommendation on production tasks; especially mass production, appropriate and optimal working conditions bring the production with the lowest machine wear and prolong its life and functionality. At the same time, the measurement is one part of the whole complex in which it will be possible to form an appropriate mathematical statistics’ intersection of elementary indicators, in the form of a frequency spectrum of signal, which is clearly distributed in amplitude and frequency. The company benefits are less cost, and production benefits are less losses, increased machine life, and higher quality production. 10
Analysis of current state
During material processing through machining, complex vibration processes occur. They occur in the system machine-tool-processed material. Sometimes, the vibration is so small that it does not have any negative effect. However, there are also cases when the vibration is very intense during machining. From the physical nature point of view, various types of vibration can occur in the system, stated as per Sidhpura 2012—own vibration, forced vibration, and a self-occurring vibration.11–13 Forced and self-occurring vibrations are undesired effect during the processing, excluding some specific cases such as processing through forced vibration knife, during which a better creation of splinter occurs, and reduced intensity of cutting edge wear of the tool as is documented by Mádl. 14
During the processing and also when there is no visible vibration, the cutting force fluctuates continuously. Immediate size of the cutting force ranges around the median. Especially the fluctuation is caused mainly by the unbalanced attributes of the processed material, irregularities of the processed surface, which is documented in the book by Mádl. 14 To demonstrate this, Figure 1(a) depicts the simplified model of the processing system, which characterizes the state during orthogonal processing during machining.15–17

Model of the processing system during machining: (a) material before processing and (b) material after processing.
Physical point A in point of interaction of the processed material and the tool vibrates due to changing forces Fc and Fcn in the direction of the z-axis and in direction of the y-axis with certain frequencies and amplitudes. Vibration of individual elements of the processing system can also cause the increase in tool wear, destruction of the tool, increase in processing noise, or malfunction of the processing machine.18,19 For the purposes of experiments and evaluation of measured values of vibration acceleration, basic theories (vibration and oscillation theory, systems theory, measurement theory, experiments, and probability theory) and basic methods (vibration diagnosis method, methods of measurement waveforms and amplitudes, methods for frequency spectrum generation, and mathematical statistics methods) were used.20–22
Experimental conditions
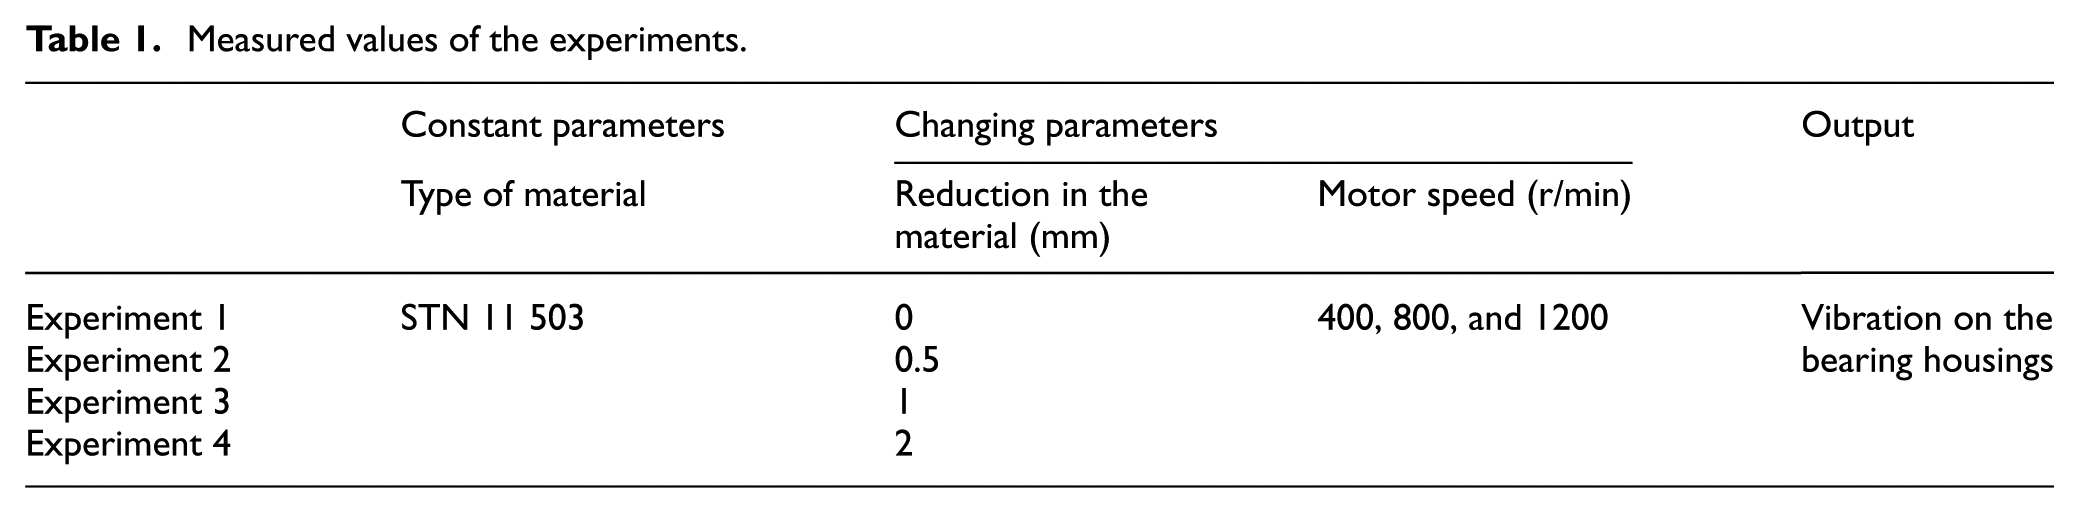
The experiments were performed in the laboratory of splint processing on alloy type construction steel of the type STN 11 503 class 11. There have been 12 consecutive measurements in four experiments. Input constant and changing technology and material parameters, under which the experiments have been carried out, are listed in Table 1. Figure 1(b) depicts the material steel type STN 11 503 class 11 before and after processing.
Measured values of the experiments.
Description of the technical system during the measurement and evaluation of the vibration
A piezoelectric sensor of the type 4507B-004 from the Brüel & Kjaer Company was used for monitoring the frequency analysis of the vibration, which was attached to the bearing house of the lathe TOS SV 18RB through magic glue (Figure 2).

Attachment of the vibrations sensor on the bearing house of the lathe.
The piezoelectric sensor of the vibrations monitors the vibrations during the processing in the direction of the lathe processing axis. The data collector records the acceleration of the vibration signal and integrates it with the speed of the vibration signal. 23 Acceleration as a physical quantity at most corresponds to the size of vibration, and it is given only acceleration. The vibration sensor measures the speed value, which subsequently transforms into acceleration by converter using mathematical operation of integration.24–26
Vibration acceleration amplitudes recorded in the axis of the lathe processing in this way are written into the memory of the Compact DAQNI 9233 device of the National Instruments Company and are evaluated in the frequency spectrum through a means of a quick Fourier transformation. This allows determining the quantity of the harmonic frequencies in the monitored signal. The evaluated signal can then be immediately observed on a portable computer, thanks to the SignalExpress software. The SignalExpress program contains several functions necessary for the proper evaluation, recording, and analysis of the measurements. 23
Measured values of the experiments
The vibration signal measured during the processing and during the time period is transformed through a means of a quick Fourier transformation to the frequency spectrum in the range of 3.0–10.0 kHz. The graphic dependencies of the vibration acceleration amplitude course changes depending on the frequencies are evaluated together for 400, 800, and 1200 motor r/min (these rotation speeds were selected as working parameters, because only these speeds can be adjusted by discrete changing of machine transfer). The vibration acceleration amplitude course changes for frequencies of 400, 800, and 1200 motor r/min and material removal of 2.0 mm are graphically displayed as an example in Figure 3. Graphical dependencies of the vibration acceleration amplitude and vibration frequencies for 400, 800, and 1200 r/min without load and with material removal of 0.5 and 1.0 mm have also been analogously displayed.
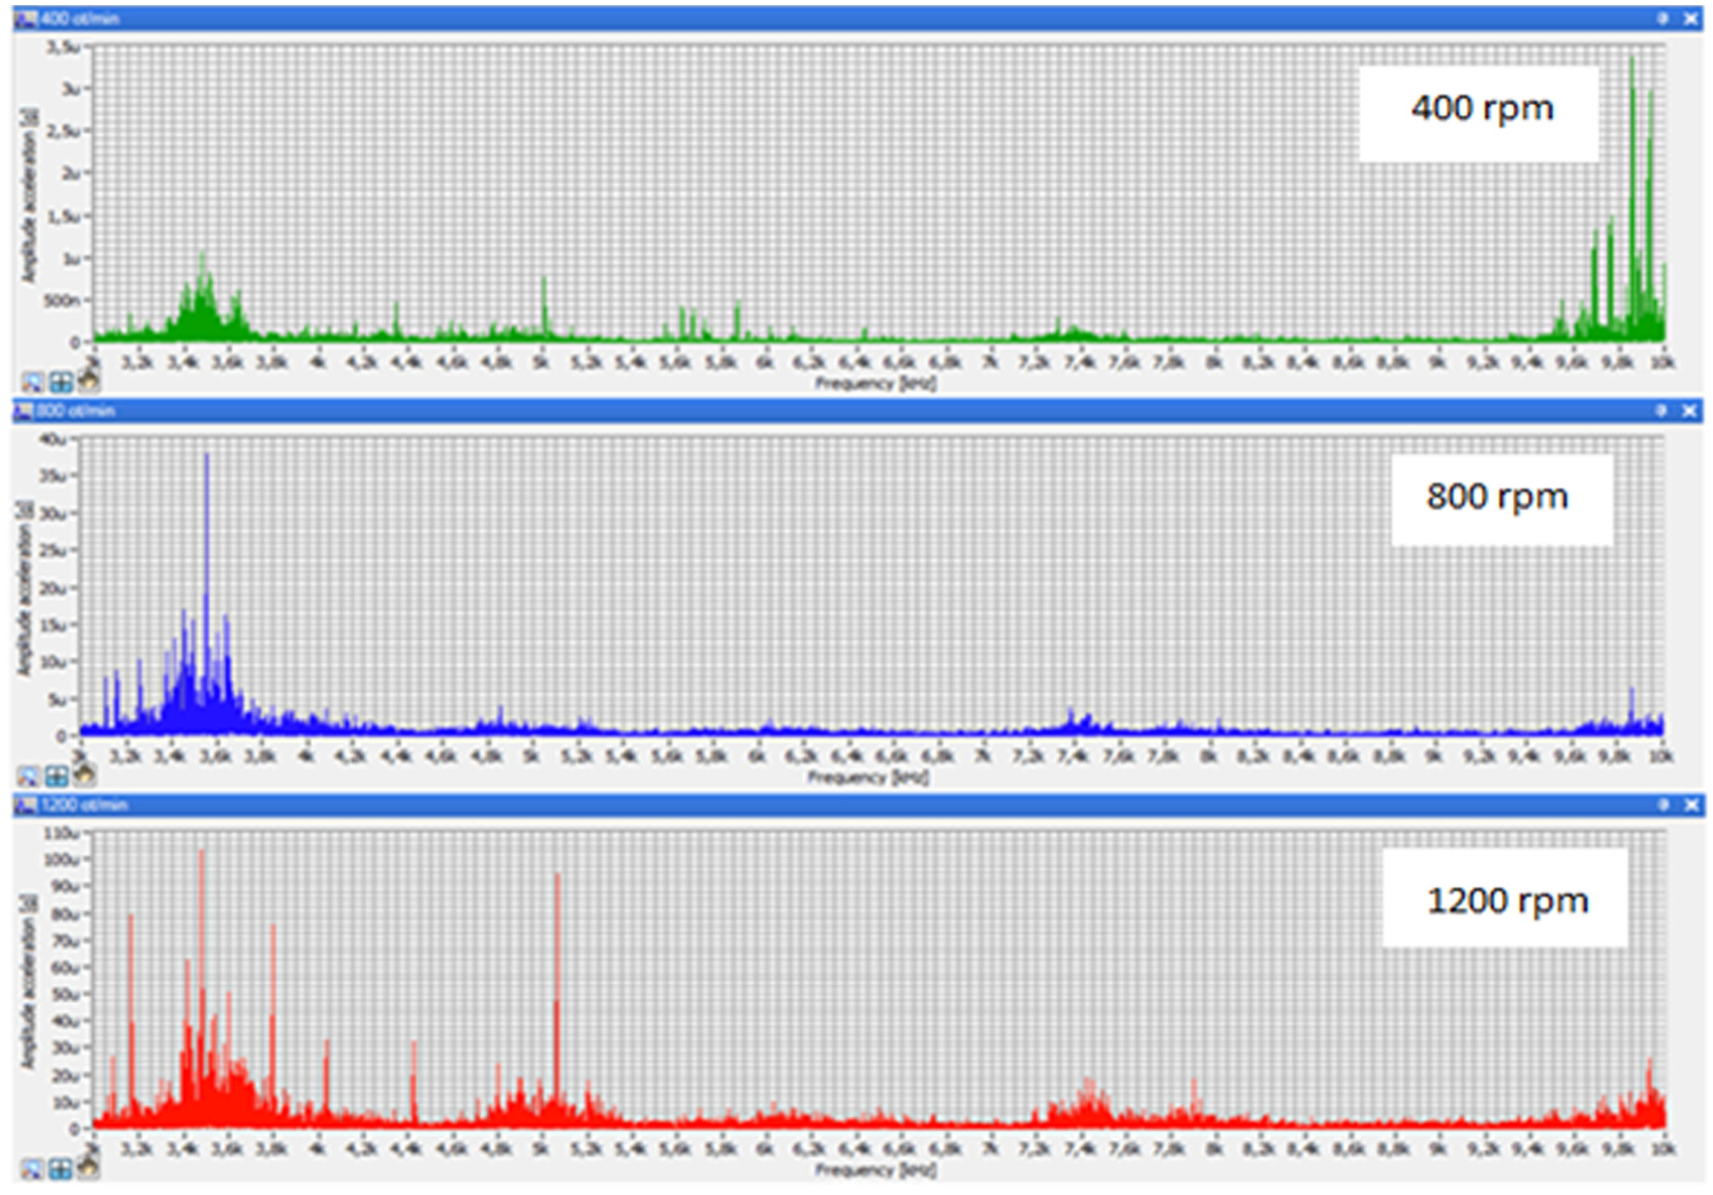
Graphical dependency of the vibration acceleration amplitude on the frequency with material removal of 2.0 mm.
Based on graphical representations of vibration acceleration amplitudes, vibration frequency spectrum covers on the housing have been created and based on the comparison graph, frequency spectrum covers for the common set of experiments have been created. Figure 4(a) depicts the comparison graph of frequency spectrum covers combined for the selected set of spindle rotation speeds of 400, 800, and 1200 r/min without a load. Comparison graph of frequency spectrum covers for motor rotation speeds 400, 800, and 1200 r/min with material removal of 0.5 mm is depicted in Figure 4(b), with material removal of 1.0 mm in Figure 4(c) and with material removal of 2.0 mm in Figure 4(d).
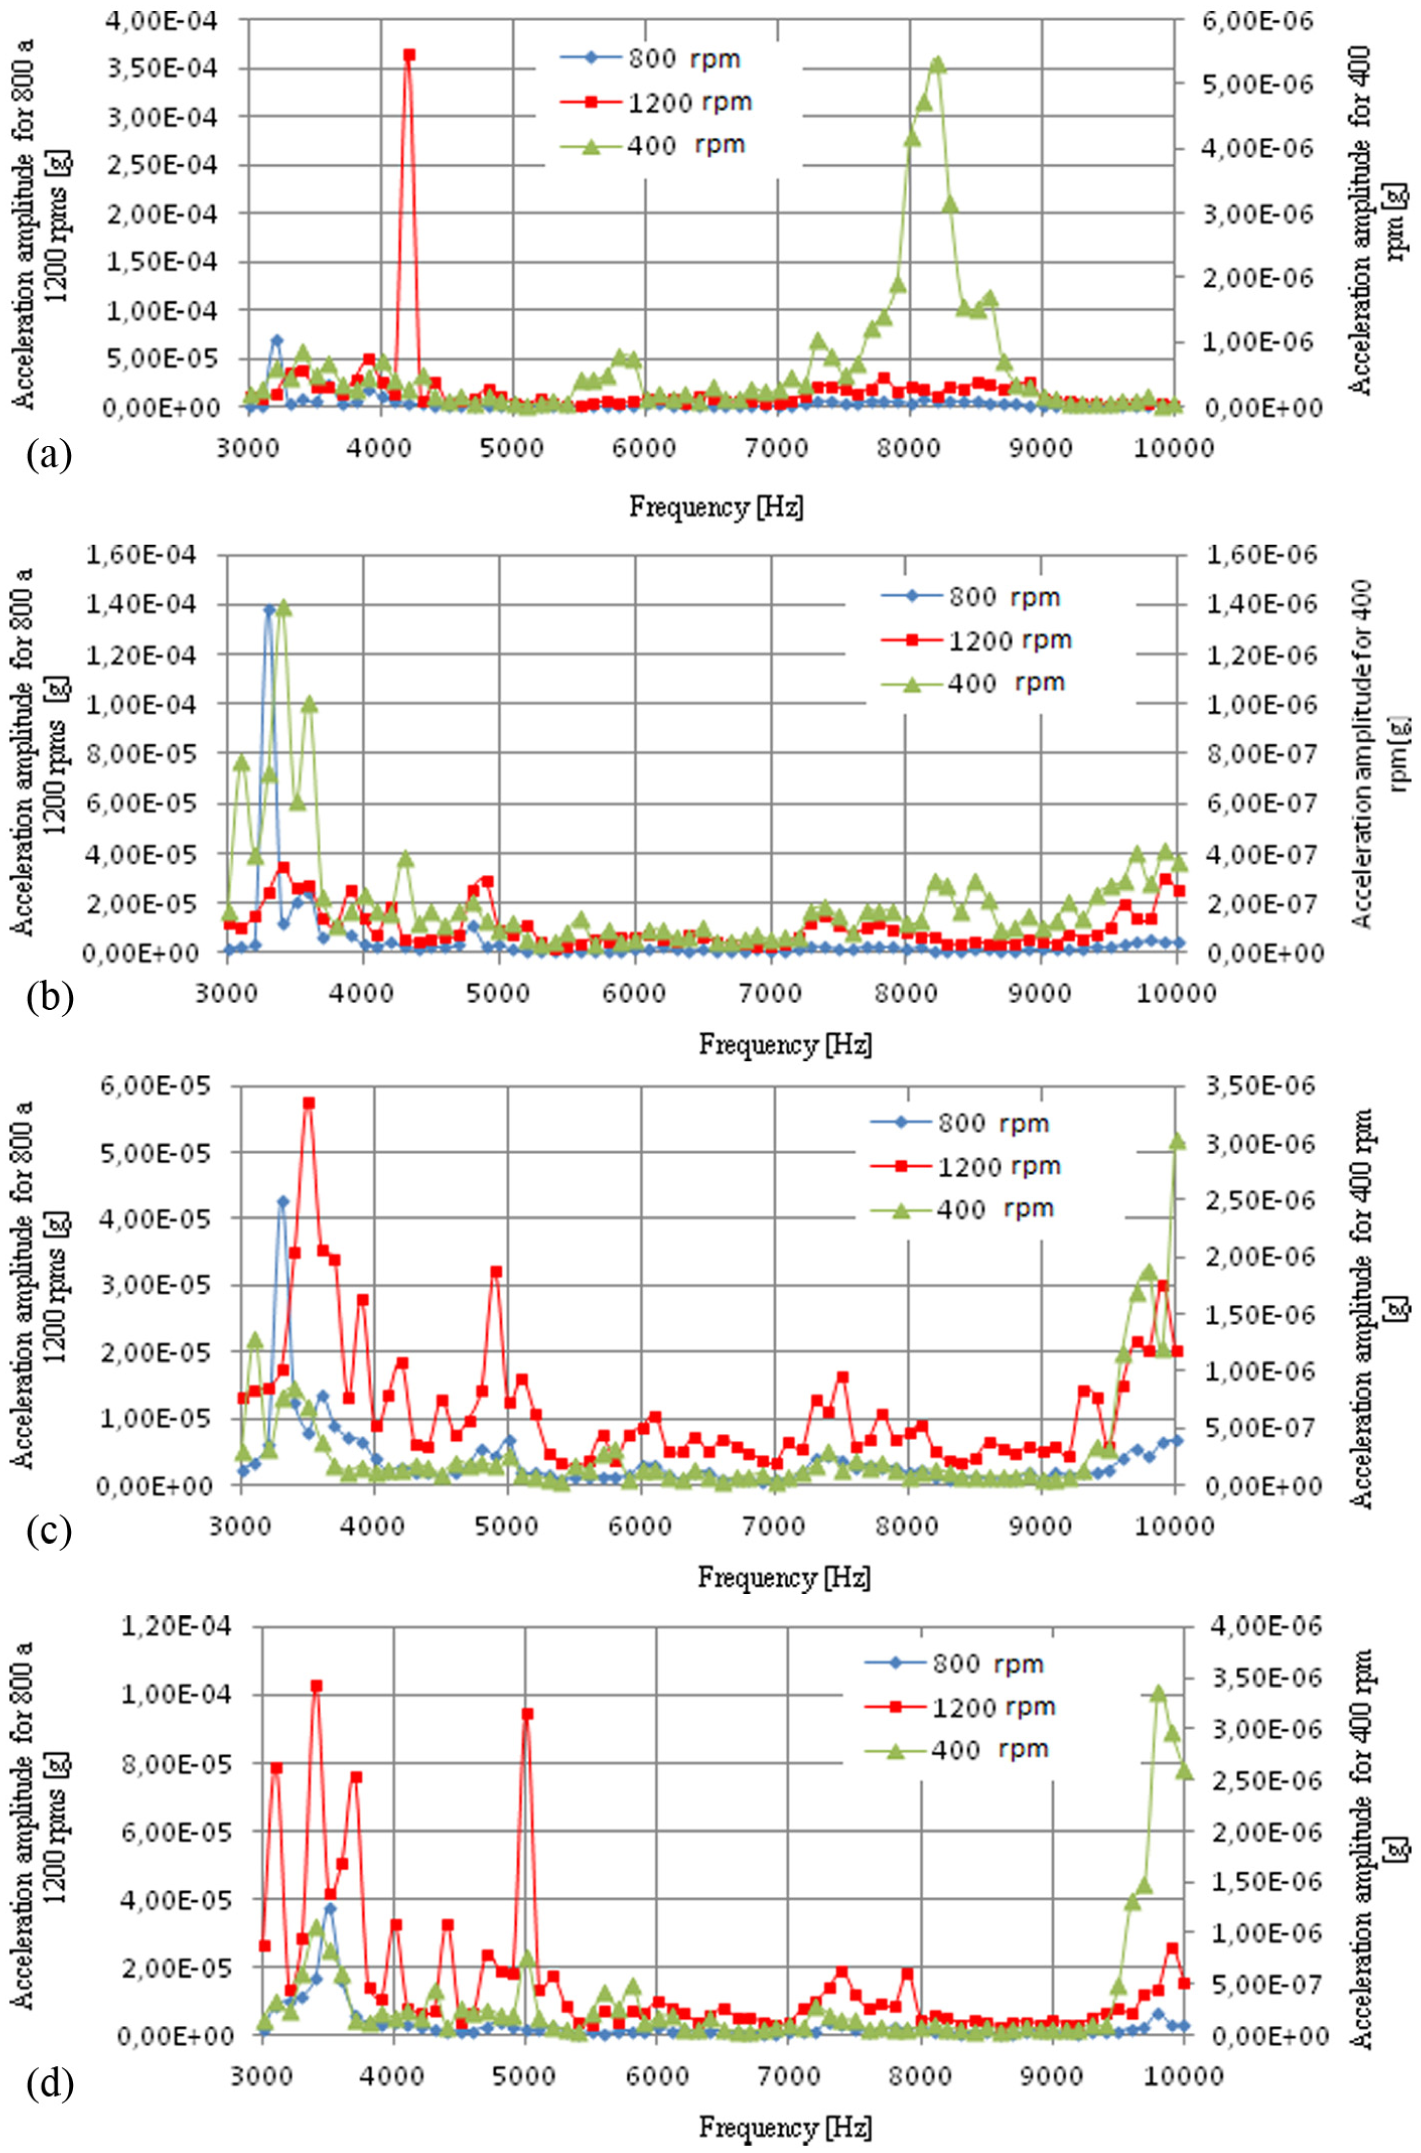
(a) Comparison chart of frequency spectrum covers without load for 400, 800, and 1200 r/min of the motor; (b) comparison graph of frequency spectrum covers at removed thickness 0.5 mm and motor speeds of 400, 800, and 1200 r/min; (c) comparison graph of frequency spectrum covers at removed thickness 1.0 mm and motor speeds of 400, 800, and 1200 r/min; and (d) comparison graph of frequency spectrum covers at removed thickness 2.0 mm and motor speeds of 400, 800, and 1200 r/min.
Under three researched motor speeds of 400, 800, and 1200 r/min without material removal, the increased vibration values of researched range 3.0–10.0 kHz are found in two frequency spectrums, specifically 4.0 through 4.3 kHz and 7.0 through 9.0 kHz (Figure 4(a)). Size of the vibration acceleration amplitude without load in comparison range reaches high value of 3.64.10−4 g at frequency 4.2 kHz and motor speed of 1200 r/min. With the increasing numerical value of motor speed without load, in researched range, the value of vibration acceleration amplitude increases regularly and in comparison for speeds 400 and 1200 r/min, vibration acceleration amplitude value increases as much as 98.53%.
Based on examination of the vibration acceleration amplitude and the corresponding frequencies at researched motor speeds of 400, 800, and 1200 r/min with material removal of 0.5 mm (Figure 4(b)), it can be said that during the processing one frequency range of higher vibrations was found, namely, in the frequency spectrum 3.0–4.0 kHz for the overall researched frequency spectrum 3.0 through 10.0 kHz. Maximum vibration acceleration amplitude value reached 1.38 × 10⁻⁴ g at the frequency 3.3 kHz and motor speed of 800 r/min. With increased numeric value of motor speed at material removal 0.5 mm in researched field, the vibration acceleration amplitude value increases at the beginning and then drops significantly when compared to the motor speeds of 400 and 800 r/min, where the vibration acceleration amplitude value increases as much 99%.
We can see from the vibration acceleration amplitude and the corresponding frequencies for researched motor speeds and thickness of removed material of 1.0 mm (Figure 4(c)) that the more significant values of vibration acceleration amplitude were reached in two areas, namely, in frequency range of 3.0–5.3 kHz and 9.0–10.0 kHz. Size of the vibration acceleration amplitude in the comparison range reaches the maximum value of 5.76 × 10⁻⁵ g at frequency of 3.5 kHz and motor speed of 1200 r/min. With increasing numerical value of motor speed in the researched range, the vibration acceleration amplitude increases constantly and when compared to motor speeds 400 and 1200 r/min, the vibration acceleration amplitude value increases as much as 94.8%.
We can state based on the vibration acceleration amplitude graphical relation and frequency (Figure 4(d)) that for material removal of 2.0 mm and motor speeds of 400, 800, and 1200 r/min, two areas of increased vibrations have occurred (3.0–5.2 and 9.3–10.0 kHz). With the increasing numerical value of motor speed in the researched range, the vibration acceleration amplitude value increases constantly and when compared for motor speeds 400 and 1200 r/min, vibration acceleration amplitude value increases as much as 96.7%.
Chart of maximum vibration acceleration amplitude values is created from the comparison graphs of frequency spectrum covers (Table 2).
Maximum values of the vibration acceleration amplitude.
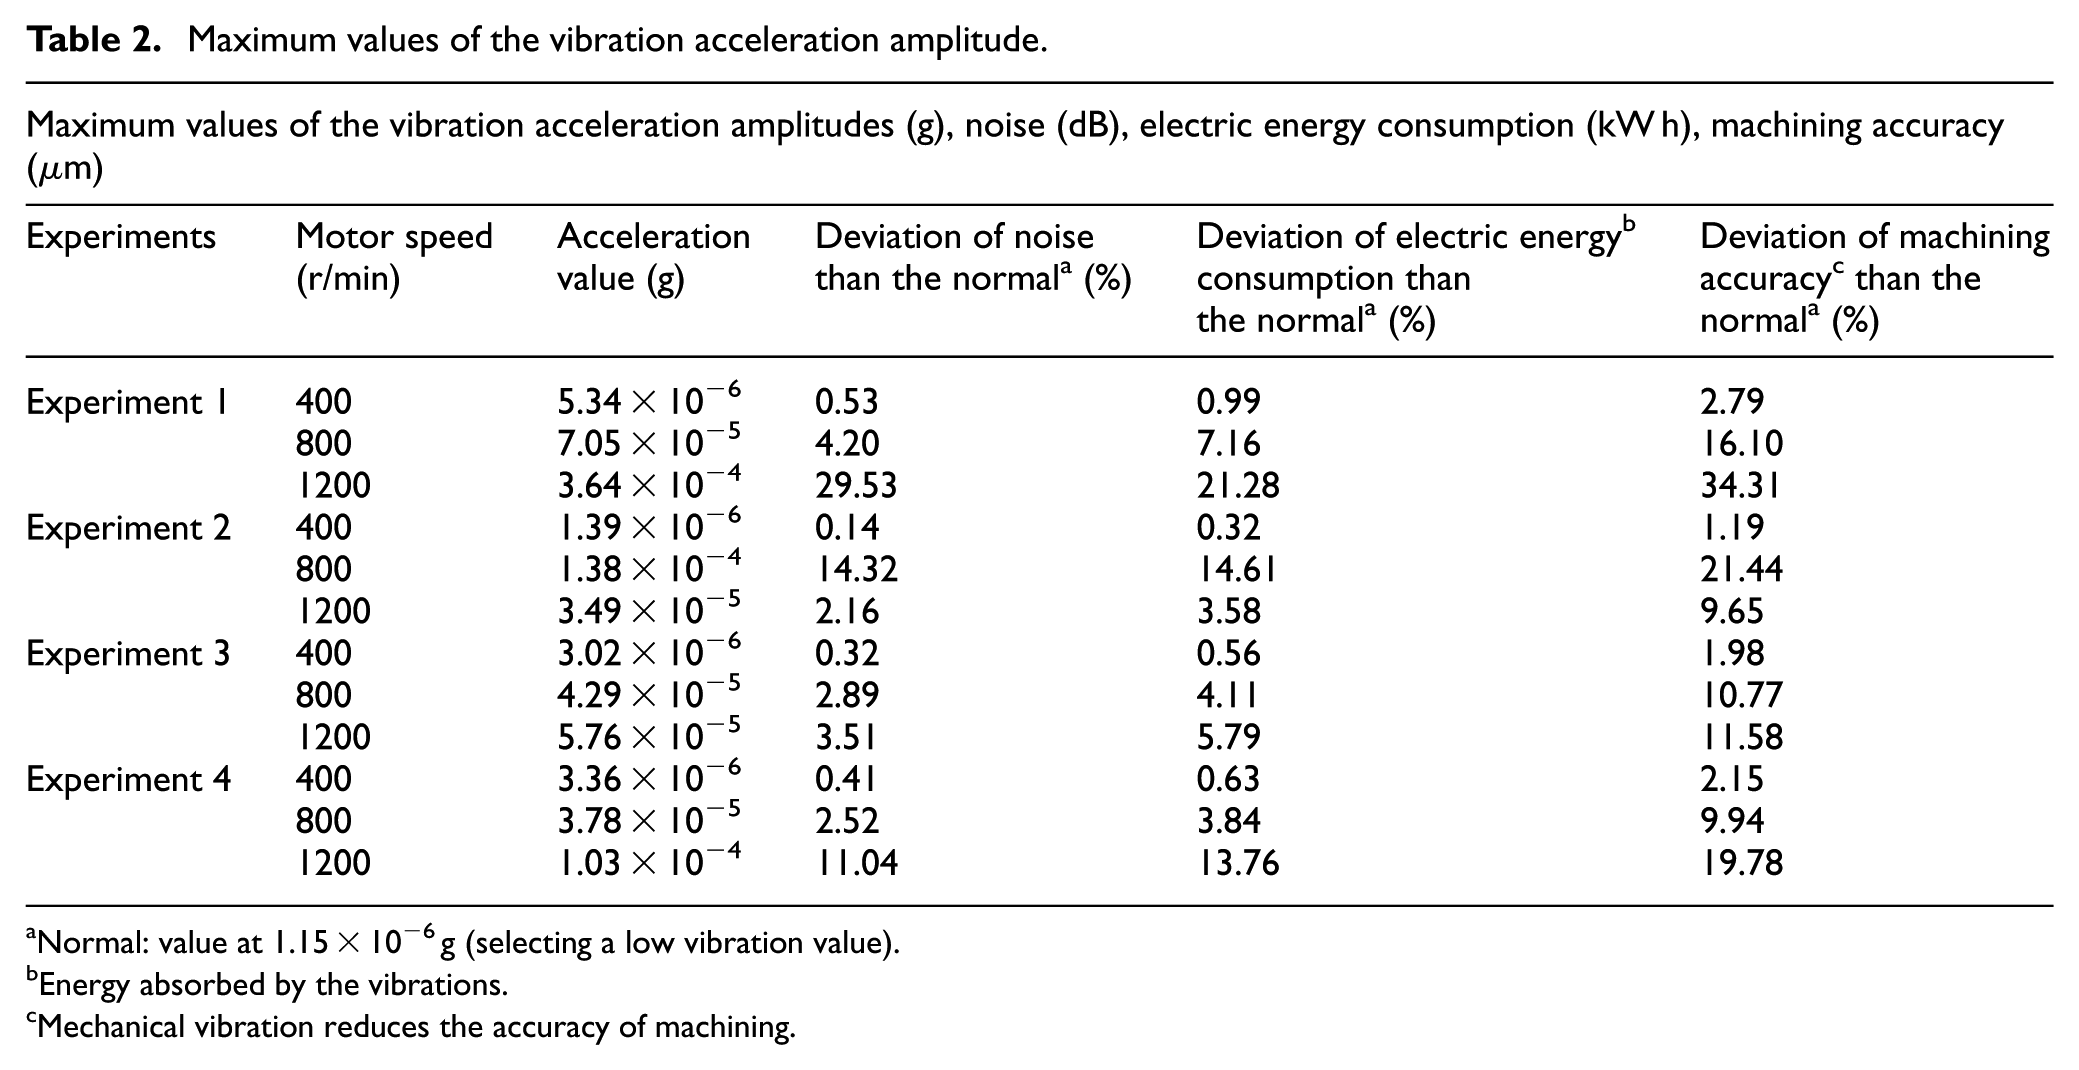
Normal: value at 1.15 × 10⁻⁶ g (selecting a low vibration value).
Energy absorbed by the vibrations.
Mechanical vibration reduces the accuracy of machining.
Criteria for determining the rate of deterioration of the technical condition of the machine were the change in accuracy of machining, resizing removal of electricity, and change in the generated noise levels. These three criteria are directly linked statistically with the deterioration of the technical condition of machines. In the evaluation of those criteria for the relevant vibration levels, it can be concluded that the technical condition is getting worse almost proportionally with increasing magnitude of the vibration.
Experimental results consist also of the evaluation of comparison graphs of frequency spectrum covers in the structure independently of two researched motor speeds and together for the material removal. Comparison graph of vibration acceleration amplitude covers and frequency spectrums of bearing vibrations at motor speed 400 r/min and material removal of 0.5, 1.0 and 2.0 mm is depicted in Figure 5(a). Figure 5(b) depicts the comparison graph at motor speed 800 r/min and Figure 5(c) depicts the comparison graph at motor speed of 1200 r/min.

(a) Comparison graph of frequency spectrum covers without load and material removal of 0.5, 1.0, and 2.0 mm at motor speed of 400 r/min; (b) comparison graph of frequency spectrum covers with material removal 1.0 and 2.0 mm at motor speed of 800 r/min and (c) comparison graph of frequency spectrum covers with material removal 1.0 and 2.0 mm at motor speed of1200 r/min.
We can see from the comparison graph of frequency spectrum covers (Figure 5(a)) for processing of material selected in advance and set motor speed of 400 r/min that the highest vibration resonance values were achieved for processing without load. For processing with material removal, the vibration acceleration amplitude values are approximately the same. At the same time, we can state that with the increasing material removal, the vibration values increase constantly. When compared with material removal of 2.0 mm, it is 2.4 times more (increasing the maximum value of the material removal rate of 2 and 0.5 mm), which represents the value of 58.63 %.
Based on graphical representation (Figure 5(b)), it can be said that for processing at motor speed of 800 r/min, the highest resonance values were reached for processing with material removal of 0.5 mm. With the increasing value of material removal, the vibration acceleration amplitude values drop significantly. The difference between material removal of 0.5 and 2.0 mm represents the value of 72.6% which is 3.6 times less.
Stated comparison graph (Figure 5(c)) indicates that the course of the vibration acceleration amplitude for all measurements is similar in shape. However, we observe a change of resonance vibration values where the highest measured values are observed for processing without a load and material removal of 2.0 mm. The difference between the maximum and minimum value of vibration acceleration amplitude is represented by the value of 94.3%, which is 10 times more.
Based on measured vibration acceleration amplitude values, we can deduce a characteristic of resonance vibrations dependent on motor speeds, which is depicted in Figure 6(a) for processing without load and material removal of 0.5 mm and Figure 6(b) for material removal of 1.0 and 2.0 mm.
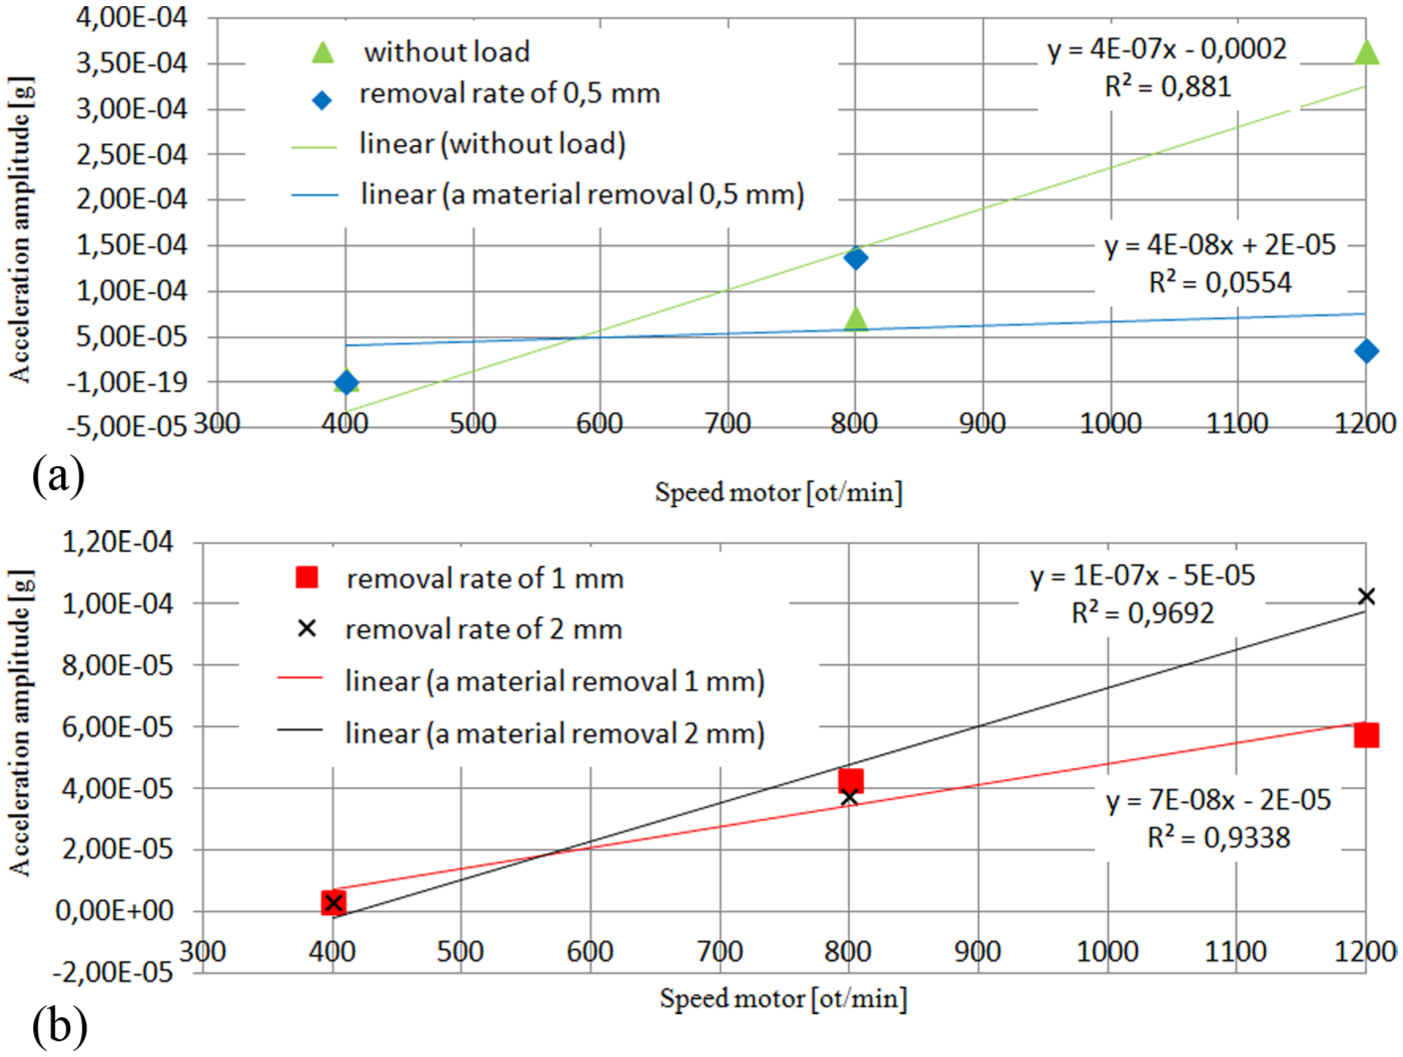
(a) Resonance vibration characteristic based on motor speed for processing without load and material removal of 0.5 mm and (b) resonance vibration characteristic based on motor speed and material removal of 1.0 and 2.0 mm.
Based on this, using correlation and regression analysis, we can determine dependence between motor speeds and vibration resonance values. Units are mutually statistically correlated. Regression analysis is used for the determination of type and constants of functions, which determines the method of smallest squares on the basis of empirically determined data. Linear regression with several unknown parameters is used for evaluation of quantitative relations. We achieve the smallest squares method through the mean values, where the sum of squared distances of originally measured resonance values from the regression line is the smallest possible. Determination coefficient represents the proportion of mutual dispersion, which is what percentage wills the change of one variable affect the other one.
Based on maximum vibration acceleration amplitude values and motor speeds, relations between these two have been discovered. Regression equations have been created and determination coefficients are calculated, which are listed in individual graphic relations (Figure 6(a) and (b)). The determination coefficient is high for processing without material and material removal of 1.0 and 2.0 mm when compared to the value of determination coefficient for material removal of 0.5 mm. The coefficient indicates the reliability value. For example, for processing with material removal of 2.0 mm, 93.38% increase in vibration resonance value is dependent on the increase in lathe motor speed.
Proposal and application of knowledge
Based on performed and evaluated experiments, it is recommended, from the researched set of motor speeds, to use the processing of material selected in advance motor speed of 400 r/min when compared to motor speeds of 800 and 1200 r/min, which reduces wear of the lathe housing and at the same time increases its life span, reduces time of failure downtimes, and increases the economic efficiency of the operation. The measure is a useful contribution to the machining using the setting operating parameters for which the measurement was carried out at the workplace and for a specific type of machine. The effect of using the acquired knowledge is widely used in many general piece production and long-term serial production, where there is no need to change the operating parameters of production.
Conclusion
Objective research focused on monitoring the vibration values arising during operation, which is indicated when using the operating parameters. Based on norm ISO 10816-3, the lathe TOS SV 18RB with 9 kW output belongs to group 4, where individual parts and subgroups of machines integrated into the overall system working in normal operational conditions belong (electric machines up to 15 kW). The focus was fixed on obtaining information on the speed of deterioration of the technical state of the machine in terms of vibrations arising in particular depending on the size of the mechanical vibration. Criteria for determining the rate of deterioration of the technical condition of the machine were the change in precision machining, resizing removal of electricity, and change in the generated noise levels. These three criteria are directly linked statistically with the deterioration of the technical condition of machines. In assessing of the following criteria for the relevant vibration values, it can be concluded that the technical condition deteriorates almost in direct proportion to the increasing size of vibration. Based on the resonance vibration value of the machine, we can state that the long-term processing under given conditions on our lathe does not cause such resonance, which would reduce the life span since the maximum vibration acceleration amplitude value we have recorded was 3.64 × 10⁻⁴ g. Prescribed critical vibration value for this group of machines as per norm stated above has the value of 4.5 mg. With the increasing thickness of material removal, there was a decrease in the amplitude of vibration acceleration. From the perspective of optimizing the process of turning on the lathe TOS SV 18RB, it can be stated that it is necessary to avoid the revolutions of 800 and 1200 r/min during machining without load, considering the value of mechanical vibration. Above-mentioned achievements form a part of experiments, comparing the input parameters and their suitability for use under the conditions of turning.
Footnotes
Academic Editor: José Tenreiro Machado
Compliance with ethics requirements
This article does not contain any studies with human or animal subjects.
Declaration of conflicting interests
The author(s) declared no potential conflicts of interest with respect to the research, authorship, and/or publication of this article.
Funding
The author(s) disclosed receipt of the following financial support for the research, authorship and/or publication of this article: The research work was supported by the Project of the SF of the EU, Operational Programme Research and Development, Measure 2.2 Transfer of knowledge and technology from research and development into practice, project: Research and development of intelligent nonconventional actuators based on artificial muscles. ITMS project code: 26220220103, projects VEGA 1/0409/13 and KEGA 027 TUKE—4/2014, ITMS project code: 26220220125; Operational Programme Research and Development support research activities in Slovakia.