
Abstract
Cavitation is a phenomenon whereby vapor bubbles of a flowing liquid are formed in a local region where the pressure of the liquid is below its vapor pressure. It is well known that cavitation in torque converters occurs frequently when a car with an automatic transmission makes an abrupt start. Cavitation is closely related to a performance drop and noise generation at a specific operating condition in a car and a torque converter itself. This study addressed the relation between cavitation and performance in an automotive torque converter in a quantitative and qualitative manner using numerical simulations. The cavitation was calculated at various operating conditions using a commercial flow solver with the homogeneous cavitation model, and the torque converter performance was compared with the experimental data. Numerical results well match to the data and indicate that the cavitation causes significant performance drop, as the pump speed increases or both speed ratio and reference pressure decrease.
Introduction
A torque converter is a fluid coupling device used for transferring rotating power from an engine to an automatic transmission. A torque converter is usually composed of three parts: pump driven by the engine, turbine driving the transmission, and stator mounted on an overrunning clutch positioned between the pump and turbine. An internal fluid circulating through the three components can vaporize locally to form bubbles at a specific operating condition where the static pressure goes below its vapor pressure. Although the operating condition stays the same for a while, cavitation bubbles extend to a considerable part of a flow passage, causing significant performance reduction, severe noise, and vibration in a car and a torque converter itself. Because these results from the cavitation have a negative effect on fuel efficiency and driving comfort, many researchers are investigating the cavitation in a torque converter and trying to find an effective method for suppressing it.
Most of the studies have been focused on predicting the occurrence of cavitation at stall by experimental methods. Anderson et al. 1 measured the static pressure on the pump blade to predict the initiation of cavitation. Mekkes et al. 2 defined a fluctuating cavitation number based on the static pressure on the suction side of the stator blades to predict the onset of cavitation. Kowalski et al.3,4 used nearfield acoustical measurements with a high pass filter for detecting the cavitation and suggested a correlation based on their experimental results to predict the cavitation. Robinette et al.5–7 performed a series of experiments for several torque converters with different sizes and different shapes and then suggested a cavitation prediction model applicable to every torque converter. Based on the experimental data of various geometries of torque converters, in particular, Walber et al. 8 developed a method to determine the speed ratio (SR) of cavitation desinence. As stated above, the experiments for the cavitation in torque converters can provide useful information about the existence of cavitation bubbles based on the measured noise levels, vibrations, and torques of each component. However, it is difficult to construct the shape and size of the cavitation bubbles and to point out their exact locations.
In computational researches, Dong et al. 9 found from their numerical results that the cavitation on the leading edge of the stator grows in size with the increasing pump speed, resulting in large performance drop in a torque converter. Numerical methods have also been used for researchers to advance their understanding of complex three-dimensional (3D) flow features such as secondary flow 10 and for designers to analyze the performance of a torque converter and to design its efficient components. 11 Watanabe et al. 12 predicted cavitation behaviors in an automotive torque converter at the stall condition with numerical simulations and analyzed the relationship between cavitation and vibration. They found that the mechanical vibrations increase with the development of cavitation but decrease with excessive development of cavitation thereafter.
Numerical simulation for cavitation in torque converters is still a developing field, although flow simulation has been routinely performed to understand a complex flow in a torque converter. Moreover, most of the numerical studies have been focusing on the prediction of cavitation at the stall condition only. It is necessary to test numerical methods including cavitation models in various operating conditions of torque converters for their validation. This article covers extensive numerical simulations for various operating conditions with different pump speeds and SRs between the pump and the turbine, comparisons of numerical results with experimental data, and analysis about the effects of cavitation on the performance in an automotive torque converter.
Numerical model
Computational domain and mesh
The numerical results in this work were for geometry of an automotive torque converter, which is mainly mounted on current sedans with an automatic transmission. All geometrical factors are typical of a modern automotive torque converter. The computational domain is assumed to be a closed system consisting of a pump, stator, and turbine, which is slightly different from the experimental test facility. In the test facility, there exists a leakage of automatic transmission fluid (ATF) between the three components enclosed in the front cover. Computational meshes for the three components were generated by a commercial mesh generator, ANSYS ICEM-CFD, as shown in Figure 1. Hexahedral structured mesh is used for the pump and turbine, and hexahedral unstructured mesh is adopted for the stator due to its complex shape. A single passage of each component has about 200,000 nodes, and the whole computational domain has about 600,000 nodes.

Computational mesh for each component: (a) pump, (b) turbine, and (c) stator.
Computational method
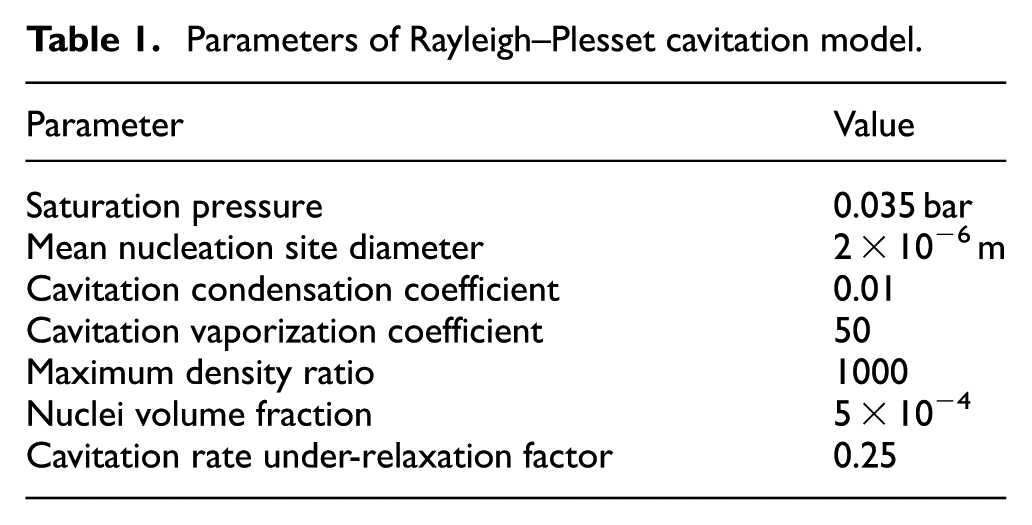
A commercial flow solver, ANSYS CFX 14.5, has been used for the numerical simulations of the internal flow in a torque converter. This flow solver has already been validated with different torque converters by Schweitzer and Gandham 11 and Lee et al. 13 The convection terms in the 3D compressible Navier–Stokes equations were discretized by a high-resolution scheme, which is a blend of a first-order upwind difference scheme and a second-order central difference scheme. The spatial derivatives of the diffusion terms were calculated by shape functions formulated by the finite element method. A first-order backward Euler time stepping was applied for obtaining steady solutions. Each numerical solution was considered to be converged to a steady solution when the residuals in mass, momentum, and turbulence variables were <10−4. The k–ω shear stress transport (SST) model has been used to obtain turbulent viscosity because the internal flow has complex 3D characteristics. For implementing cavitation numerically, the homogeneous multiphase model without any free surface model is applied to this study because the vapor velocity is assumed to be the same as the liquid velocity. The mass transfer between the vapor and the liquid is calculated based on the Rayleigh–Plesset cavitation model. The saturation pressure, provided by the ATF maker, is set to be 0.035 bar, while all the other empirical parameters of the cavitation model are the default values of ANSYS CFX 14.5 as listed in Table 1. The advantage of this model is its ability to simulate cavitation and phase change correctly. The detailed description for the numerical methods and the cavitation model can be found in ANSYS CFX 14.5 manuals. 14
Parameters of Rayleigh–Plesset cavitation model.
In the simulation of a torque converter, there are no inlet and outlet conditions because it is assumed to be a closed system. The no-slip condition has been used on the wall surfaces, and the periodic condition has been employed because only one flow passage is used in each component. On the interface between moving and stationary parts, the mixing plane was employed for steady simulations with and without the cavitation model.
Operating conditions
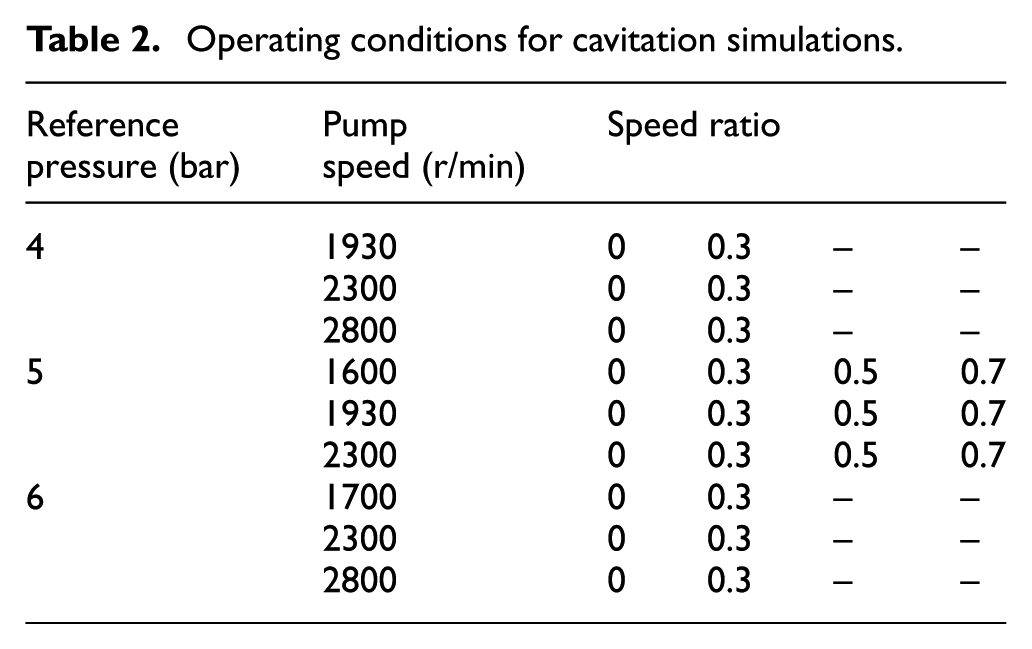
In the simulations for cavitation, it is important to set a proper reference pressure because the evaporation of a working liquid is inversely proportional to the reference pressure. In the experimental facility, it is very difficult to measure the static pressure inside the pump, stator, and turbine due to their rotation. The torque converter was pressurized by a transmission pump, and the charge pressure was measured at the inlet, which was applied as the reference pressure in the simulations. Only torque of the pump and turbine was measured from the test facility, as it was difficult to determine whether the cavitation occurred inside the torque converter or not.
In this study, a total of 24 operating conditions were simulated for capturing cavitation in the torque converter with different reference pressures, pump speeds, and SRs between the pump and the turbine. The detailed conditions for the simulations are summarized in Table 2.
Operating conditions for cavitation simulations.
Computational results
Grid independence test and validation
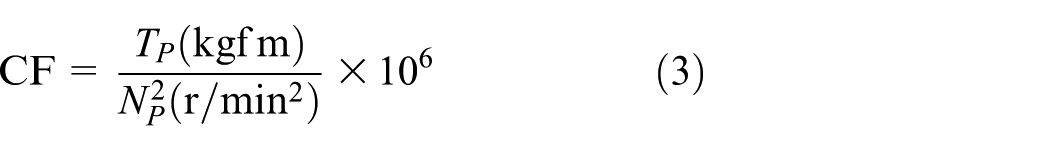
The performance of a torque converter is defined by the rotational speeds and torques of the pump and the turbine. SR and torque ratio (TR) are the ratio of the turbine relative to the pump in speed and torque as defined in equations (1) and (2). Especially, in case of SR = 0, the operating condition is called “stall.” In an automobile, this condition occurs when the transmission is in gear, but the vehicle cannot move due to the brake. C-factor (CF; torque capacity) is directly proportional to the pump torque but inversely proportional to the square of the pump rotational speed as defined in equation (3)


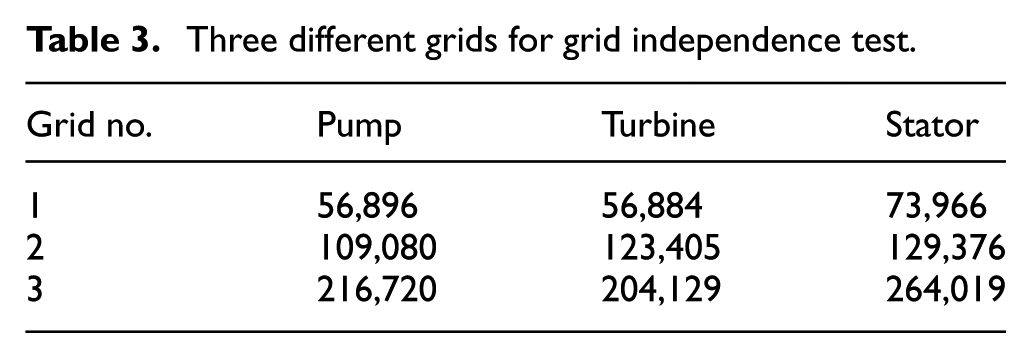
Prior to validation of numerical results, a grid independence test has been performed for three grids with different resolutions as listed in Table 3. The reference pressure, pump rotational speed, and SR are 5 bar, 1930 r/min, and 0.3, respectively. TR and CF of each grid have been compared with one another, and the comparison result is shown in Figure 2. The differences in TR and CF between grids 2 and 3 are <0.34% and 0.43%, respectively; hence, grid 3 was selected for further analysis.
Three different grids for grid independence test.

Grid independence test at pref = 5 bar, NP = 1930 r/min, and SR = 0.3.
The computational results with and without the cavitation model were compared with the experimental measurements for validation. For a fixed reference static pressure of 5 bar, variations of TR and CF along the SR were calculated in three different pump speeds, and the results are shown in Figure 3. In the experimental data, CF increases steadily, makes its maximum at SR = 0.6, and decreases rapidly thereafter. Theoretically, the torque converter can produce its maximum torque at stall if the input power is sufficiently applied. In all the three cases, however, the maximum torque was obtained around SR = 0.6, implying that there is a large loss in transferring power at stall. By the way, TR approaches to 1 as SR increases. In all the computational cases, TR is well matched to the experimental values regardless of the existence of the cavitation model. However, CF is significantly affected by the existence of the cavitation model. Without the cavitation model, the computations considerably overpredict CF in comparison with the experiments when SR is <0.5. Above 0.5 of SR, the computations predict CF correctly because cavitation disappears in the flow field for higher SR. With the cavitation model, CFs agree well with the experimental measurements over all pump speeds in comparison with the CFs without the cavitation model. There are two important things to point out. First, a cavitation model is essential in the flow simulation in order to predict CF correctly because cavitation causes a large loss in power transfer from the pump to the turbine when SR has low values. Second, it is worth noting that the efficiency of power transfer could be greatly increased if the cavitation is controlled and suppressed with a proper operating condition or a good blade shape.

Torque ratio and C-factor for different pump speeds: (a) pref = 5 bar, NP = 1600 r/min; (b) pref = 5 bar, NP = 1930 r/min; and (c) pref = 5 bar, NP = 2300 r/min.
As shown in Figure 3(a) and (b), however, there are still some differences even if the cavitation model is employed. This difference can be caused by three factors. First, the computational domain has been assumed to be a closed system so that the simulations cannot consider the leakage between the three components. The amount of the leakage might be changed depending on the speeds of the pump and turbine. Second, the reference pressure measured indirectly at the inlet in the experiment might not be the same as the static pressure inside the torus of the torque converter due to the pressure loss. Third, default values for the parameters of the cavitation model might not be the optimal values for ATF because the parameters have generally been determined based on water experiments.
Flow analysis
Figure 4 shows the extent of cavitation with different SRs at the same reference pressure and pump speed. At pref = 5 bar and NP = 1930 r/min, the cavitation occurs only on the stator surface and not on the pump and the turbine surfaces. At stall, the cavitation appears from the mid-span to the shell at the leading edge of the stator. As SR increases, the cavitation shrinks in the spanwise direction and finally disappears on the stator surface when SR is >0.5, as shown in Figure 4(b) and (c). In consideration with Figure 3(b), CF increases from stall to SR = 0.5 because the size of the cavitation bubbles decreases.

Cavitation on stator surface with different speed ratios (pref = 5 bar and NP = 1930 r/min): (a) stall, (b) SR = 0.3, and (c) SR = 0.5.
Figure 5 shows velocity fields at the mid-span of the stator with different SRs. The computational condition is the same as the case in Figure 4. The incidence angle has its maximum value at stall due to the motionless turbine, causing a large separation on the suction surface from the leading to the trailing edges. As SR increases, the incidence angle decreases, and the small incidence delays the onset of the separation to a further downstream position. In particular, at SR = 0.3, the flow is separating behind the leading edge. At SR = 0.5, the flow is almost attached on the suction surface, but a small separation region still exists near the trailing edge. When SR is >0.5, no separation exists on the stator surface. In comparison with Figure 4, the separation on the leading edge of the stator is closely related to the onset of cavitation. The flow accelerates around the leading edge, and the local static pressure drops significantly, while the static pressure recovers near the trailing edge on the suction surface. Therefore, the static pressure near the leading edge has its minimum value in the torque converter. When the flow is separating due to a large incidence angle, the local pressure decreases further, and the possibility of cavitation increases significantly. When the local static pressure is below the vapor pressure of ATF, cavitation initiates. This is why the cavitation occurs easily on the leading edge rather than on the trailing edge of the stator.

Velocity vector at stator mid-span (pref = 5 bar and NP = 1930 r/min): (a) stall, (b) SR = 0.3, (c) SR = 0.5, and (d) SR = 0.7.
In order to analyze a relationship between cavitation and separation on the leading edge, velocity fields along the span are shown in Figure 6. At the same operating condition as in Figure 4(b), a large separation occurs on the suction surface of the stator near the shell (span = 0.9) due to the large incidence angle, which is caused by the slow turbine motion at SR = 0.3. At the mid-span (span = 0.5), the incidence angle becomes smaller, and the separation also decreases in size. In particular, the flow around the leading edge of the stator is attached on the suction surface due to the decreased incidence, and the separation starts behind the leading edge. Near the core (span = 0.1), the flow is completely attached on the stator surface, and there is no separation. Based on this result, it is evident that the extent of cavitation is closely related to the separation on the leading edge of the stator. The possibility of cavitation increases significantly whenever the separation occurs and causes low-pressure region around the leading edge.

Velocity fields at different spans of the stator (pref = 5 bar, NP = 1930 r/min, and SR = 0.3): (a) span = 0.9, (b) span = 0.5, (c) span = 0.1, and (d) three planes.
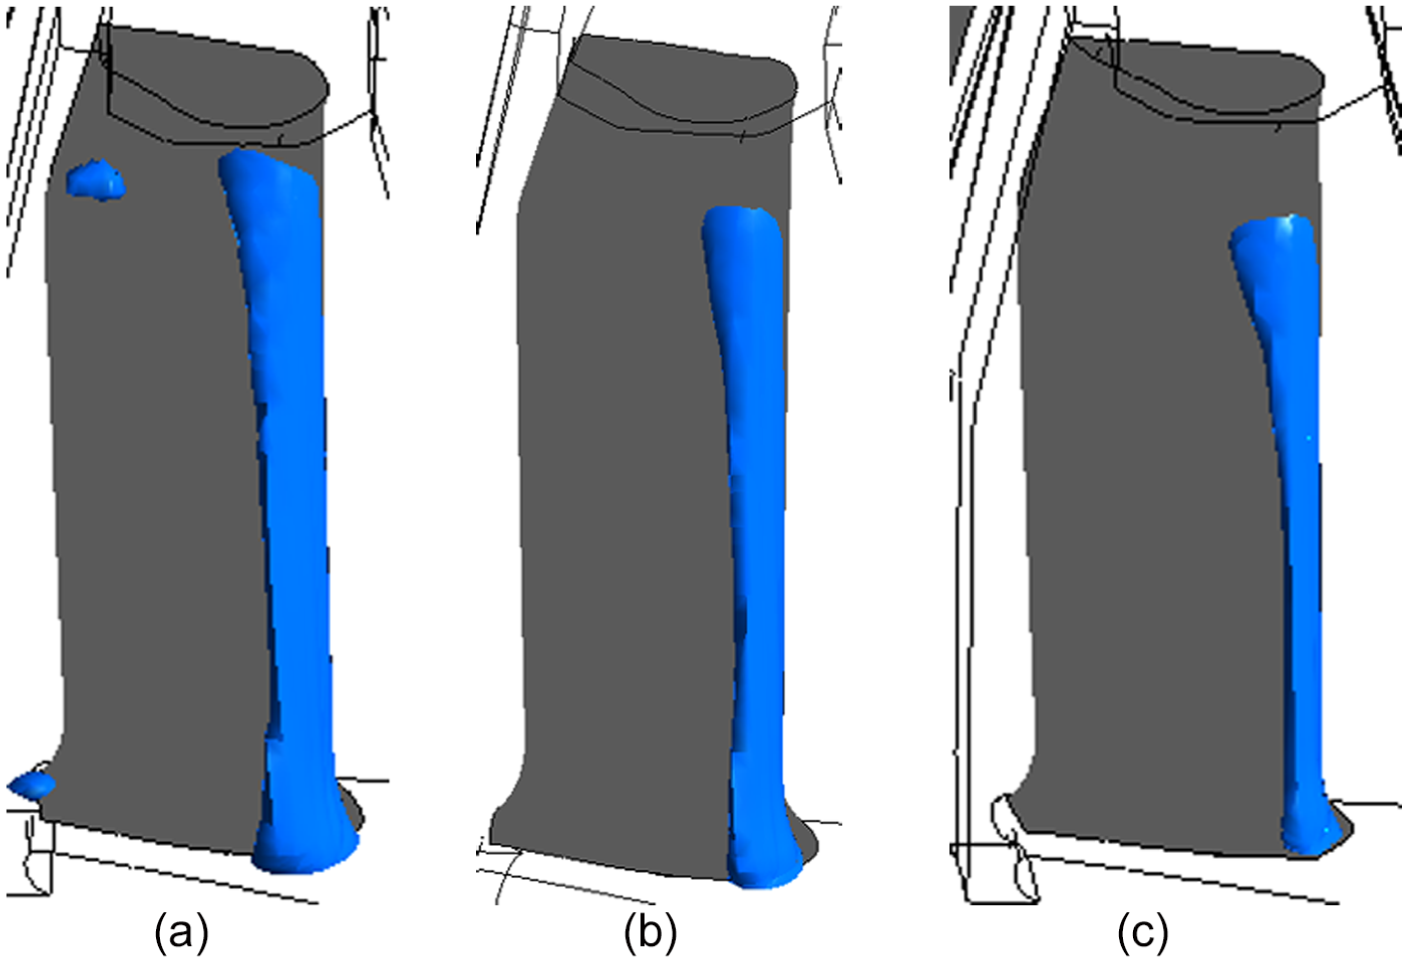
Figure 7 shows the extent of cavitation at stall condition with different pump speeds. At NP = 1600 r/min, thin cavitation covers the stator surface from the mid-span to the shell, blocking the internal flow passage and dropping CF. When NP reaches 1930 r/min, the cavitation expands forward the core, and its thickness becomes larger, making the blockage increase further. At 2300 r/min, the whole leading edge of the stator is covered with the thicker cavitation. In addition, another cavitation is observed at the pump inlet and the turbine inlet, even though its size is very small. As a result, CF decreases as the pump speed increases, as shown in Figure 8 except for point A. The CF variation along the pump speed at stall is well matched to the result of Dong et al. 9 These results show that the abrupt start of a car with a high engine speed can cause large cavitation in the torque converter and also can make its fuel efficiency worse.

Distribution of cavitation at different pump speeds (pref = 5 bar and stall): (a) NP = 1600 r/min, (b) NP = 1930 r/min, and (c) NP = 2300 r/min.

C-factor distribution along the pump speeds at stall.
A torque converter is generally sealed up with a high reference pressure to prevent the cavitation. To analyze the effect of the reference pressure on cavitation, the computation was conducted with different pressures as shown in Figure 9. At pref = 4 bar, cavitation covers all span at the leading edge of the stator, and it also appears near the shell and core at the trailing edge. As the reference pressure increases to 5 bar, the cavitation at the leading edge shrinks a little in the spanwise direction, and the cavitation at the trailing edge disappears. When the reference pressure increases further to 6 bar, the cavitation still exists on the stator surface, although its size becomes smaller. As a result, the CF increases with the increasing reference pressure as shown in Figure 10. However, this result shows that the high reference pressure is not a perfect method to suppress the cavitation, even though it relieves cavitation phenomena in the torque converter and reduces their negative effects on the performance.
Distribution of cavitation at different reference pressures (NP = 2300 r/min and stall): (a) pref = 4 bar, (b) pref = 5 bar, and (c) pref = 6 bar.

C-factor distribution along the reference pressures at stall and NP = 2300 r/min.
Conclusion
Using an advanced numerical model, cavitation in a torque converter was investigated in detail for different operating conditions. The following conclusions can be made from an inspection of the numerical results.
The computed results with a cavitation model agreed well with the experimental data in the CF and the TR between the pump and the turbine. However, the computation without the cavitation model overpredicted CF significantly in case of SR < 0.5. Therefore, the cavitation model is essential in the flow simulation of a torque converter to predict its performance accurately.
In all pump speeds, the cavitation occurs at the range of 0–0.5 of SR. Due to the slow turbine, the incidence angle at the leading edge of the stator increases significantly, inducing a large separation around the leading edge and finally causing the cavitation. It should be noted that the leading edge of the stator near the shell is the most susceptible part to cavitation in a torque converter.
At stall condition, the cavitation region expands at the leading edge of the stator in the spanwise direction as the pump speed increases, causing CF to drop significantly. This implies that the abrupt start of a car could reduce fuel efficiency considerably.
To prevent the onset of cavitation, a torque converter is sealed up with a high reference pressure. The high reference static pressure considered here is helpful to decrease the cavitation in size and to increase CF at stall, but it is insufficient to remove cavitation completely.
This result suggests that some different techniques are required to suppress the cavitation in a torque converter. Based on this work, a study is being carried out to find the optimized shape of the stator with high resistance against cavitation.
Footnotes
Appendix 1
Academic Editor: Yuning Zhang
Declaration of conflicting interests
The author(s) declared no potential conflicts of interest with respect to the research, authorship, and/or publication of this article.
Funding
The author(s) received no financial support for the research, authorship, and/or publication of this article.