
Abstract
Various physiological parameters have been widely used in the prevention and detection of diseases. In particular, the occurrence of cardiovascular diseases can be observed through daily measurement of blood pressure. Currently, the most common blood pressure measurement method records blood pressure on the upper arm. This can lead to the subject feeling uncomfortable and tension in the arm from the stress may lead to measurement errors. An electrocardiogram represents the electrical activity during heart function, but also contains blood pressure–related information. This study is an attempt to extract features related to blood pressure from the electrocardiogram signal using a new non-invasive blood pressure measurement technology that utilizes intelligent neural network algorithms to calculate blood pressure values from electrocardiogram parameters. In this study, the average error rate of the blood pressure measurement was lower than 5% compared to the common blood pressure machine. The proposed approach alleviates the errors caused by discomfort, which provides a more feasible method to continuously monitor blood pressure in less stressful conditions. This technology has significant potential for advancing healthcare.
Introduction
Various physiological parameters have been widely used in the prevention and detection of diseases. In particular, it is possible to observe the occurrence of cardiovascular diseases through daily blood pressure (BP) measurements. Currently, the most common BP measurement method records pressure in the upper arm. The subject might feel uncomfortable and the tension due to the pressure on the arm may lead to BP measurement errors. Previous research used a photoplethysmogram (PPG) and machine learning techniques to simultaneously and non-invasively estimate blood glucose level (BGL) and systolic blood pressure (SBP) and diastolic blood pressure (DBP). 1 Time–frequency (T–F) analysis is often used to study non-stationary cardiovascular oscillations, such as heart rate (HR) and variable BP in dynamic situations. One study previously used the T–F recursive autoregressive technique to investigate variability in pulse transit time (PTT), which is a cardiovascular parameter of emerging interest due to its potential to estimate BP non-invasively, continuously, and without a cuff. Recent studies suggest that PTT is not only related to SBP but also to HR. 2 An electrocardiogram (ECG) represents the electrical activity of heart function and also contains PPG- and BP-related information. The higher fidelity and more consistent ECG signal assists in identifying true cardiac pulses in an oscillometric signal that may be contaminated with noise and artifacts, thus lending greater confidence to the oscillometric BP estimation. 3 For example, the use of an ECG signal was proposed for reconstructing an oscillometric signal contaminated with artifacts to more accurately assess BP. 4 Similarly, synchronized ECG signals were employed for removing motion artifacts from oscillometric signals to increase the accuracy of BP measurements. 5 The doctor can assess cardiovascular disease patients using parameters of the ECG signal, such as HR and heart rate variability (HRV), to avoid incidents of acute myocardial infarction or myocardial ischemia. Several methods for the estimation of BP based on the PPG signal have been proposed. They can be categorized into pure PPG-based methods6,7 or hybrid PPG- and ECG-based methods.8–11
In this study, we propose the use of a physiological signal to resolve a variety of physiological parameters to simplify the measurement process and time. This study extracts the features related to BP from the ECG signal and develops a new non-invasive BP measurement technology that utilizes intelligent neural network algorithms to estimate BP values from ECG parameters.
Methods and implementation
Design of the bio-signal measurement device
For this study, we created a bio-signal measurement device (Figure 1) that can measure the PPG and ECG simultaneously with a sampling rate of 100 Hz and synchronously saving the raw data to a personal computer (PC).
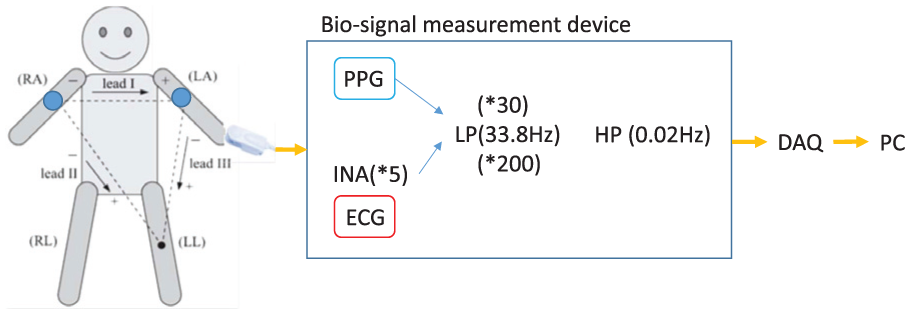
The bio-signal measurement device.
Online peak detection of PPG and ECG
So and Chan’s 12 algorithm was used to find the locations of QRS complexes in ECG sequences and the peaks and valleys in PPG sequences. The fuzzy threshold algorithm adjusted the slope threshold in real time (Figure 2(a)). When the QRS complexes were detected in ECG sequences, we could detect the other peaks (P, Q, S, and T) of the ECG through time characteristics (Figure 3) between each wave and the R wave in ECG sequences. The peak finding of PPG was the same. The fuzzy peak detection algorithm is described below.
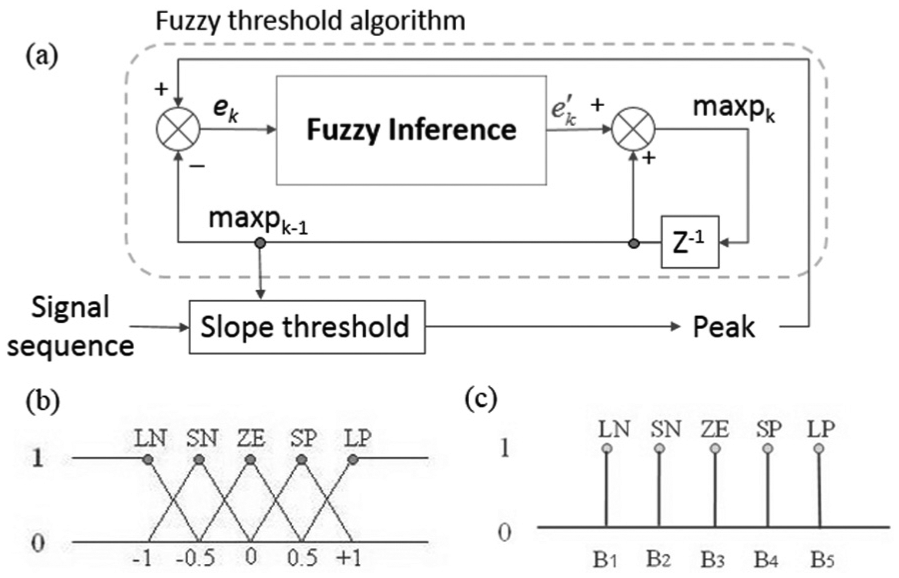
Fuzzy threshold algorithm: (a) the structure of the fuzzy threshold algorithm, (b) the membership function of the fuzzifier, and (c) the membership function of the defuzzifier.

The wave segment parametric of a normal ECG.
Let X(k) represent the amplitude of the ECG data at discrete time k. The slope of the ECG wave can be obtained by equation (1)


The initial maxp is the maximum slope within the first 200 data points in the ECG file.
When two consecutive ECG data satisfy the condition that slope(k) is large than slope_threshold which is defined as equation (2), the onset of the QRS complex is detected. After the detection of the onset of the QRS complex, the maximum point (maxp) is searched and is taken as the R point. The maxp is then updated by the fuzzy threshold algorithm which is defined as equations (3) and (4)


In the fuzzy threshold algorithm, the prediction error ek is an input to the fuzzy algorithm created by the difference between peak and maxpk−1 that can be represented as equation (5)

In the fuzzy algorithm, a linguistic fuzzy inference rule is utilized to calculate the modified error
Fuzzy inference rule table.
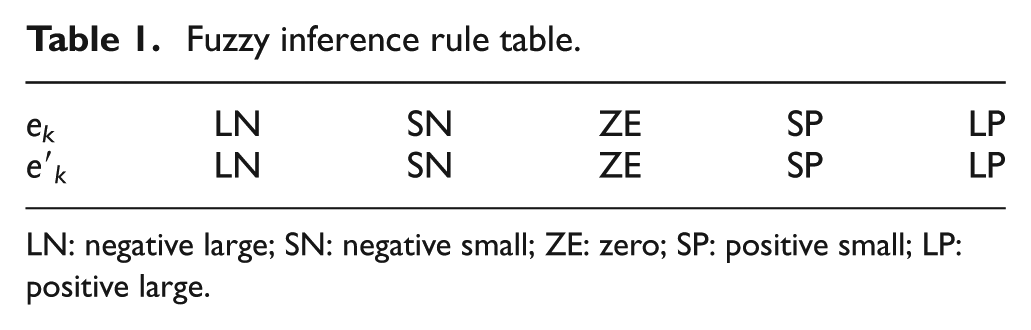
LN: negative large; SN: negative small; ZE: zero; SP: positive small; LP: positive large.
The output variable

Analysis of the relationship between PPG and ECG
In order to transform the signal of the ECG into a value for BP, we need to calculate the correlation of every wave segment (Figure 4) with the arterial systolic and arterial diastolic to find the transformation parameters. In Figure 4, “TR” indicates the period between the T wave and the next cycle of the R wave, the same as TQ and TP. “ST” indicates the period between the S wave and the T wave in the same cycle, the same as RT and QT. “SB” indicates the period of systole and “DB” indicates the period of diastole. “ET” represents the ECG cycle, that is, the period of the R-R interval and “BT” indicates the PPG cycle.

The relationship between ECG and PPG.
Non-invasive BP measurement technology
In this study, we developed an intelligent neural network algorithm (Figure 5) that transforms ECG signals into BP values. The algorithm uses the strongly correlated between ECG and PPG as input to the neural network and, through a large number of learning trials, enhances the correct of output. The neural network algorithm includes a multilayer perceptron (MLP) and error back propagation (EBP).

The intelligent neural network structure.
In the MLP processing, we set the learning rate η (1) and a tolerable error (0.001), the input nodes of input layer are ij where j is from 1 to n, and n is the number of the high correlation coefficient (>0.7). The whi is the ith weight value of the hidden layer, the woh is the hth weight value of the output layer, and these initial weight values are random. The activity function (f) uses the log-sigmoid transfer function that is defined as equation (7), the yo1 and yo2 are the estimation values of SBP and DBP, respectively

The EBP is processing between two layers, the output of the n layer and jth neuron


Analysis of graphical user interface
This study used MATLAB’s graphical user interface (GUI) to establish an analysis platform for the ECG signal (Figure 6). The functions of this platform will show the detection of each peak, ECG rhythm analysis, and estimated value of BP.
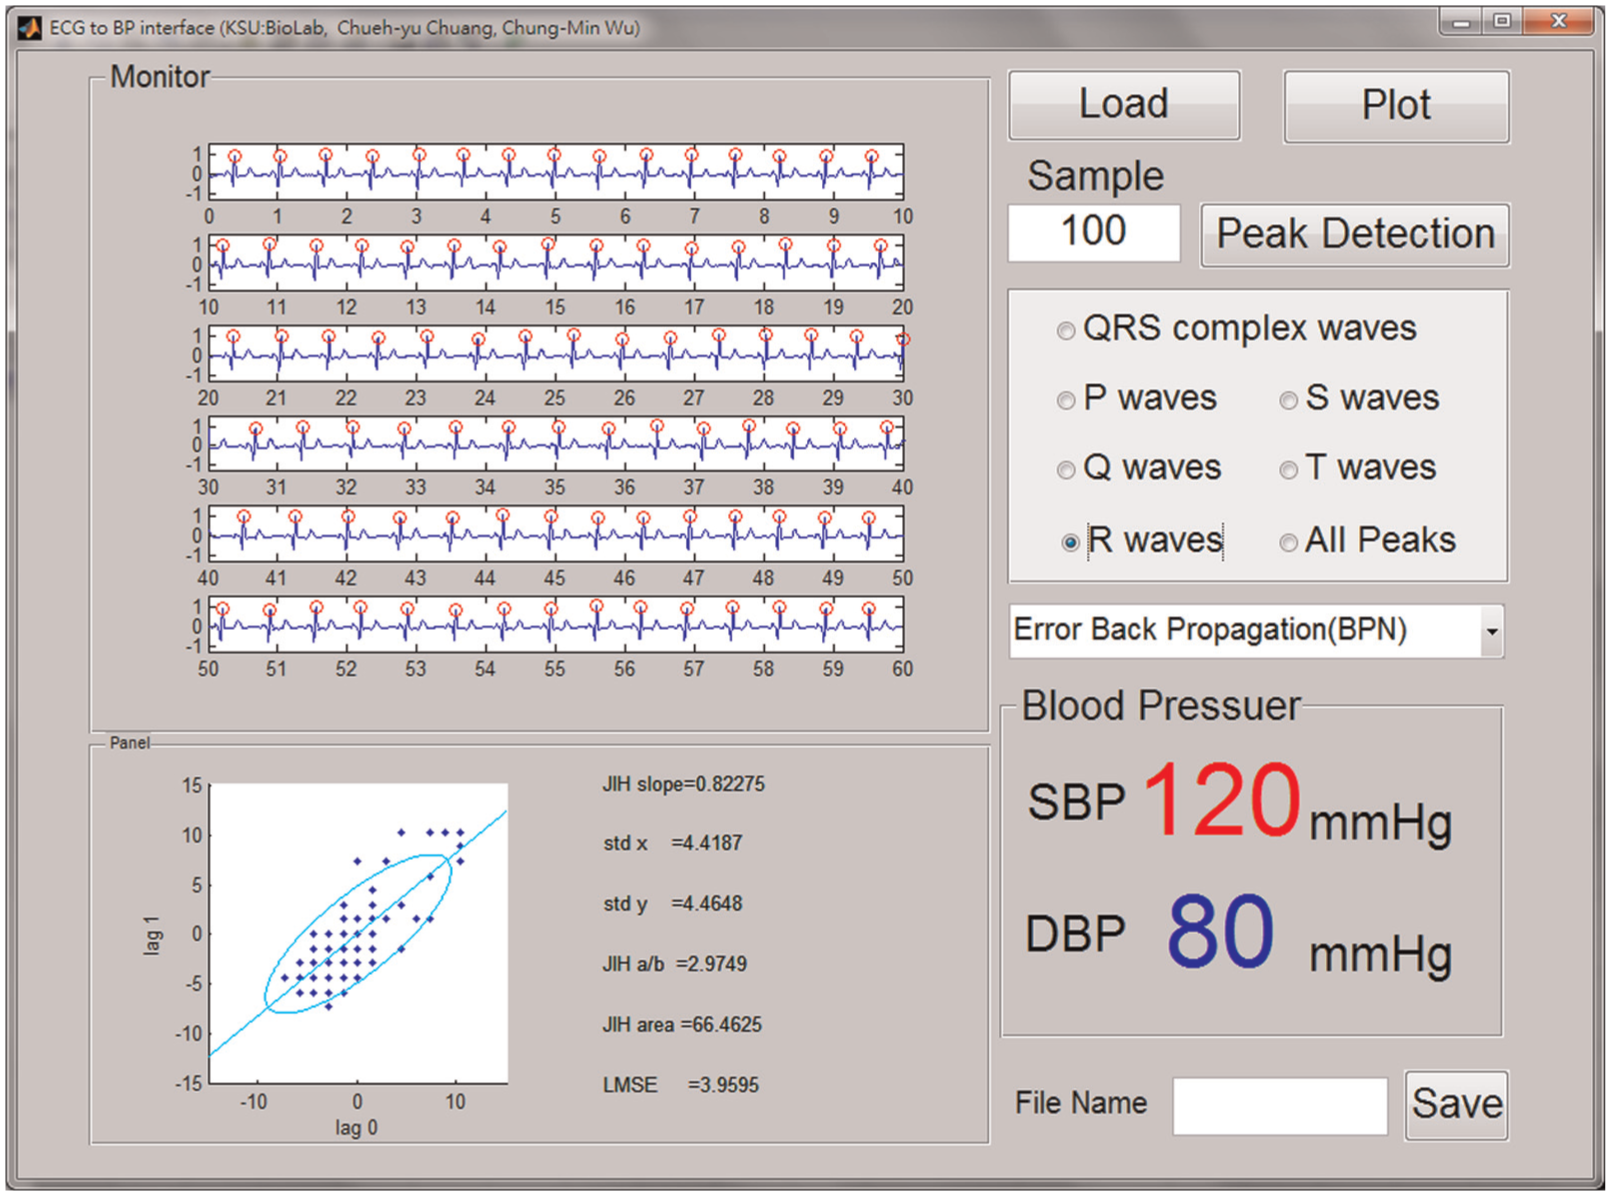
The analysis platform for the ECG signal.
Result
Measurement experiments
In this study, we input ECG, PPG, and BP measurements (Figure 7). The signal processing steps involved signal peak detection and correlation analysis and determined the best parametric relationship between these signals.

Experimental measurements using (a) the PPG measurement device and (b) the ECG measurement device.
The peaks detected in the ECG and PPG by the fuzzy threshold algorithm are shown in Figure 8. The dotted line is the threshold of peak detection in Figure 8(b) and (d). Figure 8(c) displays the peaks from the PPG, with a threshold value of detection of a peak by 50% of the maximum amplitude of the PPG.

Peak detection in ECGs and PPGs comparing raw and fuzzy data: (a) ECG raw data, (b) fuzzy ECG’s R wave peak detection, (c) PPG peak detection, and (d) Fuzzy PPG’s peak detection.
Analysis of ECG and PPG characteristics
Initially, we collected ECG and PPG data from five participants to find the characteristic between ECG and PPG. After signal processing, the characterizing correlation analysis between ECG and PPG signals is shown in Table 2. We selected from Table 2 the relevant characteristics higher than 68.2% (one standard deviation) of the interval parameters (ET, RT, QT, ST, TP, TQ, and TR) for the neural network input variables.
The characterizing correlation analysis between ECG and PPG signals.

PPG: photoplethysmogram; ECG: electrocardiogram.
Estimated value of BP
Using the ET, RT, QT, ST, TP, TQ, and TR time segments as an input signal to the neural network, this study established two back-propagation neural network architectures with 4 input nodes, 40 hidden nodes, and 1 output node. One block estimated the SBP (ET, QT, RT, and ST as input), and the other estimated DBP (ET, TP, TQ, and TR as input). The 50 participants in this study were 20–26 years old, and we collected two datasets per subject for a total of 100 datasets. Of these, 50 datasets were used for training and another 50 datasets for testing. After learning 50 datasets (Figure 9), the subjects direct 1-min ECG measurements, and calculated BP values, we compared the estimated value of BP (ECG-BP, PTT-BP) with the value of the mercury sphygmomanometer (KENLU model K-300), as shown in Appendix 1. The average error rate of the estimated SBP was 1.96% and the average error rate of the DBP was 2.14% in ECG-BP model. The average error rate of the estimated SBP was 6.23% and the average error rate of the DBP was 6.23% in PTT-BP model.

The training performance of the neural network.
Conclusion
In this study, the average error rate of the BP measurement was lower than 5% (1.96%/2.14% for SBP/DBP) compared with the KENLU model K-300 mercury sphygmomanometer. BP can be affected by extrinsic environmental and behavioral factors, as well as intrinsic cardiovascular regulatory mechanisms. The back-propagation neural network utilizes a supervised learning algorithm that can trace variable HR with user behavioral change and adapt to estimate the BP value in real time. In summary, this study can be used to observe the dynamic changes in BP, and the proposed approach alleviates the errors caused by discomfort to provide a feasible method to continuously monitor BP under less stressful conditions. This study measured the ECG bio-signal to estimate the BP value using a signal measurement device that reduces interference from high frequency noise and motion aliasing, rather than simultaneously measuring the ECG and PPG. We can observe that the ECG-BP model proposed in this article is more accurate than the PTT-BP model 11 in Appendix 1. This technology has significant potential to advance healthcare.
Footnotes
Appendix
The estimated values of blood pressure using the intelligent neural network algorithm.

| Subjects | Mercury manometer |
ECG-BP |
PTT-BP |
|||
|---|---|---|---|---|---|---|
| SBP | DBP | SBP | DBP | SBP | DBP | |
| 01 | 118 | 72 | 123.29 | 74.80 | 108.54 | 67.65 |
| 02 | 138 | 88 | 130.77 | 86.38 | 128.34 | 80.73 |
| 03 | 138 | 86 | 136.57 | 86.51 | 134.34 | 83.73 |
| 04 | 130 | 76 | 134.76 | 76.53 | 134.34 | 83.73 |
| 05 | 108 | 72 | 105.80 | 72.27 | 118.24 | 70.64 |
| 06 | 112 | 70 | 114.01 | 70.89 | 113.90 | 78.80 |
| 07 | 128 | 84 | 128.43 | 84.70 | 125.70 | 85.60 |
| 08 | 130 | 90 | 128.02 | 90.36 | 140.80 | 87.76 |
| 09 | 118 | 76 | 116.70 | 76.57 | 120.43 | 75.57 |
| 10 | 120 | 80 | 118.32 | 80.81 | 124.16 | 81.20 |
| 11 | 130 | 90 | 124.50 | 90.24 | 126.52 | 89.94 |
| 12 | 138 | 98 | 137.71 | 98.80 | 136.29 | 98.80 |
| 13 | 108 | 68 | 106.08 | 68.34 | 105.92 | 72.72 |
| 14 | 114 | 72 | 122.53 | 72.10 | 125.53 | 69.10 |
| 15 | 126 | 78 | 123.96 | 78.06 | 128.09 | 75.06 |
| 16 | 108 | 72 | 106.72 | 73.36 | 136.90 | 85.30 |
| 17 | 106 | 64 | 108.40 | 67.27 | 121.82 | 63.58 |
| 18 | 122 | 72 | 129.11 | 78.27 | 129.57 | 66.20 |
| 19 | 138 | 86 | 134.92 | 84.93 | 130.02 | 70.35 |
| 20 | 118 | 78 | 119.61 | 81.09 | 126.37 | 69.12 |
| 21 | 122 | 80 | 125.51 | 80.75 | 127.82 | 69.61 |
| 22 | 108 | 68 | 120.31 | 68.84 | 125.66 | 64.88 |
| 23 | 116 | 78 | 117.33 | 78.11 | 124.85 | 68.61 |
| 24 | 128 | 88 | 124.58 | 83.83 | 127.92 | 82.64 |
| 25 | 118 | 84 | 116.93 | 84.44 | 123.46 | 68.13 |
| 26 | 130 | 88 | 131.65 | 89.83 | 129.36 | 70.13 |
| 27 | 108 | 68 | 109.26 | 69.68 | 127.80 | 69.60 |
| 28 | 128 | 70 | 128.11 | 70.58 | 123.98 | 68.31 |
| 29 | 130 | 96 | 129.85 | 96.65 | 130.13 | 90.39 |
| 30 | 102 | 66 | 101.59 | 66.22 | 109.86 | 66.30 |
| 31 | 110 | 68 | 109.59 | 68.11 | 120.12 | 66.38 |
| 32 | 110 | 70 | 109.94 | 42.57 | 120.05 | 66.36 |
| 33 | 114 | 64 | 112.18 | 62.97 | 121.24 | 65.75 |
| 34 | 118 | 70 | 117.37 | 71.36 | 127.76 | 65.59 |
| 35 | 128 | 74 | 128.28 | 75.62 | 130.11 | 70.38 |
| 36 | 126 | 76 | 126.23 | 76.20 | 128.28 | 69.76 |
| 37 | 124 | 68 | 124.56 | 69.91 | 128.33 | 69.78 |
| 38 | 108 | 66 | 107.85 | 66.70 | 106.38 | 65.12 |
| 39 | 128 | 80 | 125.02 | 80.88 | 127.49 | 77.49 |
| 40 | 140 | 82 | 129.01 | 82.52 | 127.00 | 79.33 |
| 41 | 120 | 86 | 118.09 | 86.33 | 127.01 | 89.33 |
| 42 | 138 | 78 | 137.45 | 79.38 | 126.06 | 69.01 |
| 43 | 120 | 86 | 120.92 | 86.44 | 130.13 | 70.39 |
| 44 | 136 | 86 | 136.21 | 86.79 | 130.04 | 78.36 |
| 45 | 118 | 86 | 117.38 | 85.96 | 129.73 | 80.25 |
| 46 | 86 | 54 | 85.64 | 54.06 | 104.40 | 58.45 |
| 47 | 106 | 70 | 107.00 | 69.68 | 110.14 | 70.39 |
| 48 | 118 | 84 | 124.29 | 82.89 | 110.04 | 80.36 |
| 49 | 128 | 68 | 128.20 | 68.56 | 129.89 | 66.31 |
| 50 | 130 | 66 | 131.67 | 66.99 | 129.89 | 66.30 |
ECG: electrocardiogram; BP: blood pressure; PTT: pulse transit time; SBP: systolic blood pressure; DBP: diastolic blood pressure.
Academic Editor: Stephen D Prior
Declaration of conflicting interests
The author(s) declared no potential conflicts of interest with respect to the research, authorship, and/or publication of this article.
Funding
The author(s) disclosed receipt of the following financial support for the research, authorship, and/or publication of this article: The authors gratefully acknowledge the support provided to this study by the Ministry of Science and Technology, Taiwan, Republic of China, under Contract MOST 104-2627-E-006-001.