
Abstract
This article is aimed at identifying the main risk behaviors of pedestrians, sorting them on the basis of risk levels, and, moreover, performing risk assessment and intervention for the pedestrian. In order to achieve this goal, this article analyzes a large amount of traffic accident data in Beijing and finds that the movable sight obstacle is an important cause for traffic accident between pedestrians and motor vehicle (hereinafter referred a vehicle–pedestrian accident). Some tables and figures display when and where the movable sight obstacle usually occurs and also shows their logical relationship with other causes. Based on the results of investigation and analysis, the vehicle–pedestrian mechanism diagram was established using the method of fault tree analysis. The diagram shows some key factors and their effect level leading to the accident. The key importance coefficient model was adopted to estimate the function of individual risk behavior quantitatively during the processing of accident. In order to take advantage of the key importance coefficient model, the following research was conducted: first, we analyzed traffic accident data from 2005 to 2014 to find common pedestrians risk behaviors. Second, since traffic accidents and movable sight obstacle are closely related to motor vehicle violations, we collected and analyzed the data of traffic enforcement from 2007 to 2014. Finally, taking into account the individual preferences of policemen, we interviewed 200 police officers and others to calibrate our estimates. Through these efforts, we sorted the pedestrians’ risk behaviors in table. Unlike past research, the object of this study is pedestrian risk behaviors and faults. Furthermore, we also gained understanding to the mechanism of vehicle–pedestrian accident, which was already applied to assessment and intervention for pedestrians in some primary schools in Beijing.
Introduction
As automobile transportation continues to increase around the world, bicyclists, pedestrians, and motorcyclists, also known as vulnerable road users (VRUs), will become more susceptible to traffic crashes, especially in countries where traffic laws are poorly enforced. 1 In terms of pedestrian crashes on a worldwide scale, over 400,000 pedestrians die every year with over half of these deaths occurring in low-income countries. 2 After the Chinese “Road Traffic Safety Act” was formally implemented in 2004, the number of deaths due to traffic accident is continuously reducing. From 2005 to 2009, the number of death in traffic accident of Beijing decreased by 11% per year on average. But the reduction ratio of traffic fatalities in vehicle–pedestrian accidents per year is 1% lower than the above average. Moreover, compared with 2005, deaths of vehicle–pedestrian accidents accounting for the proportion of the total increased by 10.5% in 2012. The number of traffic deaths in Beijing by different traffic modes is as follows in descending order: pedestrians, motor vehicle drivers, non-motor vehicle drivers, and occupants (motor vehicle and non-motor). A thorough analysis found the number of pedestrians’ deaths at almost twice as many as that of passenger car drivers. Pedestrian fatalities in the United States increased 4% from 2009 to 2010 resulting in 4280 pedestrian deaths. Another 70,000 were injured in 2010. 3
In order to improve transportation safety and infrastructure of pedestrians and non-motor vehicles, some researchers applied various analysis methods to help understand relationship between pedestrian’s behavior and the vehicle–pedestrian accidents, such as cognitive word analysis 4 and the theory of planned behavior.5,6 K Haleem et al., 7 S Rankavat and G Tiwari, 8 and W Elias and Y Shiftan 9 used logit model as a method of quantities’ analysis in their study on pedestrian road crash. However, they rarely did a systematic and specialized research into common pedestrian psychological behavior characteristics. On the other hand, few of the previous studies focused specifically on crashes at which the pedestrian was deemed to be “at-fault,” 10 compared with more attention paid to the driver’s behavior. Surely, these “at-fault” accidents and pedestrian behavior are inseparable in many cases. Some researchers already tried to apply fault tree analysis (FTA) to studies of the traffic safety field. Austrians B Kohl and K Botshek 11 used FTA to decompose the 14 risk factors easily leading to accidents in tunnels and calculated the probability of traffic accident in a tunnel. EA Vaconcellos 12 and Tira M et al. 13 took advantage of FTA in a study of traffic accidents involving VRUs, but only stay in the medium level of the cause chain of accident. These studies did not touch movable sight obstacle (MSO) and pedestrian violations, as well as other basic events.
Different from previous studies, this article attempts to mainly use quantitative methods to identify risky behavior of pedestrians with qualitative methods for the assistance, with the risk behaviors sorted by risk level. They are the two core issues of this study. Compared with qualitative research, there is a big difficulty for quantitative study of risk behavior of pedestrians. Significance of quantitatively identifying of risky behavior of pedestrians is that we can better assess the risk of pedestrians, so that methods and objects of safety publicity and education will be clear.
Data and methodology
Collection of traffic accidents’ files. According to Chinese law, traffic accidents investigated according to non-simple procedures will be saved in the form of files. Basic case information, parties and witness transcripts, accident scene diagrams, photographs reflecting the accident scene, identifying documents, and so on are collected and organized in it. Reading files is one of the best ways of understanding the details of an accident. In order to find risk behaviors, and determine its causal relationship with the vehicle–pedestrian accident, more than 3000 documents were picked out of 400 record books to study further. These files record some traffic fatalities which took place in Chaoyang District of Beijing from 2005 to 2014.
Data from Accident Information System (AIS). From the Beijing Traffic Management Bureau’s (BTMB) AIS, 321,205 road traffic accidents were randomly downloaded in excel format, which took place during 2008 to 2014 and were investigated as non-simple procedures (the vast majority involving casualties). Every accident’s information includes serial number, brief case, time of occurrence, administrative division, and location of occurrence, name of parties, personnel number, age, gender, identification numbers, transportation pattern, financial responsibility, and contact information. Wherein the brief case includes time and location of occurrence, transportation mode, travel (walking) direction, accident consequences, and other information.
Data of penalties for violations of road traffic and questionnaire. For every traffic violation, there is a corresponding digital code, which means a certain amount of punishment. After BTMB authorization, all penalties for traffic violations can be downloaded in excel format. A questionnaire was conducted at the training center of BTMB, where a group of local policemen regularly come to be trained every year. At the training center, there are still some ordinary students, who will most likely be police officers in the near future. In accordance with the need to study, questionnaires were divided into two groups. A total of 200 police officers as a group were asked to fill in two questionnaires: a survey of their tendency in the enforcement process and one of travel behavior and habit as an ordinary pedestrian. The second group consisting of 100 students was on survey of their travel behavior and habit as an ordinary pedestrian.
Qualitative analysis of the study is based primarily on a large number of first-hand accident files. Experienced specialists were also invited to discuss and review the mechanism diagram of vehicle–pedestrian accidents. FTA was applied to quantitative analysis of data. In the derivation and calculation, we used the MATLAB as a compute tool.
Mechanism diagram of vehicle–pedestrian accidents
Road traffic accidents are generally considered as negligent and unintentional events. Therefore, specific to the vehicle–pedestrian accident, the leading cause is that the vehicle driver does not notice the pedestrian on the road in advance. On the other hand, pedestrian’s fault was concentrated in suddenly rushing out in front of the vehicle from behind an obstacle without reasonable attentiveness. These obstacles may be divided to be MSO (as shown in Table 1) or stationary obstacle. According to the 2008–2014 accident data from AIS, pedestrian crossing the roadway without the right of way caused 34.3% of vehicle–pedestrian accidents, which accounted for the highest proportion of vehicle–pedestrian (as shown in Figure 1). Furthermore, both the accident scene investigation and analysis of traffic accidents’ files found that the MSO playing an important role in vehicle–pedestrian accident leads to the above result. Actually, behind many other reasons, there are still a large number of traffic accidents caused by MSO fundamentally and never recorded into the statistical directory due to the quick disappearance of MSO and the aim of most of the accident investigation only due to insurance compensation.
Common MSO.

MSO: movable sight obstacle.

Cause of vehicle–pedestrian crashes.
FTA is a deductive reasoning, which can signify the logic relationships between system possible faults and their causes by means of FT. Through qualitative and quantitative analyses of FTA, major causes of faults are identified, which will offer solid foundation to safety countermeasures to predicate and prevent faults. 14
Based on the above analysis, the pedestrian-accident mechanism diagram was drawn as shown in Figure 2.

Mechanism diagram of vehicle–pedestrian accidents.
Quantitative classification of risk behavior
On the basis of Figure 2, the logical relationships between the probabilities of the bottom risks and basic events are given in Table 2. Risk behavior in general is illegal, but some small part of it is common and legal. Unless one of parties completely has no way to avoid the accident, it is thought that both sides have varying degrees of lack of attention on traffic safety. Therefore, risk mechanisms of most vehicle–pedestrian accidents are described in Figure 2 and Table 2. Violation behavior of driver consists of speeding, drunk driving, and so on.
Risk probability.

MSO: movable sight obstacle.
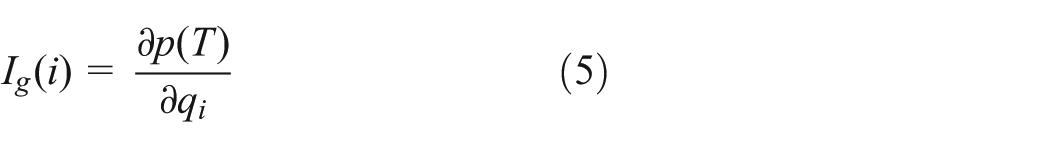
FTA has three important weighted coefficients: structure importance, probability importance, and key importance coefficient (KIC). KIC reflects the impact on probability of the top event from the prospective of sensitivity and basic events’ probability, which is more accurate than others. So, this allows it to be applied as a tool for finding the ranking of diagnosis and prevention measures, expressed as

where

From Figure 2, we can learn that all basic events are under branch A2. Therefore, p(T) can be replaced by p(A2). Additionally, combining Table 2 and formula (2), formula (3) is derived as follows

From equation (2)

According to the definition of probability importance coefficient
where
By formula (3), causes of traffic accidents are thoroughly decomposed, and a method for quantitative analysis of causes of accidents is provided. Although the formula cannot completely determine the specific value of dependent variable in most cases, it is almost impossible to get the exact top event probability; the study of comparable risk classification with the help of formula (3) can proceed more smoothly.
From those 3000 files and documents recording 400 traffic fatalities which took place in Beijing from 2005 to 2014 and were randomly sampled, some important information was obtained and summarized in Table 3.
Risk behaviors of pedestrians.

Next, 54 kinds of violations, related to above risks, were selected and calculated for the cumulative proportions from risk A to risk F, respectively (Table 4).
Traffic punishments to driver.

Source: Beijing Traffic Management Bureau.
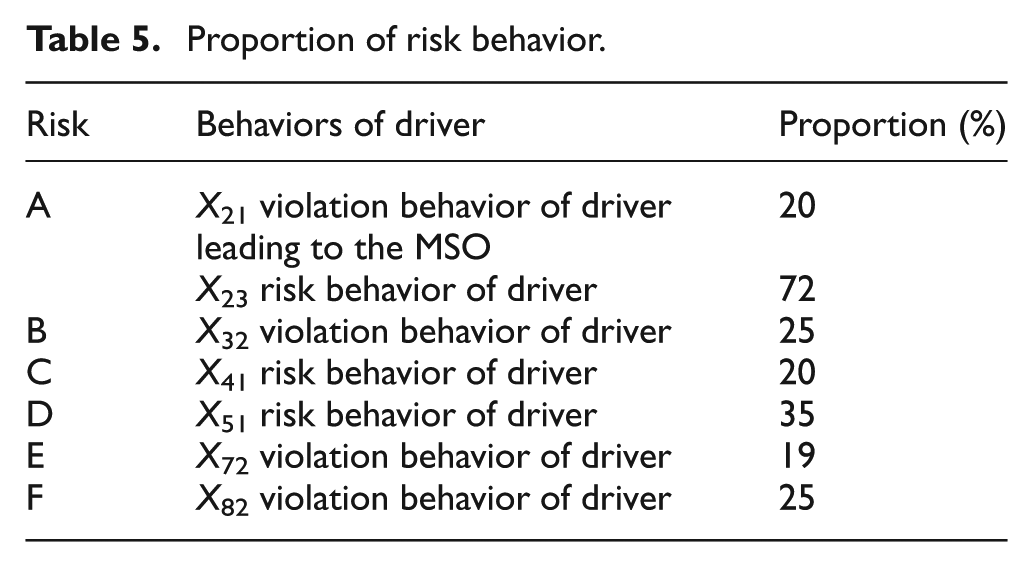
Traffic policemen have different preferences in punishing violations. Therefore, 200 traffic policemen on duty were surveyed in written questionnaire. The data in Table 4 are correspondingly modified according to the survey results and Table 5 is obtained as follows.
Proportion of risk behavior.
Additionally, the above 200 police officers and 100 other students were surveyed as ordinary pedestrians; questionnaires and the results are shown in Table 6.
Questionnaire statistical.

Combining Figure 2, q23, q33, q42, q52, q73, and q83 are, respectively, set to be 50%, 65%, 46%, 50%, 55%, and 50%.
Some events’ probabilities of occurrence are very difficult to be estimated (Table 7, q31, q71, etc.) and have to be represented by P0, P1, and so on. Finally, KIC of every risky behavior can be compared by total value of the numerical parts (constants) and their coefficients.
Setting values or symbols.

Accordingly, through formulas (3)–(5) and Table 7, we can obtain the results of KIC with parameters (equations) as given in Table 8.
KIC of risk behaviors

KIC: key importance coefficient.
In Table 9, dangerous degrees of top–down behaviors sequentially weaken. These 14 kinds of behaviors that we believe are relatively risky behaviors. According to the degree of risk of each act, we can set them in different scores (Table 10). In this way, the degree of the traffic risk of pedestrians can be assessed, and risk behavior can be identified, as well as targeted intervention can be conducted.
Sorting of pedestrian risk behaviors.

Questionnaire of pedestrians.

Risk intervention
1. Setting auxiliary observation equipment and expanding the observation scope of the multi-lane intersection. As Figure 2 shows, the decrease in MSO will greatly contribute to reduce the pedestrian accidents. Compared with the public traffic safety education and law enforcement, adding convenient auxiliary observation equipment can prevent similar accidents more directly. According to Figure 3, adding convex mirror at the top of the central lane-divided line near the bus stop can widen the driver’s observation scope (Mark 1 in Figure 3). It will be able to assist drivers to see those pedestrians crossing the roadway in front of buses illegally. Adding an auxiliary observation device based on infrared, microwave, or video detection technology at the horizontal light pole or sign pole at the marked crosswalk or intersection can expand the observation scope (Marks 2 and 3 in Figure 3). It will not only be able to prevent the vehicle–pedestrian accident caused by MSO but also prevent the vehicle accidents coming from different directions. Obviously, it is in general cheaper than many other ways.

Auxiliary observation equipment installation diagram.
Some developing intelligent transportation systems are beneficial to the pedestrian, such as various types of in-pavement marker (IPM) systems, 15 right turning assistance systems, 16 the Virtual Wall, 17 and Advanced Driver (Rider) Assistance Systems (ADAS). 18
2. Pedestrian traffic risk assessment and intervention. Table 9 tells us what behavior is dangerous for pedestrians, as well as the sorting of their degree of danger. However, this study did not distinguish between the pedestrian’s ages, sex, and occupation. Thus, for pedestrians of different work and rest rules, different behaviors should set different scores. For example, for the supermarket staff who work at night, those risk behavior happening at night are more common and should be set a higher score. Overall, vehicle–pedestrian crashes are responsible for more than a third of all traffic-related fatalities and injuries worldwide. 19 Beterem 20 reported that 61.8% of children injuries in Israel were injured in traffic crashes, 29.2% among them in motorized vehicles and 27.3% as pedestrian. In view of this point, Table 10 was specifically designed for primary students.
After filling in Table 10, if the final score of each line, obtained by multiplying every cell in a line together, is greater than (or equal to) 20 points or the cumulative total score for each row is greater than (or equal to) 50 points, the pedestrian will be confirmed to be at traffic risk and needs a specific analysis and intervention.
Conclusion
In this article, the main conclusions are as follows:
A traffic accident is a multi-cause event. Mechanism diagram (Figure 2) demonstrates the logical relationship between events that may occur in the transportation system and the various causes directly leading to the accident. It will also help to understand pedestrians crossing the roadway without the right of way, with MSO existing, is the most important cause of fatal vehicle–pedestrian accidents
There are seven risk behaviors as follows, which cause nearly 50% of the total fatal vehicle–pedestrian traffic accidents: crossing the highway or intersection without the right of way, crossing the road quickly in front of the large vehicle, walking on road or crossing road with dark clothes at night or early in the morning, suddenly walking backward when crossing the road, paying no attention to children’s safety as guardian, walking close to the large vehicle moving fast, and staying on the lane-divided line at night.
According to the frequency in daily life and the number of fatal traffic crashes caused by it, the major risk behaviors of pedestrian are as follows (dangerous level from high to low): crossing the highway or intersection without the right of way where there is legal crossing facilities nearby, walking on road or crossing road with dark clothes at night or early in the morning, staying on the lane-divided line at night, crossing the road quickly in front of the large vehicle, changing the direction on road suddenly to bypass obstacles, crossing expressway, walking alone when drunk, suddenly walking backward when crossing the road, walking closely behind the reversing vehicles, and walking close to the large vehicle moving fast.
Based on the classification of risk behavior of pedestrians, as well as the sorting of their degree of danger, different behaviors may be set different scores. Additionally, for different pedestrians, age, sex, occupation, score of behavior can be slightly adjusted accordingly. In this way, we can preliminarily conduct the assessment for pedestrian traffic risk and develop targeted interventions.
Because of the limited data, this article only compared risk behavior preliminarily on the basis of quantitative analysis. However, it is foreseeable that if there are more sufficient data in the future, more detailed quantitative sorting for pedestrians risk behavior can be estimated.
Footnotes
Appendix 1
Academic Editor: Geert Wets
Declaration of conflicting interests
The author(s) declared no potential conflicts of interest with respect to the research, authorship, and/or publication of this article.
Funding
The author(s) disclosed receipt of the following financial support for the research, authorship, and/or publication of this article: This research was funded by Beijing Education Science Planning fund (CGA14159). The authors are thankful for its support.