
Abstract
Remaining useful life estimation of the prognostics and health management technique is a complicated and difficult research question for maintenance. In this article, we consider the problem of prognostics modeling and estimation of the turbofan engine under complicated circumstances and propose a kernel principal component analysis–based degradation model and remaining useful life estimation method for such aircraft engine. We first analyze the output data created by the turbofan engine thermodynamic simulation that is based on the kernel principal component analysis method and then distinguish the qualitative and quantitative relationships between the key factors. Next, we build a degradation model for the engine fault based on the following assumptions: the engine has only had constant failure (i.e. no sudden failure is included), and the engine has a Wiener process, which is a covariate stand for the engine system drift. To predict the remaining useful life of the turbofan engine, we built a health index based on the degradation model and used the method of maximum likelihood and the data from the thermodynamic simulation model to estimate the parameters of this degradation model. Through the data analysis, we obtained a trend model of the regression curve line that fits with the actual statistical data. Based on the predicted health index model and the data trend model, we estimate the remaining useful life of the aircraft engine as the index reaches zero. At last, a case study involving engine simulation data demonstrates the precision and performance advantages of this prediction method that we propose. At last, a case study involving engine simulation data demonstrates the precision and performance advantages of this proposed method, the precision of the method can reach to 98.9% and the average precision is 95.8%.
Introduction
With the increasing flight mission, engine complexity, and informationalized level, along with the aircraft crash frequency, demands to ensure the performance and reliability of aircraft engine have become increasingly important. Based on a traditional maintenance strategy and approach, turbofan engines may not prognosticate, isolate, and repair the faulty part quickly when they are still in an operational state, so the engine may break down before its scheduled overhaul. Therefore, turbofan engine availability may slow down while related maintenance costs rise, for example, the maintenance costs of aircraft engines almost reach the 70% of their whole life cycle costs. 1 As the maintenance mode changes from time scheduled to condition based, enhancing the diagnostics and prognostics can improve the engine reliability and availability while reducing life cycle costs, which is the key technology of turbofan engine maintenance. 2
For turbofan engines, improved engine availability and reduced maintenance costs can be achieved by using the engine’s health state information obtained from diagnostic and prognostic analysis. This is an effective way to achieve condition-based maintenance. YG Li and P Nilkitsaranont 2 described linear and quadratic models of the regression techniques and used historical health information to estimate the remaining useful life (RUL) of gas turbine engines before the next engine major overhaul. Li et al. 3 combined failure mode (criticality information provided by failure mode, effects, and criticality analysis (FMECA)) with reliability analysis to predict the engine’s turbocharger lifetime. Vanini et al. 4 proposed an fault diagnosis isolation (FDI) system using the multiple model method and the dynamic neural networks (DNNs), which connect each specific operating mode used for aircraft gas turbine engines. The mode is either a healthy engine or the failure condition engine. Basir and Yuan 5 investigated a multi-sensory fusion model based on the Dempster–Shafer evidence theory to detect the engine quality and predict the engine life cycle. M Chen et al. 6 proposed a probabilistic model of the turboshaft engine to estimate the engine’s overall performance and to consider the effect of many uncertainties. Empirical mode decomposition (EMD) is an extremely useful signal processing technique, and many researchers used this method in gas turbine engine fault diagnosis and RUL prognosis. 7 Based on the above authors’ work, it is very important that the model is the key factor for predicted RUL. If an insufficient data set is available for algorithm training, modified algorithms should be researched to enhance precision.
Fault diagnosis and prognostics for aircraft gas turbine engines are complicated by the presence of different manufacturing of the same type of engine and degradation during operation, the complexity of a trustworthy turbofan engine model, and the difficulty of obtaining variable parameters in the operating engine.8,9 Y Li and P Nilkitsaranont’s 2 model needs a great deal of historical health information, Li et al. 3 only focused one component of engine, Basir and Yuan 5 did not consider the nonlinear relationship of the outputs of sensors, M Chen et al.’s 6 probabilistic model contained the uncertainties, and the precision has the space to improve. In summary, it is difficult to establish an integrated turbofan engine degradation model based on physical machinery due to the number of subsystem interactions upon which turbofan engines are dependent. 10 An accurate failure degradation model for turbofan engines is not available for estimating the RUL. As a result, data-driven prognostics were proposed using historical lifetime data to deduce the system variation tendency.11,12 However, the data-driven-only approach (which does not include estimates of the failure degradation engine performance to assess turbofan engine performance and therefore predict the RUL) is not sufficient. So if we use a fatigue life formula such as the Arrhenius equation, or Eyring model, or one of its modifications in addition to the data-driven approach to predict the RUL of the turbofan engine, the precision will exceed any one of the individual methods mentioned above.13,14 In fact, researchers have increasingly focused on both the lifetime estimation based on variation parameters performance over time and the data-driven method, as this method (which corresponds to both real operational data and engine failure mechanisms) is more effective. 15
In the following sections, we propose a kernel principal component analysis (KPCA)-based degradation model for turbofan engine reliability. We assume that a commonly used equation for wear is provided and connect with the performance variation of parameters that enable us to assess cumulative degradation and predict the RUL of the engine. The primary contributions of this article are as follows:
We first analyzed the data of sensors that are created by the turbofan engine thermodynamic simulation through the KPCA method and distinguished the qualitative and quantitative relationships between the key factors.
Based on the result of KPCA analysis for the data generated by the turbofan engine simulation and the understanding in engine physical machinery at present, we proposed a degradation model for the turbofan engine based on the result of data analysis.
We established a health index equation to predict the RUL of the turbofan engine and used the method of maximum likelihood to estimate the parameters of the health index model on the basis of the data from the simulation model.
The organization of this article is shown as follows:
Section “Turbofan engine model” briefly presents the structure of the turbofan engine model.
Section “KPCA-based degradation model” describes the KPCA-based degradation model. It shows the engine system drift as a Wiener process and the result of the KPCA analysis as the key factor. We introduce the principle of the KPCA method and establish the engine degradation model.
Section “Predicting the RUL of the turbofan engine” describes a way of predicting the RUL of the turbofan engine. We propose a health index model of the engine and present how to estimate the model parameters using simulation data and the method of maximum likelihood as well.
Section “Case study” describes a case study in which we apply the proposed method to model the engine degradation and predict the RUL. Finally, we analyze the practicability and the benefit of our method.
Turbofan engine model
Engine fault detection and prognostics are representative sensor information fusion problem. It contains the information such as speed, vibration, altitude, sound, pressure, temperature, and so on, so it is important to build an appropriate model. This article chooses the engine model that is established by NASA. 16 The thermodynamic turbofan engine model simulation depicts and reflects a real aircraft turbofan engine. The engine composition in Figure 1 shows the main elements of the thermodynamic turbofan engine model. Figure 2 shows a flowchart of the engine that includes the main modules and describes the relevant detail of all model information.17–19 For the thermodynamic turbofan engine models, rotor and volume dynamics are involved in the nonlinear system. The engine model considered the volume dynamics and damage factors and added in an unbalanced mass flow rate. The limit factors of the thermodynamic turbofan engine model simulation control system have three high-limit regulators. These regulators avoid the turbofan engine from surpassing its design limits (such as engine speed, temperature of engine high pressure turbine, and pressure ratio). If the pressure of engine high pressure compressor becomes too low, a limit regulator could avoid this phenomenon. The corresponding speed limit regulator is an acceleration and deceleration.

Turbofan engine structure.
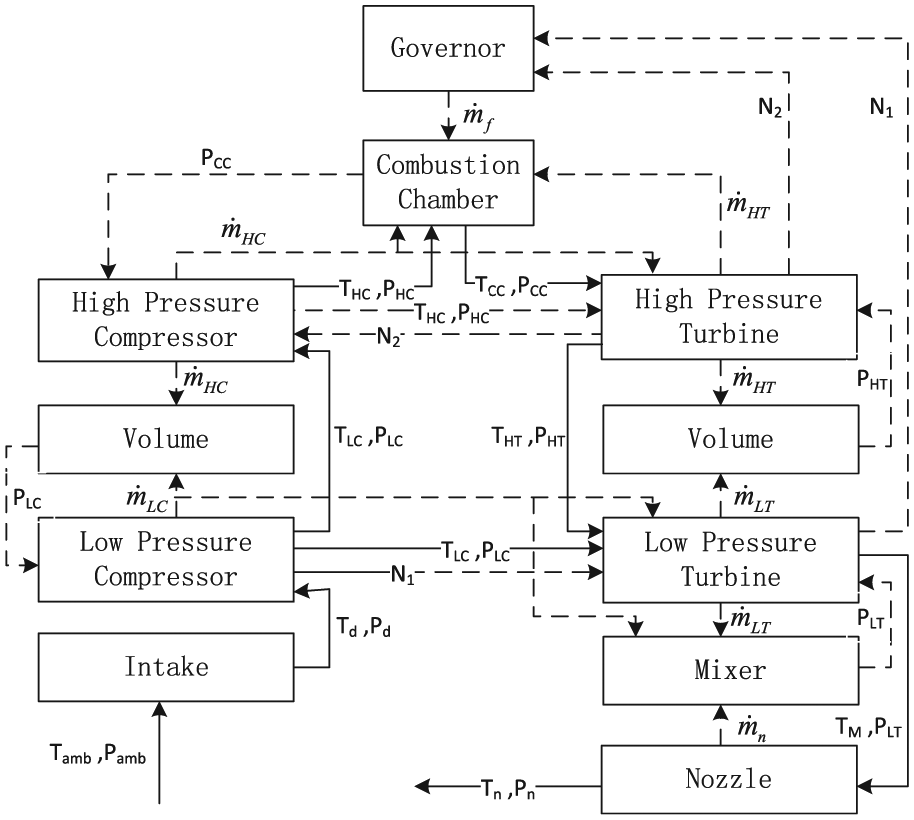
The thermodynamic turbofan engine simulation has 14 different inputs which include fuel flow, fan efficiency, fan flow, fan pressure-ratio modifier, low pressure compressor efficiency, high pressure compressor efficiency, and so on. It can also generate 21 outputs through the engine model with all inputs. The outputs include fan inlet temperature (T2), low pressure turbine outlet temperature (T50), high pressure compressor outlet temperature (T30), low pressure compressor outlet temperature (T24), actual core speed (Nc), and so on. The inputs enable the user to change the amplitude of variations that simulate the degradation processes containing fan, low pressure compressor, high pressure compressor, low pressure turbine, and high pressure turbine. The outputs contain different sensor measurement data and all of the engine operating life cycle data. In this article, we choose 21 different outputs to analyze and discuss, similar to what is used in the “Damage Propagation Modeling for Aircraft Engine Run-to-Failure Simulation” document. 16
This section shows the model and the training and testing data used in this article. The data are also used for estimating the RUL of the turbofan engine (the flow diagram of the proposed approach is shown in Figure 3). The proposed approach is presented in detail here.

Flow diagram of the proposed KPCA-based degradation model approach.
KPCA-based degradation model
As described in section “Turbofan engine model,” 21 different outputs from the gas turbine simulation were chosen to discuss in this article. Because of the large amount of output data, it is difficult to establish the degradation model. In addition, when the dimension of fault coefficient matrix is high, it may lead to a strong smearing effect. 20 Even if we establish a 21 dimension model, the calculation amount will be very large. Therefore, the output data should be processed before establishing the degradation model. In this study, the KPCA method was chosen to reduce the dimension of raw data.
Data preprocessing
When comparing the maximum and minimum numerical values of a limited data set, a huge difference exists. Normalization, however, can make the upper and lower bounds in a short value of a data set easier to analyze. In this study, there are two global approaches for normalization. The first approach is shown in equation (1), which is the min–max normalization 4

where xmin stands for the minimum value of x, xmax stands for the maximum value of x, and x′ represents the normalization value of x. This approach makes the range of x after processing become [−1, 1]. The second approach is shown in equation (2), and is the z-score normalization

where µ(x) represents the mean value of x, σ(x) represents the root-mean-square deviation of x, this z-score normalization generates the new data x′, the mean value of every member of the new data is closed to 0, and the root-mean-square deviation is closed to 1. This article uses the min–max normalization because it is difficult to analyze when the new data is close to 0. Generally, data normalization is the first step in data analysis or data training and testing. We use normalization data preprocessing in this article as the first step of the proposed KPCA-based degradation model approach. The benefit of this normalization approach is to reduce the probability of emerging abnormal values in the raw data.
KPCA
The KPCA method (which considered kernel factor) is the extension of the PCA in the nonlinear field. The input space xk (k = 1, 2, …, n) is mapped to the feature space F: Φ(xk)(k = 1, 2, …, n) by nonlinear mapping Φ: Rm→F. The basic KPCA method is introduced as follows.21–25
The covariance matrix CF should be constructed for principal component (PC) analysis in the high dimension feature space F. Through the data processing that above z-score normalization method makes ∑nk = 1Φ(xk) = 0, and the covariance matrix is afford by

So we can obtain the PC of the feature space F through the nonzero eigenvalues λ of the covariance matrix CF, which can be calculated by

where V is the corresponding eigenvector in the feature space F. And CFV can be expressed by

where

So eigenvector V can be given by
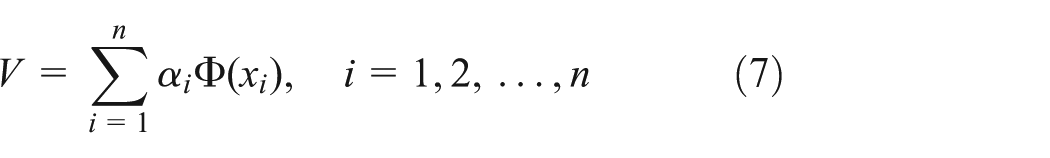
where αi is the corresponding coefficients.
Simultaneous equations (3)–(7)

To solve the above equation, a kernel matrix K with size n × n is defined, and its elements are given by

where
The kernel matrix K can be centralized by

where matrix
A Gaussian radial basis kernel function (RBF), which is expert in nonlinear system and the Gaussian RBF mapping feature space, distinguishes the characteristics very well. The Gaussian RBF is used in this article

where σ is the dispersion of the Gaussian RBF.
The kth KPCA-transformed feature pk can be achieved by

The computational complexity and the prognostic accuracy are influenced by the number of PCs. The larger the number of PCs, the more information is reserved, and the higher prognostic accuracy is ensured. However, the longer analysis time is needed with the larger number of PCs. In this article, the definition of the primary contribution is

An appropriate function is used to determine the number of PCs based on the cumulative percent variance theory

where λj is the eigenvalue of the jth PC with λ1 ≥ λ2 ≥ ··· ≥ λn, CL is the threshold of PCs, l is the number of PCs, and n is the number of data used to train KPCA. The CL generally equals 85% as threshold, and the number of PCs will be determined with the chosen adaptive, CL.
The degradation model
There is no clear engine degradation model based on engine component oxidation such as bearing stress resulting in engine breakdown, engine operation deformation, or gas path temperatures. There are two generally used estimation models shown here.
The first is the Arrhenius model that is used in machine faults. The Arrhenius model is expressed by

where tf is the fault happening time, T is the temperature when the failure appeared or the machine stopped working, k is a constant, A is a proportional coefficient, and ΔH is the energy value. At the beginning, this model simulated the process of chemical reaction and energy dissemination (i.e. it was used in physics areas and electronic devices). Lately, the modified Arrhenius model has been used in machines and other areas.
The second is the Eyring model, and the equation is given by

where tf is the fault happening time; α, ΔH, A, B, C, D, and E are constants with stress variation; S1 and S2 are related stresses; k is a constant; and T is temperature in degrees zero absolute temperature. The model describes the relationship between failure time and stress. The advantage of the Eyring model is that the equipment’s working temperature and stress are mixed together into one equation. And the weakness of this model is that there are too many constants to be defined and parameters to be measured. 16
We can find that the Arrhenius model and Eyring model are both the exponential function for the failure degradation. Although it is hard to establish a precise model for the complicated system that just uses a single function, an exponential function could have the ability to accommodate the variation law of deformation, temperature, oxidation, blade attrition, and engine breakdown. 26 By combining our results from the KPCA analysis simulation and the current understanding about the failure mechanism using the Arrhenius and Eyring models, we have devised a degradation model for the turbofan engine. The degradation model uses the results of the KPCA analysis, with the KPCA-transformed feature pk as a dynamic covariate. Based on the data analysis and physical principle, we established an equation for the degradation rate

where b stands for an unknown constant, pk(t) is the KPCA-transformed feature at time t, wk is a constant, t is the operating time, and l is the number of PCs. PCs trend model is introduced in Section “Case study.” In this equation, we ignore the sudden failure and assume the fault is a constant, slow accumulation.
The degradation, X(t) at time t is expressed based on equation (17)
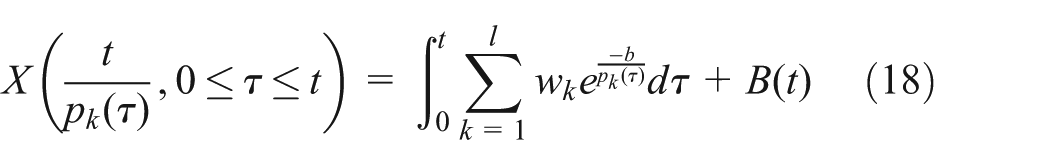
where B(t) is a Wiener process which include the alternating quantity σ2 B. Because the degradation is cumulative, equation (18) is the integral for equation (17). There are three unknown parameters in equation (18)

Predicting the RUL of the turbofan engine
Health index equation of the turbofan engine
As generally known, if we want to reduce maintenance costs and engine downtime, save people workload and repair time, and enhance the turbofan engine service life, the traditional hard time maintenance and failure-based maintenance should change to condition-based maintenance. 27 Predicting the RUL is a very important part of condition-based maintenance. We must design the maintenance schedule based on the RUL result. 28 We can use a model to describe the relationship between the engine’s health state and the outputs of the engine sensors.29,30 However, it is still difficult to implement the fault prognostic and RUL prediction of the engine due to the turbofan engine system’s complexity and the absence of a relevant structure describing the relationship between the high dimension of operating parameters and system performance.
Nonetheless, if the problem of unknown parameters evolves and the trend of each PC of the engine failure data can be solved according to model (18), an estimated wear degradation and RUL may be predicted.
In order to estimate the engine RUL directly, a turbofan engine health index model, H(t), was built based on the wear degradation model and the fault threshold. The fault threshold, thw, is a value representing when the engine will stop working and when wear accumulation equals that value. The health index model is given by

Combine wear and threshold parameter
The health index model is

When equation (20) is obtained, equation (18) is put into equation (19). From the equation above, it is clear that the turbofan engine will fail when the health index equals zero. And the RUL of turbofan engine can be obtained through the health index.
The method of estimating the health index parameters is also very important. Fourier transform is good at analysis signals in frequency domain and disassembles data in different frequencies. But Fourier transform is not appropriate for a nonlinear signal. 31 Wavelet Packet Energies are skilled in nonlinear signal processing, but this method lacks wavelet filter parameters selection. Hidden Markov Model (HMM) is skilled in processing unknown parameters in which the established model should be a Markov process, and the HMM approach is usually adapted by dynamic fault model and prognostic problem on nonlinear data. The disadvantage of the HMM method is that it is hard to process the failure model with big data. 32 The maximum likelihood estimation (MLE) is a statistical method. The main idea of this method is to make the probability of approaching the sample observation maximum when used in the appropriate calculated parameter estimator. We can use the known sample conclusion to back step the most probability value of estimated parameters, resulting in this chosen sample. 33 That is to say, it is a very useful method to calculate the parameters with a time series. In this study, we choose the MLE method to calculate the health equation parameters.
MLE of the health index prediction
We assume that there are n output samples of the turbofan engine failure simulation. We also assume the life cycle of the engine operation is ti,g, g = 0, 1, 2, … and ti,0 = 0 in sample unit i, the Xi(ti,g) represents the degradation level. The PCs of unit i at time j is pi,j, j = 0, 1, 2, … In the following discussion, the approach of MLE is studied carefully and solves the problem of unknown parameters by analyzing the engine simulation generated data through the MLE method. Our analysis in the following figure shows that the wear of engine components increase as cycle increases.
According to health index equation (20), let

Health index equation can write in sample i and time ti,g

where


Let Yi = (Yi,1, …, Yi,m) stand for the increased degradation, that is

And assume that Δt = ti,g−ti,g−1 and Δvi,g = vi,g− vi,g−1. Then we can get that

where
In the above equation,
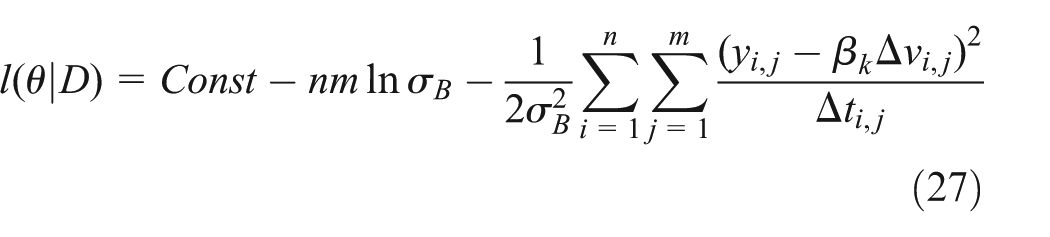
The likelihood formula for D which is the observation data

The relevant log-likelihood formula is
The equation (27) is processed by differential approach
and

We can get the restricted maximum likelihood estimations (RMLEs) through calculating the follow two formulas for σB and βk

We can get the profile log-likelihood that puts formula (30) into formula (27)
From equation (31), we can get
RUL-predicted result valuation
RUL-predicted result valuation is used to evaluate the output of the health index model. RUL-predicted result valuation is different from error or variance. We know that error and variance are just quantitative analyses, and they cannot reflect the weight of the predicted result. The difference between the pessimistic useful life (where the predicted RUL is shorter than real life) and the optimistic useful life (where the predicted RUL is longer than real life) is shown in Figure 4. This figure also shows the failure degradation that only considers a constant fault incident without a sudden fault incident. In turbofan engine health management, a short RUL can reduce the engine fault incidence rate but enhance maintenance costs; a long RUL can save maintenance costs, but engine breakdown may happen while the aircraft is flying. Therefore, evaluation of early prediction and late prediction is totally different.
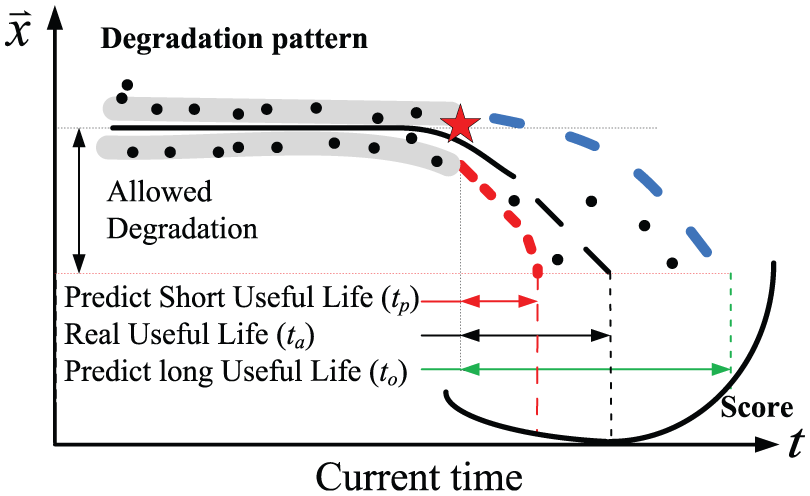
Degradation and prognostic score model.
In this study, RUL-predicted result valuation is the sum of the health index model predicted errors with different weights. We think that the weight of early prediction is higher than late prediction. The score equation for RUL-predicted result valuation is given in equation (32). From this equation, we can find that the lower the score is, the higher the predicted evaluation will be, which is shown in Figure 4
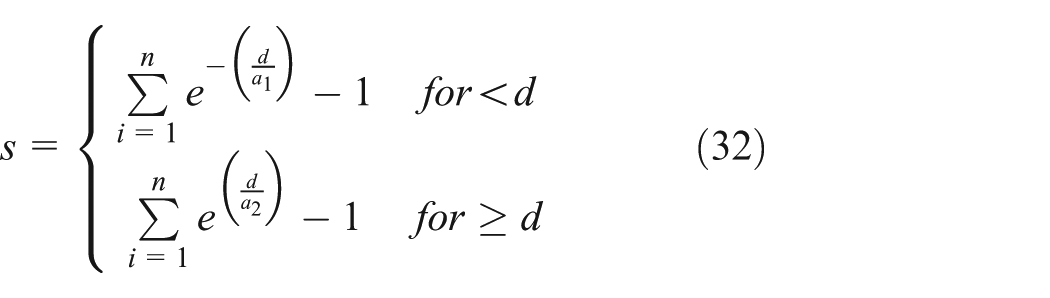
where s represents the evaluation score, n is the number of sample, and d denotes the value of predicted RUL, subtract real RUL, a1 = 10, and a2 = 13. 16
Case study
In order to demonstrate the KPCA-based degradation model of turbofan engine, we simulated the model using the data generated from the turbofan engine thermodynamic simulation. The data set is composed of engine operating data from a normal state to a failure state. Each engine is the same type and from the same factory, but the initial wear and product deviation and degradation rate may be different. Each engine works normally at the beginning, and some design fault degradation begins to appear at some time point, and then stops working when the engine breaks down. In this study, we chose 20 engine samples of operating data sets to demonstrate and simulate the RUL estimated model.
Figure 5 displays the total temperature at low pressure compressor (LPC) outlet from engine 1 to engine 5, and Figure 6 indicates the high pressure compressor (HPC) outlet temperature. The simulation result of the engine’s thermodynamic simulation for physical core speed is shown in Figure 7. We cannot see the degradation start time, and the fault appears clearly in the raw data. However, careful observation of Figures 5–7 reveals that each sample can be regarded as increasing all the time cycles. In addition, when the physical core speed increases, the temperature of HPC and LPC may increase at the same time.

The simulation result of C-MAPSS for total temperature at LPC.

The simulation result of C-MAPSS for total temperature at HPC.
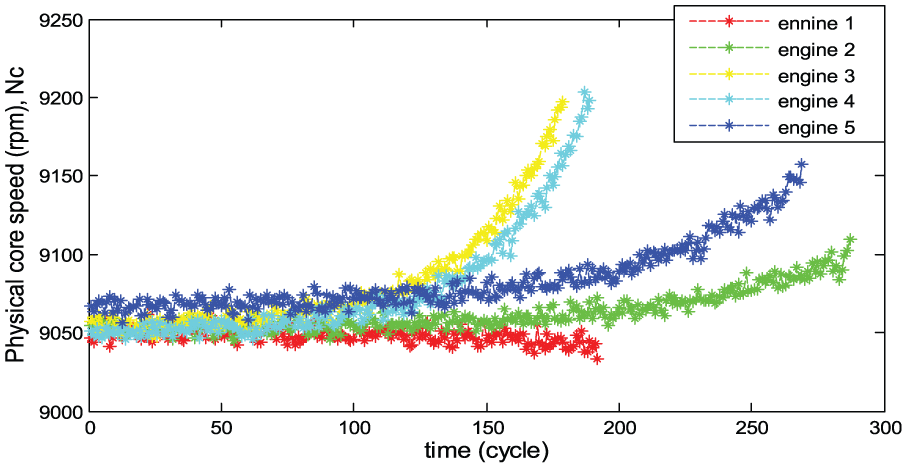
The simulation result of C-MAPSS for physical core speed.
Data processing and KPCA analysis
Table 1 lists the Contr(pk) and CPV of PCs from KPCA transformed. The number of PCs and the value of k will be determined through Table 1. Contr(pk) represents the variance contribution and CPV represents the cumulative percent variance. The CL equals 85% as threshold generally, and the CPV of p1, p2, p3 of all engines exceeds 93% in Table 1. CPV > CL is much in evidence, so the number of PCs is 3, that is to say k = 3. Figures 8 and 9 show the variation trend of KPCA-transformed feature p1, p2, p3 of engine 1 and engine 3. The PCs cannot represent the temperature or the speed, but we can see the variation trend of the whole engine system from Figures 8 and 9. It is obvious that the cyan graph and yellow graph, which are not degradation trends, are different from the red graph in these two figures. The reason they are different is because the red graph, which is p1, includes 71.44% of engine 1 gross information content and 98.05% of engine 3 gross information content in Table 1. The cyan graph and yellow graph change smoothly as p2 and p3 include little information.
The variance contribution and cumulative percent variance of PCs.


The KPCA-transformed feature p1, p2, p3 of engine 1.

The KPCA-transformed feature p1, p2, p3 of engine 3.
The parameters of health index modeling
From equation (31) we can determine that Figure 10 displays the profile log-likelihood function for b. The horizontal axis represents the value of b, and the vertical axis represents the profile likelihood function. We can obtain


The profile log-likelihood function of b.
PCs trend modeling
Through sample analysis, we get the trend model of the regression curve line that fits the data set in which p(t) is plotted in red in Figure 11. The trend model is

where a, c1, c2, d1, d2, and

The regression fitting of p(t).
To estimate parameter a, c1, c2, d1, d2, and

The confidence bounds of these coefficients are 95%.
To predict the future path line of p(t) process, we used the transformed initial data and the trend model to generate trend lines. The results of the calculations are displayed in Figure 12.

PCs trend modeling of engine 1 to engine 20.
Predicting RUL of a turbofan engine
Next, we used a health index model specified in equation (20) to predict the state of the turbofan engine. By taking the result of PCs trend modeling and comparing its value of system health index (zero as the failure threshold), we can estimate the RUL of the turbofan engine. This predicted lifetime is shown as engine 1, and its distribution is plotted in Figure 13. The horizontal axis represents use over its lifetime in Figure 13, and the crossover point of the red/blue line and horizontal axis represent real/estimated RUL.
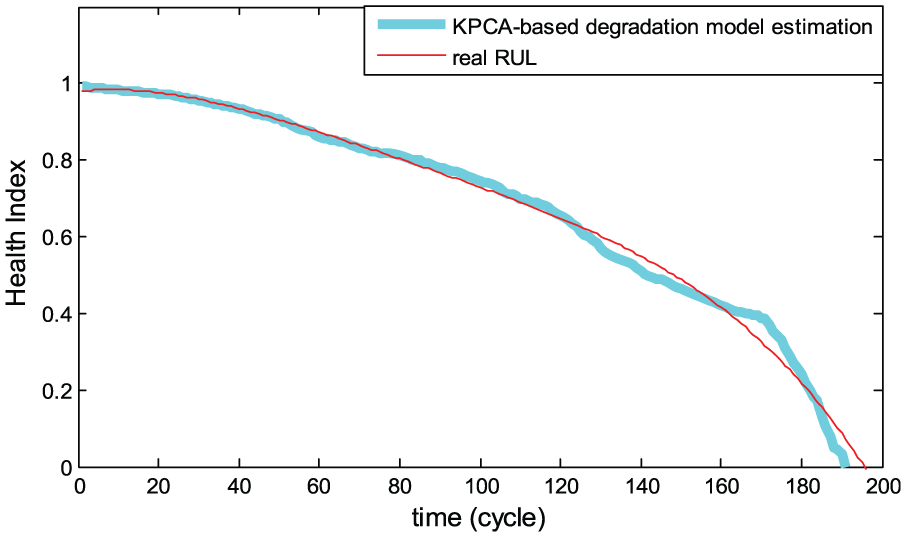
Predicted remaining useful life.
Results and discussion
The predicted result of all 20 engines is shown in Figure 14. We use a scoring function in equation (32) to calculate the error and score of prognostics results, which is listed in Table 2. The lower the score of predicted results in every engine, the better the precision will be. The precision of the method can reach to 98.9% and the average precision is 95.8%. We can see from Table 2 that the score of half of the engines are less than 2. That is to say that the predicted result is very good and the health index model is suited for the prognostics problem.
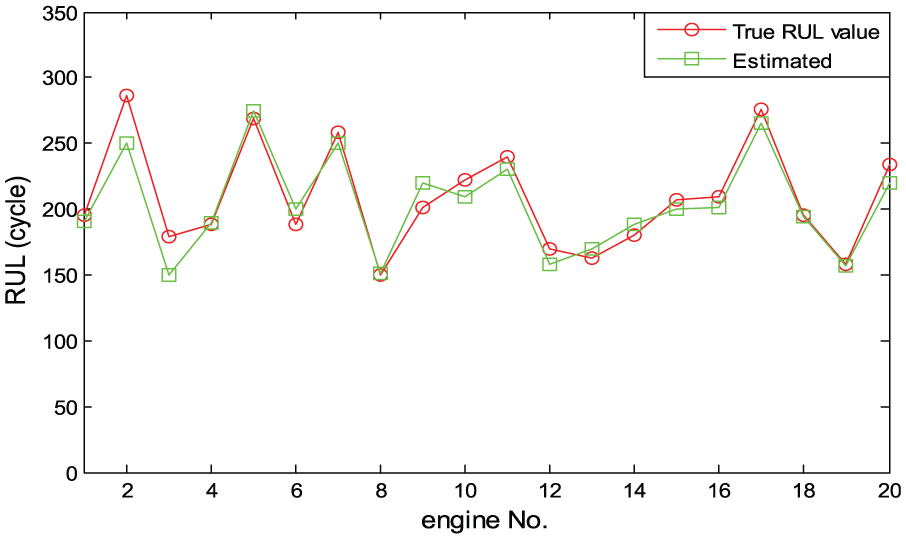
Prognostics results of the turbofan engine RUL.
The error and score of prognostics results.

With the complicated engine system and the low availability of useful data, it is hard to predict the future state of the turbofan engine with high accuracy. However, we can find a way to use all of the limited data information that predicted the RUL. As for the problem of predicting the RUL of the engine, what we have been able to estimate is the distribution of the operating life under a constant degradation failure (not a sudden failure). To achieve this objective, we used the KPCA method to reduce the dimension of raw data and establish degradation model and health index equation to estimate the lifetime.
Conclusion
This article proposes a model for estimating the RUL of the turbofan engine and provides some unique contributions to the modeling and estimation in the engine prediction field. We assume that a commonly used equation for wear is provided and connect with the performance variation of parameters that enable us to assess cumulative degradation and predict the RUL of the engine. The KPCA analysis is used as the data preprocessing for the model to reduce the dimensions of the inputs and the outputs of KPCA analysis contains more than 90% information of the original data. The MLEs method is used in estimating the unknown parameters of a degradation model. From the result of case study, this method has a high precision in RUL estimation. The proposed KPCA-based degradation model integrates both the physical model and the data-driven model, allowing it to capture the features of different types of gas turbine engines even if they have different mechanical structures. The proposed model will reduce engine maintenance costs and increase the engine service life, in that we would know when and where to perform engine maintenance. Should the model be used in industrial areas, it will ensure the estimated engine product quality value in a short time. However, this work also contains some inadequacies that should be studied in the future. For example, we assume the health index model of the engine system is a constant fault, but in fact sudden fault in the KPCA-based degradation model and environmental factors should also be considered both in the performance estimation and in the prediction problem. Further investigation might focus on considering more factors in the KPCA-based degradation model that will closer resemble the real turbofan engine system. There is also a need to demonstrate and analyze the degradation model using real engine operating data and modify the model impend over a real system.
Footnotes
Appendix 1
Acknowledgements
The authors thank the anonymous reviewers for their critical and constructive comments. The authors are grateful to reviewers of Advances in Mechanical Engineering for precious suggestions and feedback for improving this article and to the editors for their meticulous processing.
Academic Editor: Hyung Hee Cho
Declaration of conflicting interests
The author(s) declared no potential conflicts of interest with respect to the research, authorship, and/or publication of this article.
Funding
The author(s) received no financial support for the research, authorship, and/or publication of this article.