
Abstract
Based on the backgrounds of underwater propulsors with high hydrodynamic performance, the article focuses on the flapping foils in tandem arrangement and tries to formulate the physical mode and mathematical model of flapping propulsion. Using the commercial software Fluent, the governing equations are discretized by the finite volume method, and dynamic mesh method is adopted to solve the moving boundaries. In order to verify validity and feasibility of the method, hydrodynamic performance of single flapping foil is analyzed. The present results of single flapping foil compare well with those in experimental researches. After that, numerical simulations of flapping foils in tandem arrangement are conducted to reveal the energy absorption mechanisms. By extracting performance parameters and characteristics of the flow field, the interaction between upstream foil and downstream foil is analyzed. The results indicate that the vortices shedding from upstream foil have a significant effect on the hydrodynamic performance of downstream foil, and the downstream foil can use energy from the flow field to improve the hydrodynamic performance. Therefore, the hydrodynamic performance of the system can be improved by adjusting the locations of foils and motion parameters.
Keywords
Introduction
Underwater propulsors play important roles in marine exploitation. The traditional underwater propellers have the disadvantages of low efficiency, poor maneuvering performance, big noise, and other shortcomings. With the expansion of application scope, more excellent underwater propulsion mode is needed to develop. Underwater animals in nature have the extraordinary abilities to swim with high hydrodynamic performance. So, bionic propulsion has become a research focus of underwater propulsion.1,2 However, due to the lack of mechanism research, the performance of recent biomimetic propulsors is far from expectation obtained by the animals. The reason is that simple imitation of movements cannot achieve desired results and more in-depth mechanism research is needed. Therefore, to explore the hydrodynamic mechanism, scholars are spending considerable efforts to reveal the essence of the problems with different research methods.3–10 With the developments of computer and computational fluid dynamics (CFD) in recent decades, numerical simulation method has become an important tool to investigate the propulsion mechanism of bioinspired modes. 11
Fish can use energy from the flow field to improve the hydrodynamic performance. 12 So, fish often swim in queue, and some fish in queue can get extra energy due to the movements of other fish. According to the previous studies,13–18 the focus of scholars was the locomotion of the whole fish and the energy absorption mechanisms between fish. However, the analysis of some particular parts of fish is more meaningful because the partial propulsion mode can be used for reference and adopted in the existing propulsion system. The bionic foil adopted in the article is a sort of simplified model, which imitates the shapes of the caudal fins of animals. These animals, like tunas, use the common “body/caudal fin” swimming mode and have advantages of high propulsive efficiency and high speed. Besides that, experimental method was usually used in these studies. Numerical simulations were usually two-dimensional, and the simulations were conducted under low Reynolds number.19,20 The article focuses on the flapping foils in tandem arrangement and tries to formulate the physical and mathematical models to describe the kinematics. And then, numerical simulations of flapping foils propulsion in tandem arrangement are conducted. In order to verify validity of the method, a verification calculation is conducted, and then the results are compared with other researches. After that, numerical simulations of flapping foils in tandem arrangement are conducted. By extracting performance parameters and characteristics of the flow field, the interaction between upstream foil and downstream foil is analyzed.
Materials and methods
Geometric model
The geometric model adopted in the article has the same cross section as NACA0013 airfoil. Figure 1 shows cross section of the foil, where L = 0.055 m is the chord length and O is the reference point. The reference point is located 0.25 L from the leading edge and the foil can take rotational motion around the reference point. In nature, the fins or wings of animals have streamlined sections parallel to the propulsion direction. The streamlined shape has the advantage of low resistance and high efficiency. Although the shapes of animals are various, the hydrodynamic force of the foil can be viewed as the resultant force of a series of forces acting on the streamlined sections. So the analysis of flapping foils has strong universality in the research of flapping propulsion. The spanwise length of the foil is 6.5 L, and the projected area (one-sided) S is 1.966 × 10⁻² m2.
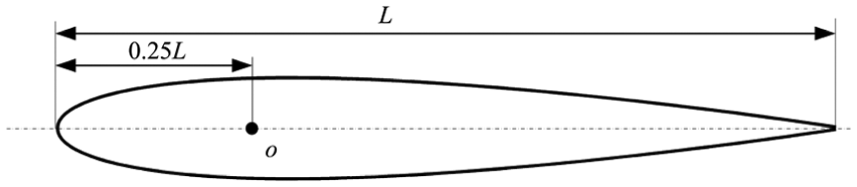
Cross section of the foil.
Motion model
In this article, the foil is allowed to take translational motion and rotational motion. Specifically, the foil is towed forward at constant speed U and set to take translational motion y(t) transversely to the towing direction and rotational motion θ(t) around a spanwise axis. The heave motion of the foil can be described by the following equation

where f is the flapping frequency, t is the time, and h is amplitude of the heave motion. In addition, the pitching angle θ is given by

where

The angle of attack α(t) is given by

where αmax is amplitude of the angle of attack. It can be seen that the angle θm describes curvature of the trajectory and the angle of attack αmax(t) is independent. The functional form of the angle of attack can be imposed, rather than that for the pitching motion. This was found to be significant for symmetrically flapping foils at high Strouhal numbers, when a sinusoidal pitch motion causes multiple peaks in the angle of attack and degradation of performance. 9 Besides that, this way of defining makes it easier to develop optimization algorithm of the angle of attack. The definitions of the motion parameter are shown in Figure 2.

Definition of variables.
In addition, the chord Reynolds number and the Strouhal number are defined by


where ν is the fluid kinematic viscosity. The chord Reynolds number and the Strouhal number are important parameters in biofluid problems. To achieve high hydrodynamic performance, the parameters should be set reasonably. For flapping foil propulsion, high-efficiency thrust production occurs in wakes with a Strouhal number in the range of 0.2 < St < 0.4. 9 Furthermore, most fishes have been shown to swim near a “universal” optimal value St = 0.3 because of the high propulsive efficiency.21–23 Therefore, St adopted in the article is 0.3. In order to estimate the hydrodynamic performance of the foil, the forces and torque are converted to dimensionless forms and should be described by
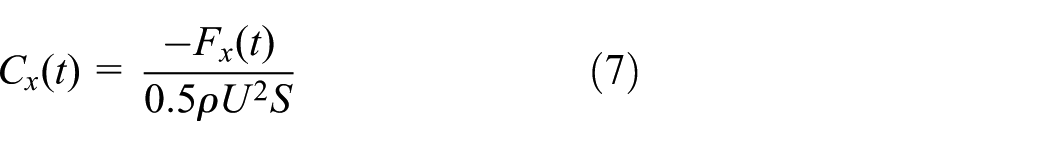


Here, ρ is the density of the fluid, Fy is the transverse force, Fx is the thrust force, Mθ is the torque, and S is the projected area of the foil. The propulsive efficiency η is defined as the ratio of output power Po to input power Pe, which can be written as


where T is the period of the motion of the foil.
Numerical method
The Navier–Stokes equations can be used to describe viscous and incompressible flows. The Navier–Stokes equations can be written as


where

Schematic representation of computational domain.
The motion parameters of the foil are selected as follows: Re = 11000, St = 0.3, h = L = 0.055 m, and αmax = 25°. The two foils are placed in tandem arrangement and phase difference is defined between the motions. Numerical simulations of a single foil are conducted to verify the accuracy of the basic method. In the simulations, the foil moves according to the motion equations and performance parameters are extracted. Figure 4 shows the time histories of the force coefficients and torque coefficient of the single foil. It is shown that the force coefficients and torque coefficient settle to a periodic behavior. Note that there are two peaks in a period which are caused by the motions of downstroke and upstroke, respectively. Furthermore, the mean Cx is 0.58, the mean Cy is 0.0065, and the thrust efficiency is about 47.0%. As is shown in Izraelevitz and Triantafyllou, 9 the mean Cx is 0.604, the mean Cy is 0.0082, and the thrust efficiency is about 49.1%. The numerical results achieved by the method compare well with those in experimental researches. So the basic method adopted in the article is reliable.

Force and torque coefficients of single foil.
Results
Influence of the phase difference
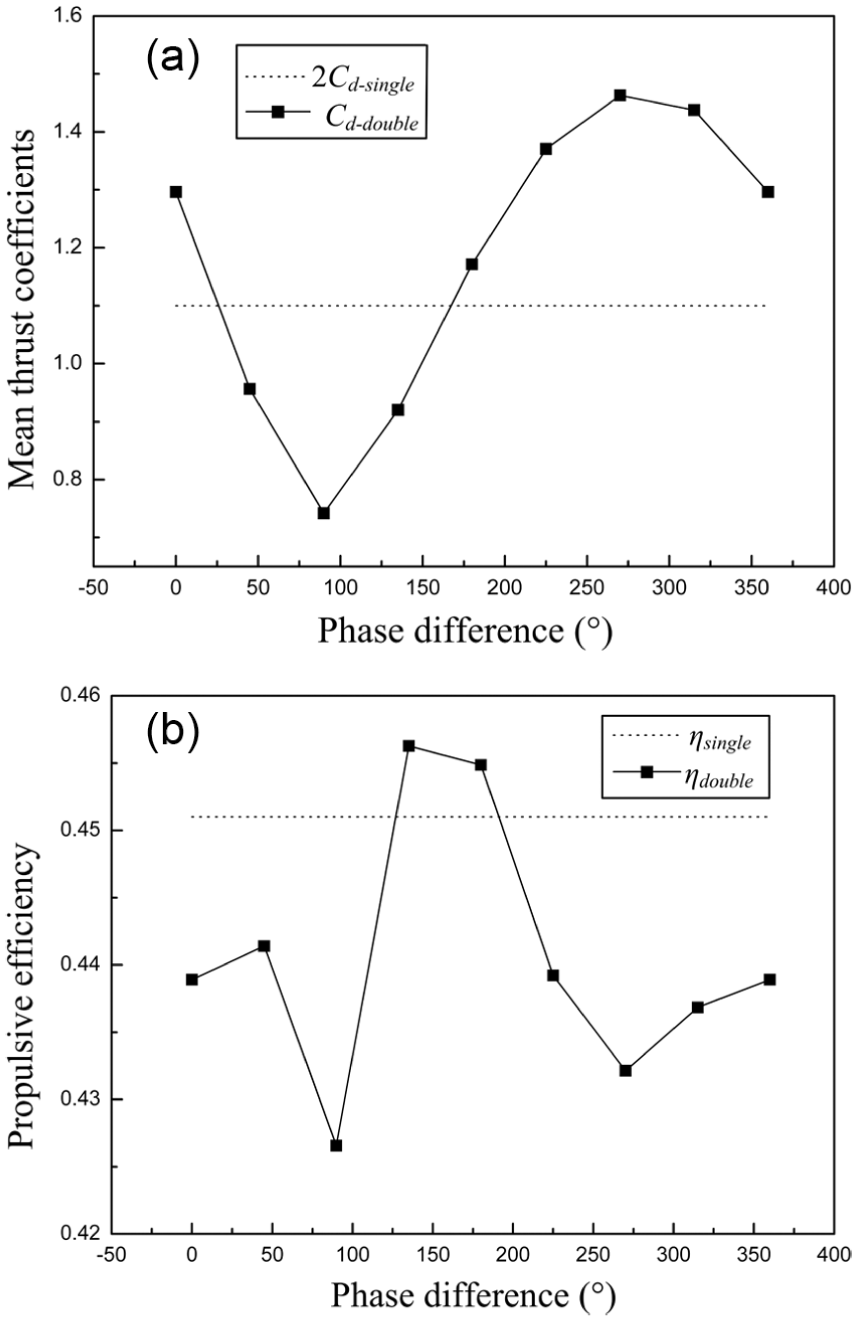
The performance curves versus phase difference between the foils are shown in Figure 5. The distance between the foils, G, is chosen to 3.0 L. It can be seen that the motion of the upstream foil has significant influence to the hydrodynamic performance of the downstream foil. The hydrodynamic performance of the system not only is the simple sum of data but also changes correspondingly with the variation of phase difference. Note that the total thrust force achieves the maximum value at γ = 0° and the minimum value at γ = 180°. Besides that, the total thrust force of the two foils in tandem is larger than twice the value of single foil. So energy absorption exists in the system. In other words, the motions of the two foils lead to energy absorption and performance enhancement of the system. The values of propulsive efficiency keep a relatively high value and achieve the minimum at γ = 180°. This tandem arrangement increases the thrust force of the downstream foil and increases the lateral force correspondingly. So the change of propulsive efficiency of the system is not obvious.

Performance curves with G = 3.0 L: (a) mean thrust coefficient and (b) propulsive efficiency.
With the phase difference equals 0°, Figure 6 shows the vortex structure in the wake. Vortex structures are depicted by the Q-criterion. It is shown that three-dimensional vortex ring exists in the wake, and the downstream foil is located in the wake of the upstream foil. The vortex ring behind the two foils has a continuous structure. The vortex ring consists of a train of inverted hairpin-like vortices braided together such that the legs of each vortex are attached to the head of the preceding vortex. The vortex structure is similar to those found in nature and simulated in other studies.24–26 In addition, the vortex structures shedding from the two foils interact strongly. This interaction is more significant near the foils. The vortex structure far away from the foils has more regular shapes. Figure 7 shows the vortex structure viewed from z-axis with γ = 0° and γ = 180°. It is shown that the vortex ring has more regular shapes with the phase difference equals 0°.
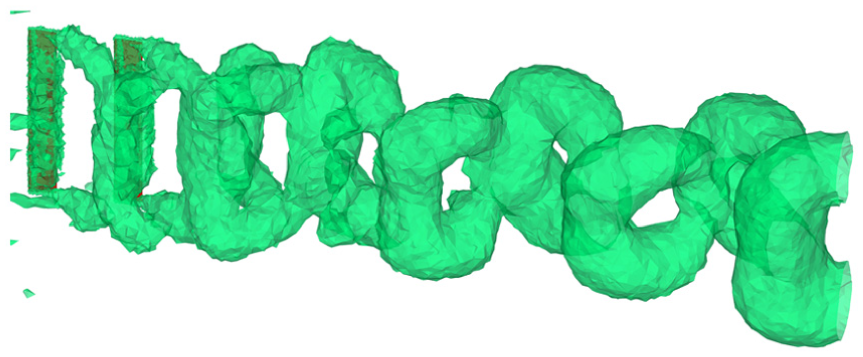
Vortex structure in the wake.

Vortex structure viewed from z-axis with G = 3.0 L: (a) γ = 0° and (b) γ = 180°.
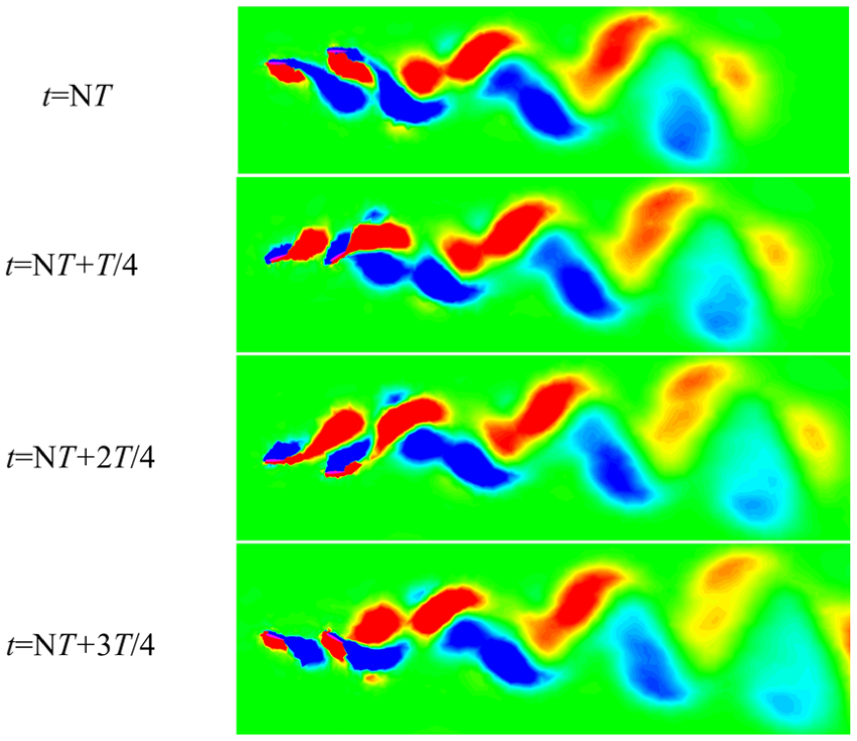
Furthermore, Figure 8 shows the two-dimensional vorticity magnitude in a motion period. It is shown that the vortices in the wake range two ranks, and the vortices have different directions of rotation in different ranks. Jet flow can be induced among the vortices and the foils can get reacting force correspondingly. The vortices shedding from the upstream foil beat the downstream foil and interact with the vortices shedding from the downstream foil. With the phase difference equals 0°, the vortices with same rotation directions shedding from the two foils merge together and the vortex structure in the wake is stretched. As a result, the energy in the wake is extracted by the downstream foil and the thrust force of the downstream foil is enhanced significantly. Conversely, as is shown in Figure 8(b), the vortices with different rotation directions shedding from the two foils merge together and the energy is dissipated in the wake. The vorticity magnitude far away from the foils is small, and the arrangement of vortices is more isolated. As a result, the hydrodynamic performance of the downstream foil decreases significantly, thus decreasing the hydrodynamic performance of the system. Through changing the phase difference, different interaction modes of the vortices can be achieved, respectively.

Vorticity magnitude with G = 3.0 L: (a) γ = 0° and (b) γ = 180°.
Influence of the distance
To analyze the influence of the distance between the foils, numerical simulations with different distances are conducted and the phase difference keeps 0°. With the phase difference equals 0°, the hydrodynamic performance is enhanced significantly under G = 3.0 L. Here, the distance between the foils is chosen to 1.5 L and 4.5 L. The performance curves are shown in Figures 9 and 10. The results are similar to those with G = 3.0 L. Note that the maximum and minimum of the thrust force occur at different values of phase difference. The minimum of the propulsive efficiency occurs at the value when the thrust force achieves the minimum. The reason is that the relative position of vortices shedding from different foils changes as the distance between the foils changes. Through changing the distance, the vortices shedding from different foils can interact in different modes.
Performance curves with G = 1.5 L: (a) mean thrust coefficient and (b) propulsive efficiency.

Performance curves with G = 4.5 L: (a) mean thrust coefficient and (b) propulsive efficiency.
Figure 11 shows the two-dimensional vorticity magnitude in a motion period with G = 4.5 L. It can be seen that the interaction mode of vortices is different with different distances between the foils. This is the reason for the differences of performance parameters. The results are similar to those with G = 1.5 L. In conclusion, through changing the phase difference or distance between the foils, the hydrodynamic performance can be improved significantly.

Vorticity magnitude with G = 4.5 L: (a) γ = 90° and (b) γ = 270°.
Influence of the motion parameters of downstream foil
According to the analysis above, the hydrodynamic performance of the system is mainly affected by the downstream foil. Therefore, the motion parameters of the downstream foil play important roles in the energy absorption. In nature, fish in the wake of others usually adjust the motion parameters to reduce energy consumption and make the most of energy in the flow field. Therefore, to analyze the influence of the motion parameters of downstream foil, angle of attack and amplitude of the heave motion are chosen to vary. The phase difference keeps 0° and the distance keeps 3.0 L. In this case, the interaction mode of vortices shedding from the two foils contributes to the enhancement of hydrodynamic performance of the system.
The performance curves versus angle of attack are shown in Figure 12. As amplitude of the angle of attack increases, the mean thrust force increases correspondingly and reaches the peak point, and then starts to decrease. The mean thrust force achieves peak point between αmax = 20° and αmax = 30°. Besides that, it is found that the propulsive efficiency has similar trend compared with mean thrust force. The propulsive efficiency achieves peak point between αmax = 10° and αmax = 20°. As is shown in Figure 13, the interaction of vortices is irregular when amplitude of the angle of attack equals 40°. In addition, Figure 14 shows the vortex structure with αmax = 40°. It is shown that the vortex ring has more irregular shapes with αmax = 40°, which results in larger energy dissipation in the wake.

Performance curves: (a) mean thrust coefficient and (b) propulsive efficiency.

Vorticity magnitude with αmax = 40°.

Vortex structure viewed from z-axis with αmax = 40°.
In order to analyze the influences of amplitude of the heave motion, the amplitude h is chosen to vary from 0.6 L to 1.6 L. The performance curves versus amplitude of the heave motion are shown in Figure 15. Here, the Strouhal number is chosen to vary and the motion frequency remains unchanged. So the motions of the two foils can keep synchronized. It can be seen that larger heave motion leads to larger thrust force. The propulsive efficiency keeps a relatively large value when the amplitude of the heave motion is larger than 1.0 L. As is shown in Figure 16, the interaction of vortices is obvious. In addition, Figure 17 shows the vortex structure in the wake with h = 1.6 L. It is shown that the distance between the vortices ranks is larger when h = 1.6 L and the volume of the vortex structure is bigger, which enhance the thrust force.

Performance curves: (a) mean thrust coefficient and (b) propulsive efficiency.
Vorticity magnitude with h = 1.6 L.

Vortex structure viewed from z-axis with h = 1.6 L.
Conclusion
In the article, numerical simulations of flapping foils in tandem arrangement are conducted. To verify the accuracy of the basic algorithm, numerical simulations of single flapping foil are conducted. The present results compare well with those in experimental researches. So the method adopted in the article is reliable. After that, the influences of phase difference, distance between the foils, and motion parameters of the downstream foil are analyzed. The results show that the interactions of vortices shedding from different foils result in the change of hydrodynamic performance. The foil system can achieve high hydrodynamic performance by adjusting the relative location of vortices. Besides that, the performance of the system can also be improved by adjusting the motion parameters of the downstream foil. The numerical results of this article would provide theoretical reference for the design of underwater propulsors based on flapping propulsion.
Footnotes
Academic Editor: Junwu Wang
Declaration of conflicting interests
The author(s) declared no potential conflicts of interest with respect to the research, authorship, and/or publication of this article.
Funding
The author(s) disclosed receipt of the following financial support for the research, authorship, and/or publication of this article: The research has been financially supported by the National Natural Science Foundation of China (no. 50905040) and State Key Laboratory of Robotics and System (HIT no. SKLRS200801C).