
Abstract
Aircraft ground deicing plays an important role of guaranteeing the aircraft safety. In practice, most airports generally use as many deicing fluids as possible to remove the ice, which causes the waste of the deicing fluids and the pollution of the environment. Therefore, the model of aircraft ground deicing should be built to establish the foundation for the subsequent research, such as the optimization of the deicing fluid consumption. In this article, the heat balance of the deicing process is depicted, and the dynamic model of the deicing process is provided based on the analysis of the deicing mechanism. In the dynamic model, the surface temperature of the deicing fluids and the ice thickness are regarded as the state parameters, while the fluid flow rate, the initial temperature, and the injection time of the deicing fluids are treated as control parameters. Ignoring the heat exchange between the deicing fluids and the environment, the simplified model is obtained. The rationality of the simplified model is verified by the numerical simulation and the impacts of the flow rate, the initial temperature and the injection time on the deicing process are investigated. To verify the model, the semi-physical experiment system is established, consisting of the low-constant temperature test chamber, the ice simulation system, the deicing fluid heating and spraying system, the simulated wing, the test sensors, and the computer measure and control system. The actual test data verify the validity of the dynamic model and the accuracy of the simulation analysis.
Introduction
Aircraft ground ice refers to the verglas, ice, snow, and frost accumulated on the surface when aircrafts are on the ground, which might change the aerodynamic configuration of the aircraft, reduce the lift force, and damage the airframe components. Therefore, it brings the hidden danger to air safety. Moreover, the winter flight safety is greatly influenced by aircraft ground ice. According to statistics, there have been approximately 20 accidents caused by aircraft ground ice in the past 30 years. Some typical accidents include Baotou air crash in 2004 and Colorado air crash in 1987 (Figure 1).1,2 Besides, aircraft ground ice is the direct cause of the flight delay, cancelation, and the airport closure in winter, which can cause enormous economic losses as well as have a strong impact on the public transportation.
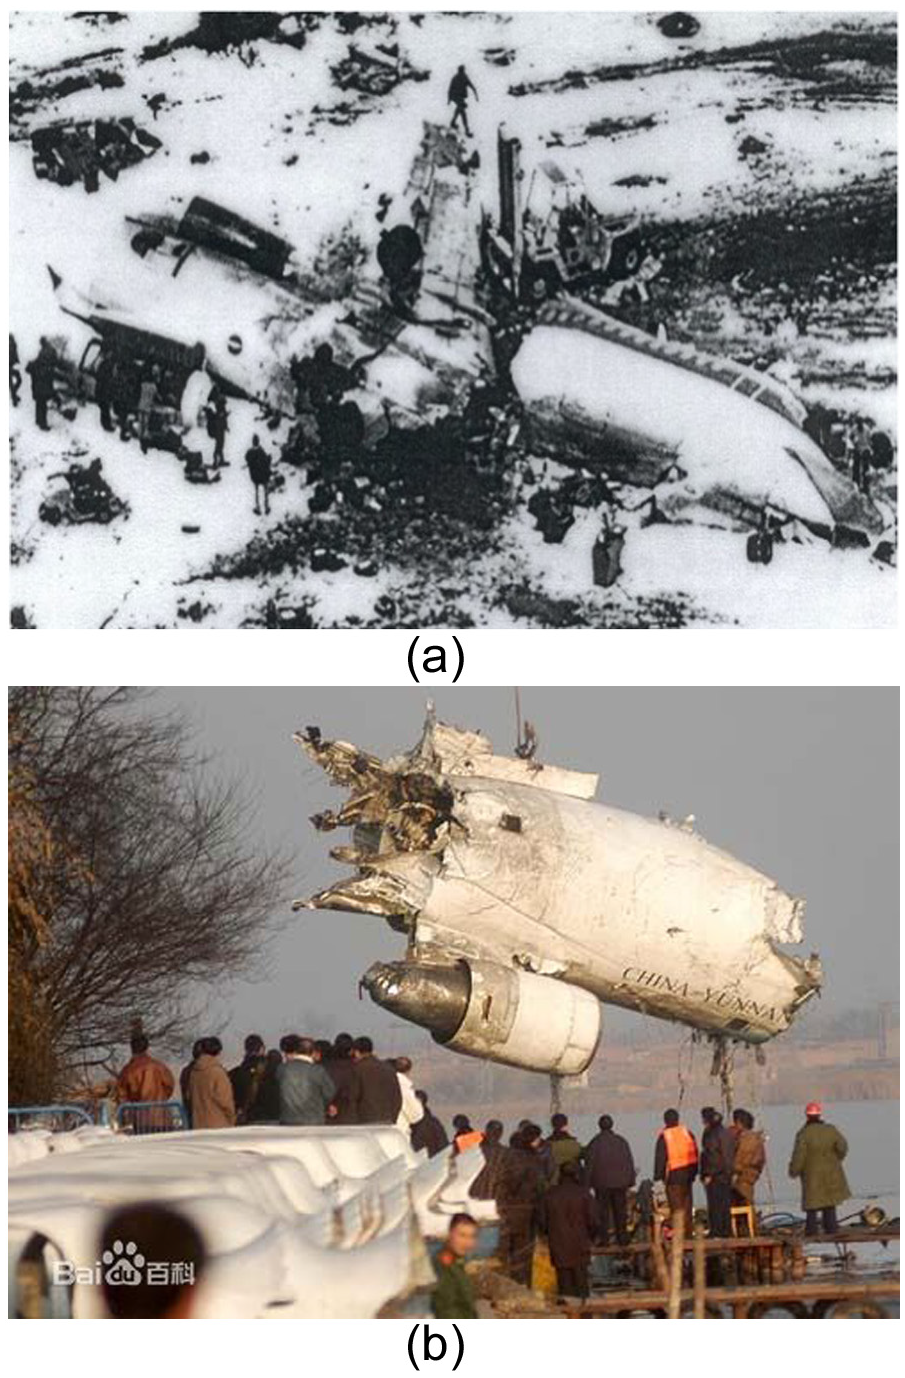
Typical accidents caused by aircraft ground ice: (a) Colorado air crash site and (b) Baotou air crash site.
Aircraft ground deicing or anti-icing has been an important problem drawing great attention of international civil aviation departments. Federal Aviation Administration (FAA), European Aviation Safety Agency (EASA), and Civil Aviation Administration of China (CAAC) have stringent regulations on the operation of the aircraft whose surface is attached by the ice.3,4 How to deice safely and efficiently is one of the most crucial issues in the civil aviation field. Meanwhile, interrelated techniques and theories have also received a great deal of attentions.
There are many kinds of advanced and potential aircraft deicing methods emerging, the typical of which include infrared aircraft deicing, 5 microwave deicing, 6 and hot air deicing.7,8 But when it comes to aircraft ground deicing or anti-icing, the aircraft deicing fluids are mainly adopted: the specific deicing facilities or systems are utilized to spray the deicing fluids to the surface of aircraft at the appointed time. Then, the deicing fluids guarantee that the ice on the surface melts and prohibit the aircraft from icing up within a certain period of time, ensuring the safety of taking off.
Concerning the aircraft deicing fluids, the investigation mainly involves deicing mechanism, deicing model, deicing efficiency, deicing parameter optimization, deicing multiparameter control characteristic method, deicing operation optimal dispatch, and so on. Previous studies on deicing model and deicing parameter optimization are explained as follows.
SE Ornitz 9 studied the dependence relation between the deicing fluid concentration, the ambient temperature, the wind velocity, and the deicing fluid holding period. The optimization model that the deicing fluid concentration varied with the environment was also built. The mixed integer nonlinear programming (MINP) was adopted to carry out online intelligent optimization of the amount that the deicing fluids were used, overcoming the uncertain problems caused by the aircraft model, temperature, and facilities during the process of deicing.
The research workers of APS Aviation, Inc. 10 made an experimental study on the routine and the technique of using deicing or anti-icing fluids. The deicing parameters were also optimized to reduce the environmental pollution caused by the deicing fluids. Through the experimental research at the airport, the deicing fluid holding periods at different fluid concentrations were verified. In the case that the deicing fluids were used to clear the frost with centralized deicing technologies, the impacts of the parameters such as deicing fluid temperature and concentration on the amount of deicing fluids used were also studied through the test.
A Zouzou et al. 11 considered the change in deicing fluid holding periods as the variation of the temperature. The model that deicing fluid holding periods varied with the temperature was built. The numerical simulation method was adopted to describe the relationship between the deicing fluid holding period and the temperature, the result of which was compared with the deicing fluid holding period at constant temperature. Besides, the model took into account the effect of some parameters such as the flow rate of deicing fluids, the deicing fluid concentration, the shear rate, the ice thickness, and the surface angle of the attachment to the ice.
However, these works mainly focused on the properties of the deicing fluids, such as the concentration and the holding period. Unfortunately, to the best of our knowledge, there is no adequate research on the deicing process. 12 The study results provide basic operating rules and technical standards for the deicing fluid producers. However, from the perspective of consumers, there has been little investigation on the cost, the equipment parameters, and the deicing efficiency. A small number of previous studies determine the parameters based on the experiments and the project experience, which are complicated for the operation and do not consider the cost and the deicing efficiency. From the green and environment-friendly point, the waste and the pollution of the deicing fluids should be taken into consideration. Therefore, this article establishes the model to study the impacts of the equipment parameters on the deicing process, which provides the basis for the parameter optimization.
In contrast to most of the available results, this article investigates the mechanism and the physical model of the deicing process. The main contributions of this article lie in the following: the dynamic model of the deicing process is depicted as a system of differential equations, and the model is further simplified under the reasonable assumption that the heat exchange between the deicing fluids and the ambient environment is ignored. The fluid flow rate, the temperature, and the injection time are treated as control parameters, while the surface temperature of the deicing fluids and the thickness of the ice are state parameters in the dynamic model. In addition, the simplified model and the original model are all verified through the comparison of the numerical simulation13–15 data and the semi-physical experiment data. Moreover, the equilibrium temperature is proposed for the first time, which suggests that there exists a constant temperature stage during the deicing process. Therefore, the effects of the parameters such as the fluid flow rate, the temperature, and the injection time on the deicing process are investigated through the simulation and the test. Both the flow rate and the initial temperature can change the rate and the volume of the ice melting by changing the equilibrium temperature, while the injection time can affect the volume of the ice melting by changing the duration of the equilibrium temperature but has no effect on the ice melting rate.
This article is organized as follows: we introduce the deicing mechanism of the deicing fluids in section “Mechanism of aircraft ground deicing.” In section “Dynamic model of the deicing process,” the dynamic model of the deicing process is investigated, and the simplified model is derived. Section “Numerical simulation” is devoted to verifying the model and analyzing the effect of the parameters such as the fluid flow rate, the temperature, and the injection time on the deicing process through the numerical simulation. In section “Experimental studies,” the semi-physical experiment system is built, and the experiments are carried out under different parameters to verify the dynamic model and the correctness of the numerical simulation.
Mechanism of aircraft ground deicing
In the aircraft ground deicing process, the deicing fluids, heated to a specific temperature, are sprayed on the ice-forming parts of the aircraft surface when some certain conditions are satisfied such as the requirements of the flow rate and the nozzle moving speed. 16 Deicing fluids spread out quickly on the aircraft surface, forming a slow-moving and high-temperature liquid film. The ice, snow, and frost melt depending on the heat carried by the liquid film. Due to the properties of deicing fluids such as the high viscosity and the low freezing point, the freezing point of the ice liquid mixture is decreased in a certain period of time. Meanwhile, the melting ice, snow, frost, and the redundant deicing fluids flow to the ground. In terms of aircraft ground deicing, airfoil ground deicing is the most common; so, this article regards airfoil ground deicing as the main research object.
The airfoil ground deicing process
17
is depicted in Figure 2, and the abstract model is shown in Figure 2(c). As shown in Figure 2(c), the rectangle represents the equivalent airfoil, L is the width of the airfoil, W expresses the length of the airfoil, and V is the nozzle moving speed of the deicing facilities. The deicing time which is equal to the moving time of the nozzle along the direction of the length of the airfoil is expressed as

Aircraft ground deicing process: (a) panorama of aircraft ground deicing, (b) scene of airfoil ground deicing, and (c) abstract model.
The airfoil ground deicing process is a typical liquid–solid transition process. It is also a quintessential process of heat transfer and conservation. The deicing fluids, ice, and aircraft wing constitute a thermodynamic system. The internal energy of the system changes only through the heat transfer. The increment or decrement of the system internal energy is equal to the amount of the heat absorbed from or released to the outside.
If the impacts of the wind speed, the vaporization heat, and the exchange of other energy between the system and the environment are all ignored,18,19 the heat transfer in the aircraft ground deicing process is depicted in Figure 3.20,21 As shown in Figure 3,

Heat transfer in the aircraft ground deicing process.
In order to make it easy to model and analyze, the whole process of deicing is divided into two stages. The first stage is the ice melting stage, where the heat of the deicing fluids makes the ice melt and flow off the wing, and this stage is a stage of heat transfer and a process of phase transition. In the first stage, the thickness of the ice tends to thin until the thickness is zero. The substance on the surface of the wing is the mixture of ice, deicing fluids, and water. The second stage is the ice inhibiting stage, where the temperature of the wing material increases and the anti-icing heat is transferred. Compared with the first stage, the second stage does not involve the process of ice melting and phase transition. Also, the first stage mainly depends on the flow rate, temperature, and injection time of the deicing fluids, while the second stage mainly depends on the properties of the deicing fluids, such as the concentration and the holding period. This article mainly discusses the ice melting stage and makes modeling study for it.
Dynamic model of the deicing process
Heat balance analysis
The input energy of the thermodynamic system is the heat released from the deicing fluids with the drop in temperature. The input energy depends on the flow rate, the temperature, and the injection time of the deicing fluids,22,23 which is expressed as

where

where
The consumed energy of the thermodynamic system mainly consists of the convection between the liquid film and the environment, the thermal radiation to the environment, and the ice melting heat. The convection between the liquid film and the environment can be expressed as

where
For the temperature difference between the deicing fluids and the surroundings, deicing fluids release some heat to the environment in the form of radiation. The radiation capacity positively correlated with the temperature of the deicing fluids. The radiation energy is expressed as

where
Ice melting on the surface of the wing is a complex process, which can be divided into two stages. The first stage is the temperature increasing stage where the temperature of the ice increases from ambient temperature to the melting point. After the temperature of the ice increases to the melting point, the process enters the second stage. The second stage is the ice melting stage. To simplify the study, the assumption is made that the temperature of the ice on the surface of the wing is equal to that of the environment. On this basis, the energy consumed in the temperature increasing stage is
where H is the thickness of the melting ice,
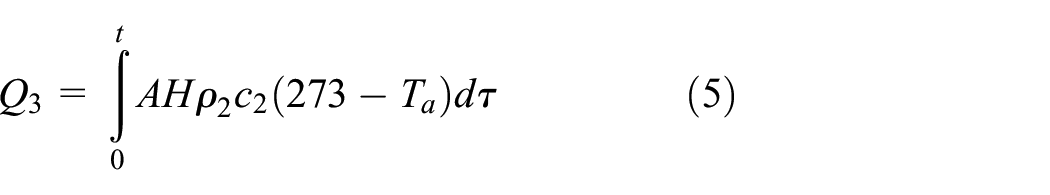
In the ice melting stage, the heat required to melt the ice at 0°C to the water at 0°C is

where
The liquid film is attached to the surface of the wing, and the bottom of the film is directly in contact with the wing. In the ice melting process, the temperature of the bottom of the liquid film is the temperature of the ice. Therefore, there is a temperature difference between the top and the bottom of the liquid film. The heat transferred between the top and the bottom of the liquid film can be obtained on the basis of the definition of the heat conduction, which is expressed as

where
In the ice melting stage, the assumptions are as follows. The kinetic energy of the deicing fluids and the mass loss due to evaporation of the deicing fluids are ignored, and the effect of the collision of the deicing fluids with the ice is also ignored. Besides, the deicing fluids on the surface of the wing are hypothetical in the steady laminar conditions. According to the conservation of energy, the total energy of the thermodynamic system can be formulated as equation (8)

Equation (8) shows that the partial energy of the deicing fluids is consumed in the ambient environment, while other energy is consumed as the heat required to increase the temperature of the ice and melt the ice. Based on the heat transfer in the ice melting process, the ice melting heat derives from the heat transferred between the top and the bottom of the liquid film, which can be formulated as equation (9)

Substituting equation (9) into equation (8), equation (10) is obtained

Dynamic modeling
Many parameters are involved in the process of aircraft ground deicing, such as the wind speed, the environment temperature, the air humidity, and the amount of the ice on the wing. These parameters are nonlinear and changeable.
28
To study the dynamic changes of the ice in the deicing process, the fluid flow rate
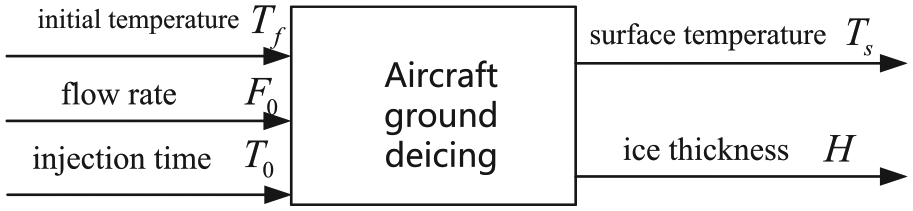
Dynamic deicing model.
After substituting equations (3)–(7) into equation (9) and differentiating the obtained equation with respect to the time, the dynamic relationship between the ice thickness H and the surface temperature of the deicing fluids

where the minus means that the ice thickness tends to decrease if
After substituting equations (2)–(4) into equation (10) and differentiating the obtained equation with respect to the time, the dynamical change in the surface temperature of the deicing fluids

In the derivation process of equation (12), the differential form of the heat released from the deicing fluids is formulated as equation (13)

Equations (11) and (12) are the nonlinear differential equations depicting the dynamic changes in the ice thickness H and the surface temperature of the deicing fluids
In the above model, the initial value of the surface temperature of the deicing fluids

Equation (14) shows that the equilibrium temperature

Model simplifying
If the radiation energy from the surface of the wing to the environment and the convection between the liquid film and the environment are ignored, which means

In the following simulation study, the rationality of ignoring
On the basis of the simplified model, the explicit expression of the equilibrium temperature is formulated as equation (17)

where
Numerical simulation
Simplified model verifying
In order to accomplish the simulation analysis of the dynamic model, MATLAB or Simulink is adopted to solve the system of nonlinear differential equations through the numerical calculation. The simulation parameters are listed in Table 1. The parameters are set based on practical system and are in conformity with the basic parameters of the semi-physical experiment system. The coefficient of energy convection
Simulation parameters.

In the case that the flow rate is 1.0 L/min, the initial temperature of the deicing fluids is 60°C and the injection time is 40 s, the dynamic simulation curve of the deicing process is shown in Figure 5. As is shown by the dynamic change curve of the surface temperature of the deicing fluids

Dynamic simulation curves: (a) surface temperature change curves and (b) melting thickness change curves.
In order to verify the validity of the simplified model through the comparison, the dynamic change curve of the simplified model is also depicted in Figure 5. It is observed that the curve of the simplified model is almost coincided with that of the original model. Because the radiation energy from the surface of the wing to the environment and the convection between the liquid film and the environment are ignored, the equilibrium temperature falls by 0.15°C, and the melting thickness decreases by 0.025 mm. But the error caused by the simplification is negligible for the whole deicing process.
The energy consumed in the deicing process mainly consists of the convection energy
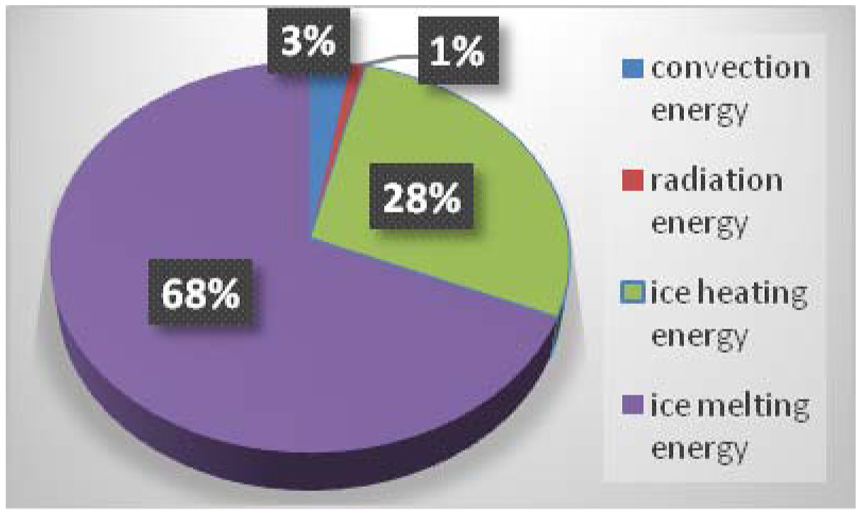
Proportion of each part of the total energy consumed.
Impacts of parameters on the deicing process
The input parameters are the fluid flow rate
The initial temperature of the deicing fluids is 50°C, 60°C, 70°C, and 80°C, respectively. The flow rate is fixed to 1.0 L/min, and the injection time is 40 s. The simulation curves of the deicing process under different initial temperature conditions are depicted in Figure 7. As shown in Figure 7, the equilibrium temperature increases with the increasing initial temperature of the deicing fluids. Meanwhile, the change rate of the ice thickness in the heat balance stage and the total melting thickness also increase with the increase in the initial temperature. This indicates that the rate and the volume of the ice melting can be effectively increased by increasing the initial temperature of the deicing fluids.

Simulation curves under different initial temperatures: (a) surface temperature change curves and (b) melting thickness change curves.
The flow rate of the deicing fluids is 0.8, 1.0, 1.2, and 1.4 L/min, respectively. The initial temperature of the deicing fluids is 60°C, and the injection time is 40 s. The simulation curves of the deicing process under different flow rate conditions are depicted in Figure 8. As shown in Figure 8, the equilibrium temperature increases with the improved flow rate of the deicing fluids. Meanwhile, the change rate of the ice thickness in the heat balance stage and the total melting thickness also increase with the increase in the flow rate. This indicates that increasing the flow rate of the deicing fluids can obtain the same control effect as increasing the initial temperature of the deicing fluids.

Simulation curves under different flow rates: (a) surface temperature change curves and (b) melting thickness change curves.
The injection time is 20, 30, 40, and 50 s, respectively. The flow rate of the deicing fluids is 1.0 L/min, and the initial temperature of the deicing fluids is 60°C. The simulation curves of the deicing process under different injection time conditions are depicted in Figure 9. As shown in Figure 9, the equilibrium temperature remains unchanged with the increasing injection time, and the change rate of the ice thickness in the heat balance stage also remains the same. But the duration of the heat balance stage increases linearly, resulting in the increase in the total melting thickness. This indicates that increasing the injection time cannot change the equilibrium temperature. It can only increase the total volume of the ice melting by changing the duration of the heat balance stage.

Simulation curves under different injection time conditions: (a) surface temperature change curves and (b) melting thickness change curves.
The above simulation analysis shows that the flow rate, the initial temperature, and the injection time of the deicing fluids have significant impacts on the deicing process. The flow rate and the initial temperature almost have the same effect, both of which can change the rate and the volume of the ice melting by changing the equilibrium temperature. The injection time can change the duration of the equilibrium temperature stage. But it cannot change the value of the equilibrium temperature while it can only affect the volume of the ice melting and has no effect on the rate.
Experimental studies
Semi-physical experiment system
To verify the accuracy of the above dynamic model and the match between the model and the actual process of ice melting, the semi-physical experiment system is established (Figure 10). The semi-physical experiment system consists of the low-constant temperature test chamber, the ice simulation system, the deicing fluid heating and spraying system, the simulated wing, the test sensors, and the computer measure and control system.

Semi-physical experiment system.
The low-constant temperature test chamber is shown in Figure 11, which is used to simulate different experimental environments under the different climatic conditions. The simulated temperature ranges from −40°C to 100°C. The simulated humidity ranges from 30% to 98% relative humidity (RH). The cooling power is 1100 W, and the capacity of the test chamber is

Low-constant temperature test chamber.
The deicing fluid heating and spraying system is shown in Figure 12, consisting of the heating cabinet, the pump, the nozzle, the electric valve, and the flow meter. The device can make accurate control of the temperature, the flow rate, and the injection time of the deicing fluids. The deicing fluids are heated to the designed temperature, the highest of which is 84°C, and the error is <2%. The electric valve is used to adjust the flow rate and the injection time of the deicing fluids. The flow rate is adjusted to range from 0 to 100 L/min, and the flow meter is installed between the nozzle and the electric valve, which is used to measure the actual flow rate of the deicing fluids.
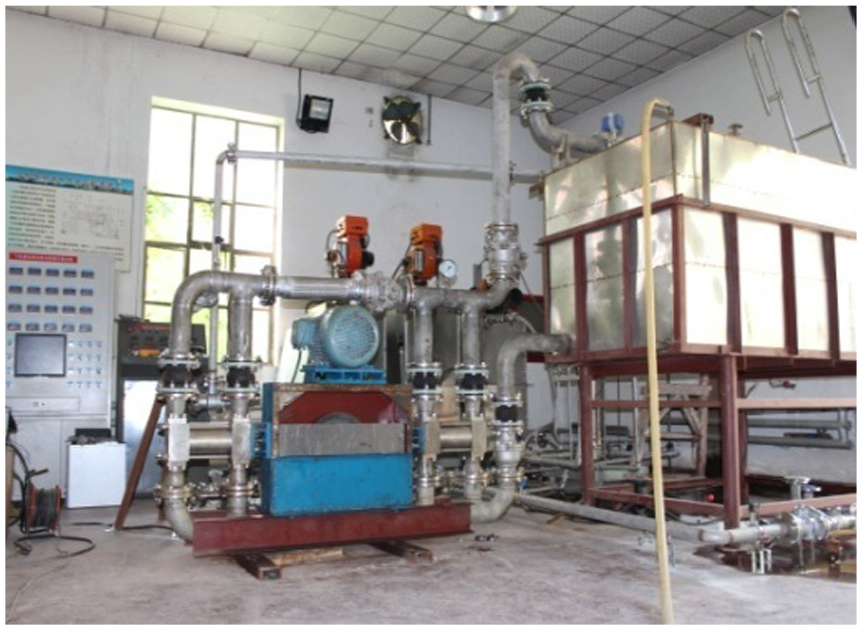
Heating and spraying system.
The 7075 aviation aluminum plate is used to simulate the wing skin, the size of which is 600 mm × 600 mm× 2 mm. There are two fiber-optic sensors and several thermocouple temperature sensors embedded in the aluminum plate, which are shown in Figure 13. The simulated wing is placed in the low-constant temperature test chamber, keeping an angle of 5° to simulate the angle of the wing when the aircraft is on the ground. Prior to the experiment, the surface of the aluminum plate is polished to be even, bright, and smooth, guaranteeing that there is no dirt attached to the surface. There are infrared temperature sensors installed above the aluminum plate, which are used to measure the surface temperature of the deicing fluids sprayed on the ice.

Sensors embedded in the aluminum plate.
The fiber-optic icing sensor is a kind of nonfunction-type fiber-optic sensor. The basic operation principle is as follows: The light source emits the light. Then, the light is transmitted by the fiber optic and reaches the detection surface. If there is not any ice on the detection surface, the light will emit into the air, and the fiber receiving side will not detect any emitted light. In contrast, if there is ice on the detection surface, the light will do a series of optical actions such as reflection, scattering, transmission, and absorption in the ice. The light scatters in the ice and reflects on the interface of the ice and the air. Finally, the light will enter into the receiving fiber. The process is shown in Figure 14. The end of the receiving fiber is connected with the phototriode and signal processing circuit, which are utilized to detect and receive the intensity and the change in the optical signal to measure the state of the ice. The coaxial fiber-optic sensor and the wedgy fiber-optic sensor are adopted to measure the ice thickness. The accuracy of the measurement is improved through the data fusion.

Fiber-optic icing detection process.
The computer measure and control system consists of industrial personal computer (IPC), signal conditioning module, data acquisition card, and charge coupled device (CCD). The system is used to set test parameters of the deicing fluids and collect signals of different sensors. It also achieves the real-time display, calculation, processing, storage, and printing of the experimental data. The data display and processing application interface compiled with Visual Studio C# is shown in Figure 15. Installed in the low-constant temperature test chamber, the CCD is used to collect and transmit video images to the computer in order to remotely monitor the experimental process.

Data display and processing application interface.
Dynamic deicing model verifying
In order to verify the dynamic deicing model and the correctness of the simulation analysis, the parameters of the semi-physical experiment system are basically in conformity with the simulation parameters. The experimental data are compared with the simulation data under the same condition. The deicing fluids are heated to 60°C. The flow rate is adjusted to 1.0 L/min by controlling the electric valve, and the injection time is set as 40 s. The comparison between the simulation curve and the test curve is shown in Figure 16.

Comparison between the simulation curves and the test curves: (a) surface temperature change curves and (b) melting thickness change curves.
The contrast curves of the surface temperature between the test and the simulation are depicted in Figure 16(a). As shown in Figure 16(a), the overall variation tendency of the test curve is almost the same as that of the simulation curve. The test curve shows that there is a relatively stable equilibrium temperature stage during the injection process, and the equilibrium temperature is slightly lower than the simulation curve, which can be construed as the neglect of some heat loss. The test curve obviously lags behind the simulation curve, and there exits some fluctuation in the equilibrium temperature stage, which is because that the measurement of the temperature has a certain lag, and the continuous jet of the high-temperature deicing fluids can partly interfere with the measurement accuracy of the infrared temperature sensor.
The contrast curves of the melting thickness between the test and the simulation are shown in Figure 16(b). It is observed that the overall variation tendency and the stable value of the test curve and the simulation curve are almost the same. During the deicing fluid injection process, the test curve is apparently ahead of the simulation curve. It is because that the central position of the injection exactly covers the sensors measuring the ice thickness, accelerating the melting rate of the ice around the sensors and resulting in the rapid decline of the measured ice thickness. There exist some aberrant data points on the test curve in the injection stage, and the stable value of the ice thickness is slightly lower than that of the simulation curve, the reason of which is that the deicing fluids sprayed from the nozzle have a certain amount of kinetic energy, and the deicing fluids will directly wash some ice away.
Although there is some error between the test data and the simulation data, these data are still similar, and the overall variation tendency is consistent. Therefore, the dynamic deicing model is similar to the actual deicing process, and the model can reasonably reflect the change in the state parameters during the deicing process and establish the foundation for the subsequent research and analysis.
Test analysis of parameter variations
In order to further verify the correctness of the simulation analysis under the condition of the parameters variations, the flow rate, the initial temperature, and the injection time are changed in the experiment system, respectively, and the impacts of these parameters variations on the actual deicing process are analyzed.
The flow rate is set as 1.0 L/min, and the injection time is fixed to 40 s by controlling the electric valve. The deicing fluids are heated to 50°C, 60°C, 70°C, and 80°C, respectively. The test curves of the deicing process under different initial temperature conditions are depicted in Figure 17.

Test curves under different initial temperatures: (a) surface temperature change curves and (b) melting thickness change curves.
The deicing fluids are heated to 60°C, and the injection time is fixed to 40 s. By controlling the electric valve, the flow rate is set at 0.8, 1.0, 1.2, and 1.4 L/min, respectively. The test curves of the deicing process under different flow rate conditions are depicted in Figure 18.

Test curves under different flow rates: (a) surface temperature change curves and (b) melting thickness change curves.
The deicing fluids are heated to 60°C, and the flow rate is set at 1.0 L/min by controlling the electric valve. The injection time is controlled as 20, 30, 40, and 50 s, respectively. The test curves of the deicing process under different injection time conditions are depicted in Figure 19.
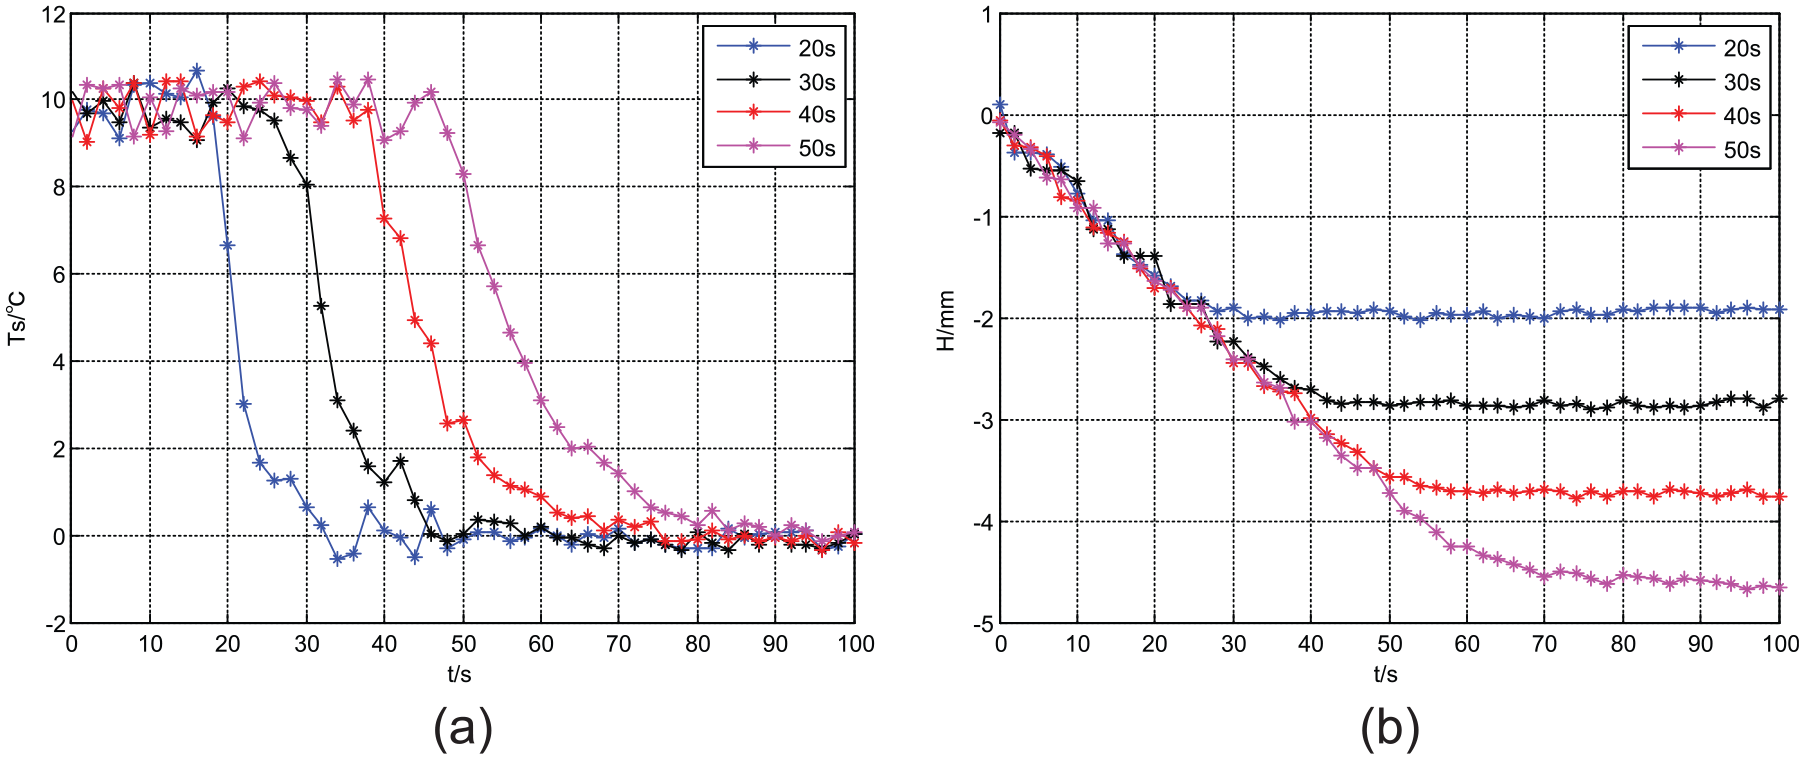
Test curves under different injection time conditions: (a) surface temperature change curves and (b) melting thickness change curves.
The contrast analysis shows that there exist some differences between the test data and the simulation data. The data error mainly comes from the following aspects. First, the deicing fluids sprayed from the nozzle have a certain amount of kinetic energy, and the deicing fluids will directly wash some ice away, resulting in the sudden change in the ice thickness. Second, the central position of the injection exactly covers the sensors measuring the ice thickness, accelerating the melting rate of the ice around the sensors. Third, the signal acquisition of the infrared temperature sensor has a certain lag and is easy to be influenced by the continuous jet of the high-temperature deicing fluids. In the following study, the error between the test and the simulation can be further reduced by improving the experimental conditions. The improvement of the experimental conditions involves the change in the spray patterns, the adjustment of the angle and the position of the nozzle, the collection of the signal in different points, and so on.
These experimental results show that although there is some error between the test curve and the simulation curve, the overall variation tendency is still consistent, and the data error is within the accepted range. Therefore, the results confirm the rationality and the accuracy of the dynamic deicing model. The experimental process verifies the significant impacts of the flow rate, the initial temperature, and the injection time on the deicing process. The conclusion of the experiment is consistent with that of the simulation, which shows that both the flow rate and the initial temperature can change the rate and the volume of the ice melting by changing the equilibrium temperature, while the injection time can only change the duration of the equilibrium temperature and only affect the volume of the ice melting.
Conclusion
Aircraft ground deicing is an important technical means of removing the aircraft surface ice and ensuring flight safety. Therefore, a reasonable and valid model of the deicing process is important to the subsequent research. However, the previous researches mainly focused on the properties of the deicing fluids rather than the deicing process. In this article, one crucial idea is that the dynamic model of the deicing process is established based on the analysis of the deicing mechanism, and the influential factors on the deicing process are studied. By the numerical simulation, the impacts of the flow rate, the initial temperature, and the injection time on the deicing process are investigated, and the model suggests that there exists an equilibrium temperature stage, where the surface temperature of the deicing fluids remains unchanged. Combined with the actual process of aircraft ground deicing and the mathematical model, the semi-physical experiment system is established. The experimental results show that the theoretical model presented in this article is effective for the prediction of the ice thickness and the surface temperature, which indicates that the dynamic model is valid, and the simulation analysis is reliable. Moreover, the simulation and experiment show that the changes in the flow rate, the initial temperature, and the injection time of the deicing fluids have significant effect on the deicing process. Both the flow rate and the initial temperature can change the rate and the volume of the ice melting by changing the equilibrium temperature, while the injection time can only change the duration of the equilibrium temperature and only affect the volume of the ice melting.
Footnotes
Academic Editor: Zheng Chen
Declaration of conflicting interests
The author(s) declared no potential conflicts of interest with respect to the research, authorship, and/or publication of this article.
Funding
The author(s) disclosed receipt of the following financial support for the research, authorship, and/or publication of this article: This work was financially supported by the National Key Technology Research and Development Program of China (grant no. 2012BAG04B02).