
Abstract
Energy harvesting device involves capturing energy from the environment and it is increasingly crucial in the crisis of greenhouse effect nowadays. Equipping bicycles with many types of shock absorbers can enhance the riding comfort. Additionally, an embedded energy harvesting device will gain much benefit beyond the sports. This study applied the finite element method to analyze the components of nonlinear magnetic spring. The analytical simulations were conducted to analyze the electromagnetic effect in ANSYS©/Emag software. A model equipped with nonlinear magnetic springs was constructed to absorb the impact energy. Nevertheless, the piezoelectric components were used to capture the piezoelectric effect current caused by the compressive stress. A series of simulations were conducted, such as changing the diameter of the magnet, electric coil width, and the position of the coils. Moreover, with those finite element analysis data, the Taguchi method L9(34) orthogonal arrays were applied to determine the optimal parametric dimensions of the electromagnetic and piezoelectric assemblies for maximizing the captured kinetic energy and power transformation. The results could assist the suspension manufacturers to innovate their design for energy harvesting and impact absorbing.
Introduction
Energy harvesting refers to scavenging energy from the environment and it is increasingly crucial. For the sake of the increasing efficiency of electronics and micro-actuators, those improvements enable many devices to be powered in a few milliwatts. Electromagnetic energy harvesting also empowers the benefit to transform the ambient energy from vibrations into electricity. Generating practical amounts of electrical energy from mechanical vibrations in a small device is feasible. 1 Beeby et al. 2 observed that vibration-powered wireless sensor systems can be used in numerous scenarios and several studies have addressed possible usefulness in ambient intelligence, medical implants, and smart clothing. Arroyo and Badel 3 developed a new extracting technique for electromagnetic generators, the synchronous magnetic flux extraction that is extended from a previously developed synchronized switch method for piezoelectric generators, the synchronous electric charge extraction. Shen et al. 4 demonstrated a new self-powered vibration damping technique that is an application of an enhanced synchronized switching harvesting technique. Cepnik et al. 5 derived a simple equation for electromagnetic coupling in oscillating electromagnetic energy harvesting. A maximum efficiency of 50% of an electromagnetic energy harvester was defined by the optimal energy balance of energy harvesting applications. Saha et al. 6 observed that the power generated by the magnetic spring generator could be increased by adding a separate coil close to the top and bottom ends of the tube and connecting all coil terminals in parallel to the load.
Roundy et al. 7 investigated and evaluated different conversion mechanisms that lead to many specific optimized designs for both capacitive micro-electromechanical systems and piezoelectric converters. Foisal and Chung 8 described the design, simulation, and characterization of an AA size electromagnetic energy harvester that can convert environmental vibrations into electrical energy. Moreover, many bicycle patents have been published for public references.9–11
Van der Sandea et al. 12 investigated parallel tubular permanent magnet drive a passive spring to design different controllers. Roundy et al. 13 proposal for mechanical energy to divide into moving human body) and structural vibration energy, former operating frequency about 10 Hz and the latter is greater than 30 Hz. Masaki et al., 14 Takuya and Makoto, 15 and Xiu and Tomohiro 16 developed a three-dimensional base isolation system to be applied on pneumatic or hydraulic equipment using spring and electromagnetic devices.
In this article, we applied a finite element (FE) analytic method to analyze nonlinear magnetic spring components. In addition, the simulation and analysis were conducted to explore the optimized parametric dimensions of the three components for maximizing the captured kinetic energy and power transformation. The results can assist bicycle power equipment manufacturers.
Analysis and design of bicycle shock absorbers
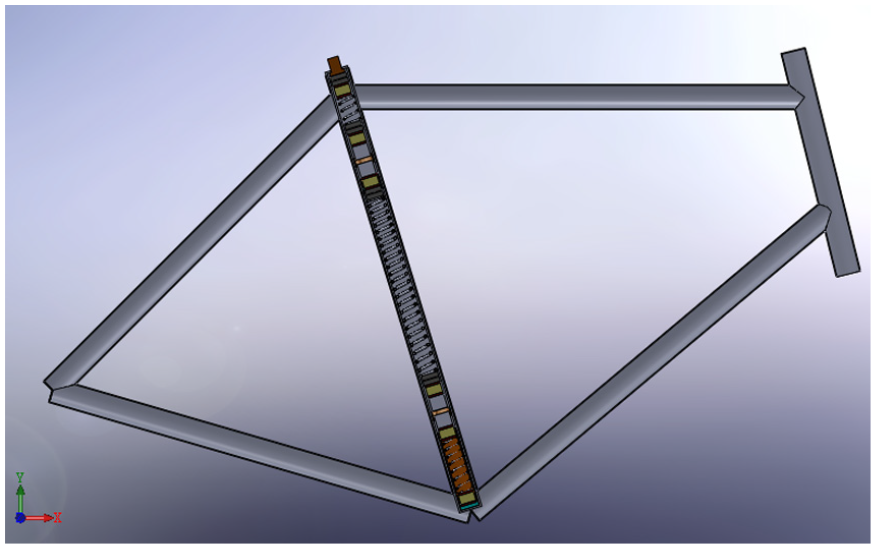
This study applied an FE analytic method to analyze nonlinear magnetic spring components. The simulations were conducted in ANSYS©/Emag software to analyze the electromagnetic effect and then determine the ideal specification for a solenoid coil. A prototype is equipped with nonlinear magnetic springs for absorbing sudden impact energy. Figure 1 shows the schematic of bicycle shock absorbers consisting of two pairs of repulsive magnets that act as the functions of nonlinear magnetic springs, which winded around with two external coils. The figure included many power elements: piezoelectric sheet, insulator, magnet, connecting rod seat, ball bearings, spring, copper coil, copper coil fixed blook, and so on. The generator structure has been modeled using finite element analysis (FEA) in order to understand the spring forces which exist between the fixed and moving magnets and to understand the flux linkage with the coil.

Shock absorbers with energy harvesting design for a bicycle.
First, in the design stage, we explored the use of SolidWorks© to design a set of shock absorbers combined with a power generation mechanism into the bicycle frame, as shown in Figure 2. When we ride the bicycle, with the aid of the upward and downward cycling motion of the mechanical springs due to the elastic action, and during the repulsive action of the magnets that reciprocate and shuttle between the external coils, the electromagnetic effect occurs to generate electricity.
Bicycle frame integrated with the power generation mechanism.
Second, the major components analyzed in this study were the piezoelectric material, the magnets, and the magnetic flux density of the coils. According to the literatures, ANSYS is useful for analyzing the magnetic flux lines of the magnets and the magnetic flux density between the magnets and coils. On the other hand, COMSOL© multiphysics FE software is beneficial to analyze the piezoelectric material properties and characteristic frequency. Table 1 shows the properties of the piezoelectric materials. Figure 3 used COMSOL to analysis characteristic frequency of the piezoelectric material.
Properties of piezoelectric materials.


Simulation analysis of piezoelectric material: (a) piezoelectric material modal, (b) piezoelectric material grid graph, and (c) characteristic frequency of the piezoelectric material.
The piezoelectric materials have been used for many years to convert mechanical energy into electrical energy. 2 The piezoelectric effect was discovered by J and P Curie in 1880. They found that if certain crystals were subjected to mechanical strain, they became electrically polarized and the degree of polarization was proportional to the applied strain. The piezoelectric materials typically exhibit anisotropic characteristics; thus, the properties of the material differ depending on the direction of forces and the orientation of the polarization and electrodes.
The FE code used in the simulations is based on a flow formulation approach using an updated Lagrangian procedure; the FE formulation for rigid-plastic deformation in a material subject to work-hardening has the form

where
The following assumptions for magnetic line analysis were made in this study: (1) the magnetic lines used to describe the strength and direction of the magnetic field are imaginary, (2) a magnet with more denseness has a stronger magnetic field and magnetic effect, and (3) the number of magnetic lines can be expressed in terms of the magnetic field strength.
Table 2 presents the analysis data of the magnets. They are the line width of the coils, diameter of the magnet, height of the magnet, and number of the coils. In the first simulation, these four parameters were kept in the same levels. And only consider the crucial parameter, that is, the located position of the coils, they are 0, 10, and 25, and 35 mm from the bottom, respectively.
Magnetic line analysis data.

Figure 4 shows the distribution of the magnetic lines simulated in ANSYS software. The analysis rearranged the position of the right-side line coil to observe the magnetic line densities. The rectangle of the right side is the coil and the rectangular of the left side is the magnet; this analysis changed the position of the right-side coil, to observe the magnetic field lines. The analysis used the magnet diameter of 10 mm. The magnetic density contours of each different position were demonstrated in the order of 0, 10, 25, and 35 mm in Figure 5 from left to right. It is obvious that when we locate the magnet closer to the line coils, it will induce more magnetic lines’ distribution and build a stronger magnetic field.

Magnetic lines for different coil positions (from the bottom): (a) 0 mm, (b) 10 mm, (c) 25 mm, and (d) 35 mm.

Magnetic flux density distributions for four magnet diameters.
The article used ANSYS software analysis electromagnetic effects, in order to find the best size of the electromagnetic coils. The whole nonlinear magnetic spring comprises two repulsion magnets and coil. The magnetic flux passing through the magnetic field lines of a cross-sectional number is called flux Φ, and the unit is Weber. Moreover, we used “magnetic flux density B” to describe the strength of a magnetic field

where B is the magnetic flux density (T), Φ is the flux (Wb) and A is the cross-sectional area (m2).
Simulation results and analysis
Alternating the diameter of the magnet
Figure 5 shows the magnetic flux density distributions of the four magnet dimensions. The rectangle of the right side is the coil, and the rectangular of the left side is the magnet. From cases A–D, the magnet diameters are 10, 15, 20, and 25 mm, respectively. The magnet length and line coil width are fixed as 20 and 1 mm, respectively. We find that the smallest magnet diameter yields the highest flux density of 0.213 T for the magnet diameter of 10 mm.
Alternating the line coil width
Figure 6 shows the magnetic flux density distributions of the five different line coil widths. From cases A–E, the line coil widths are 1, 2, 3, 4, and 5 mm, respectively. The rectangle of the right side is the coil, and the rectangular of the left side is the magnet. The magnet length and diameter are fixed as 20 and 10 mm, respectively. The line coil width affects the magnetic flux density inversely. The greatest line coil width yields the lowest flux density of 0.14 T for line coil width.

Magnetic flux density distributions for five line coil widths.
Alternating the position of the line coil
Figure 7 shows the magnetic flux density distributions of the four magnetic diameters. From cases A–D, the line coil positions are 0, 10, 25, and 35 mm from the bottom, respectively. The rectangle of the right side is the coil, and the rectangular of the left side is the magnet. The magnet diameter, line coil width, and magnet height are fixed as 10, 1, and 20 mm, respectively. Positioning the line coil at 25 mm, it yields the maximum magnetic flux density of 0.203 T.
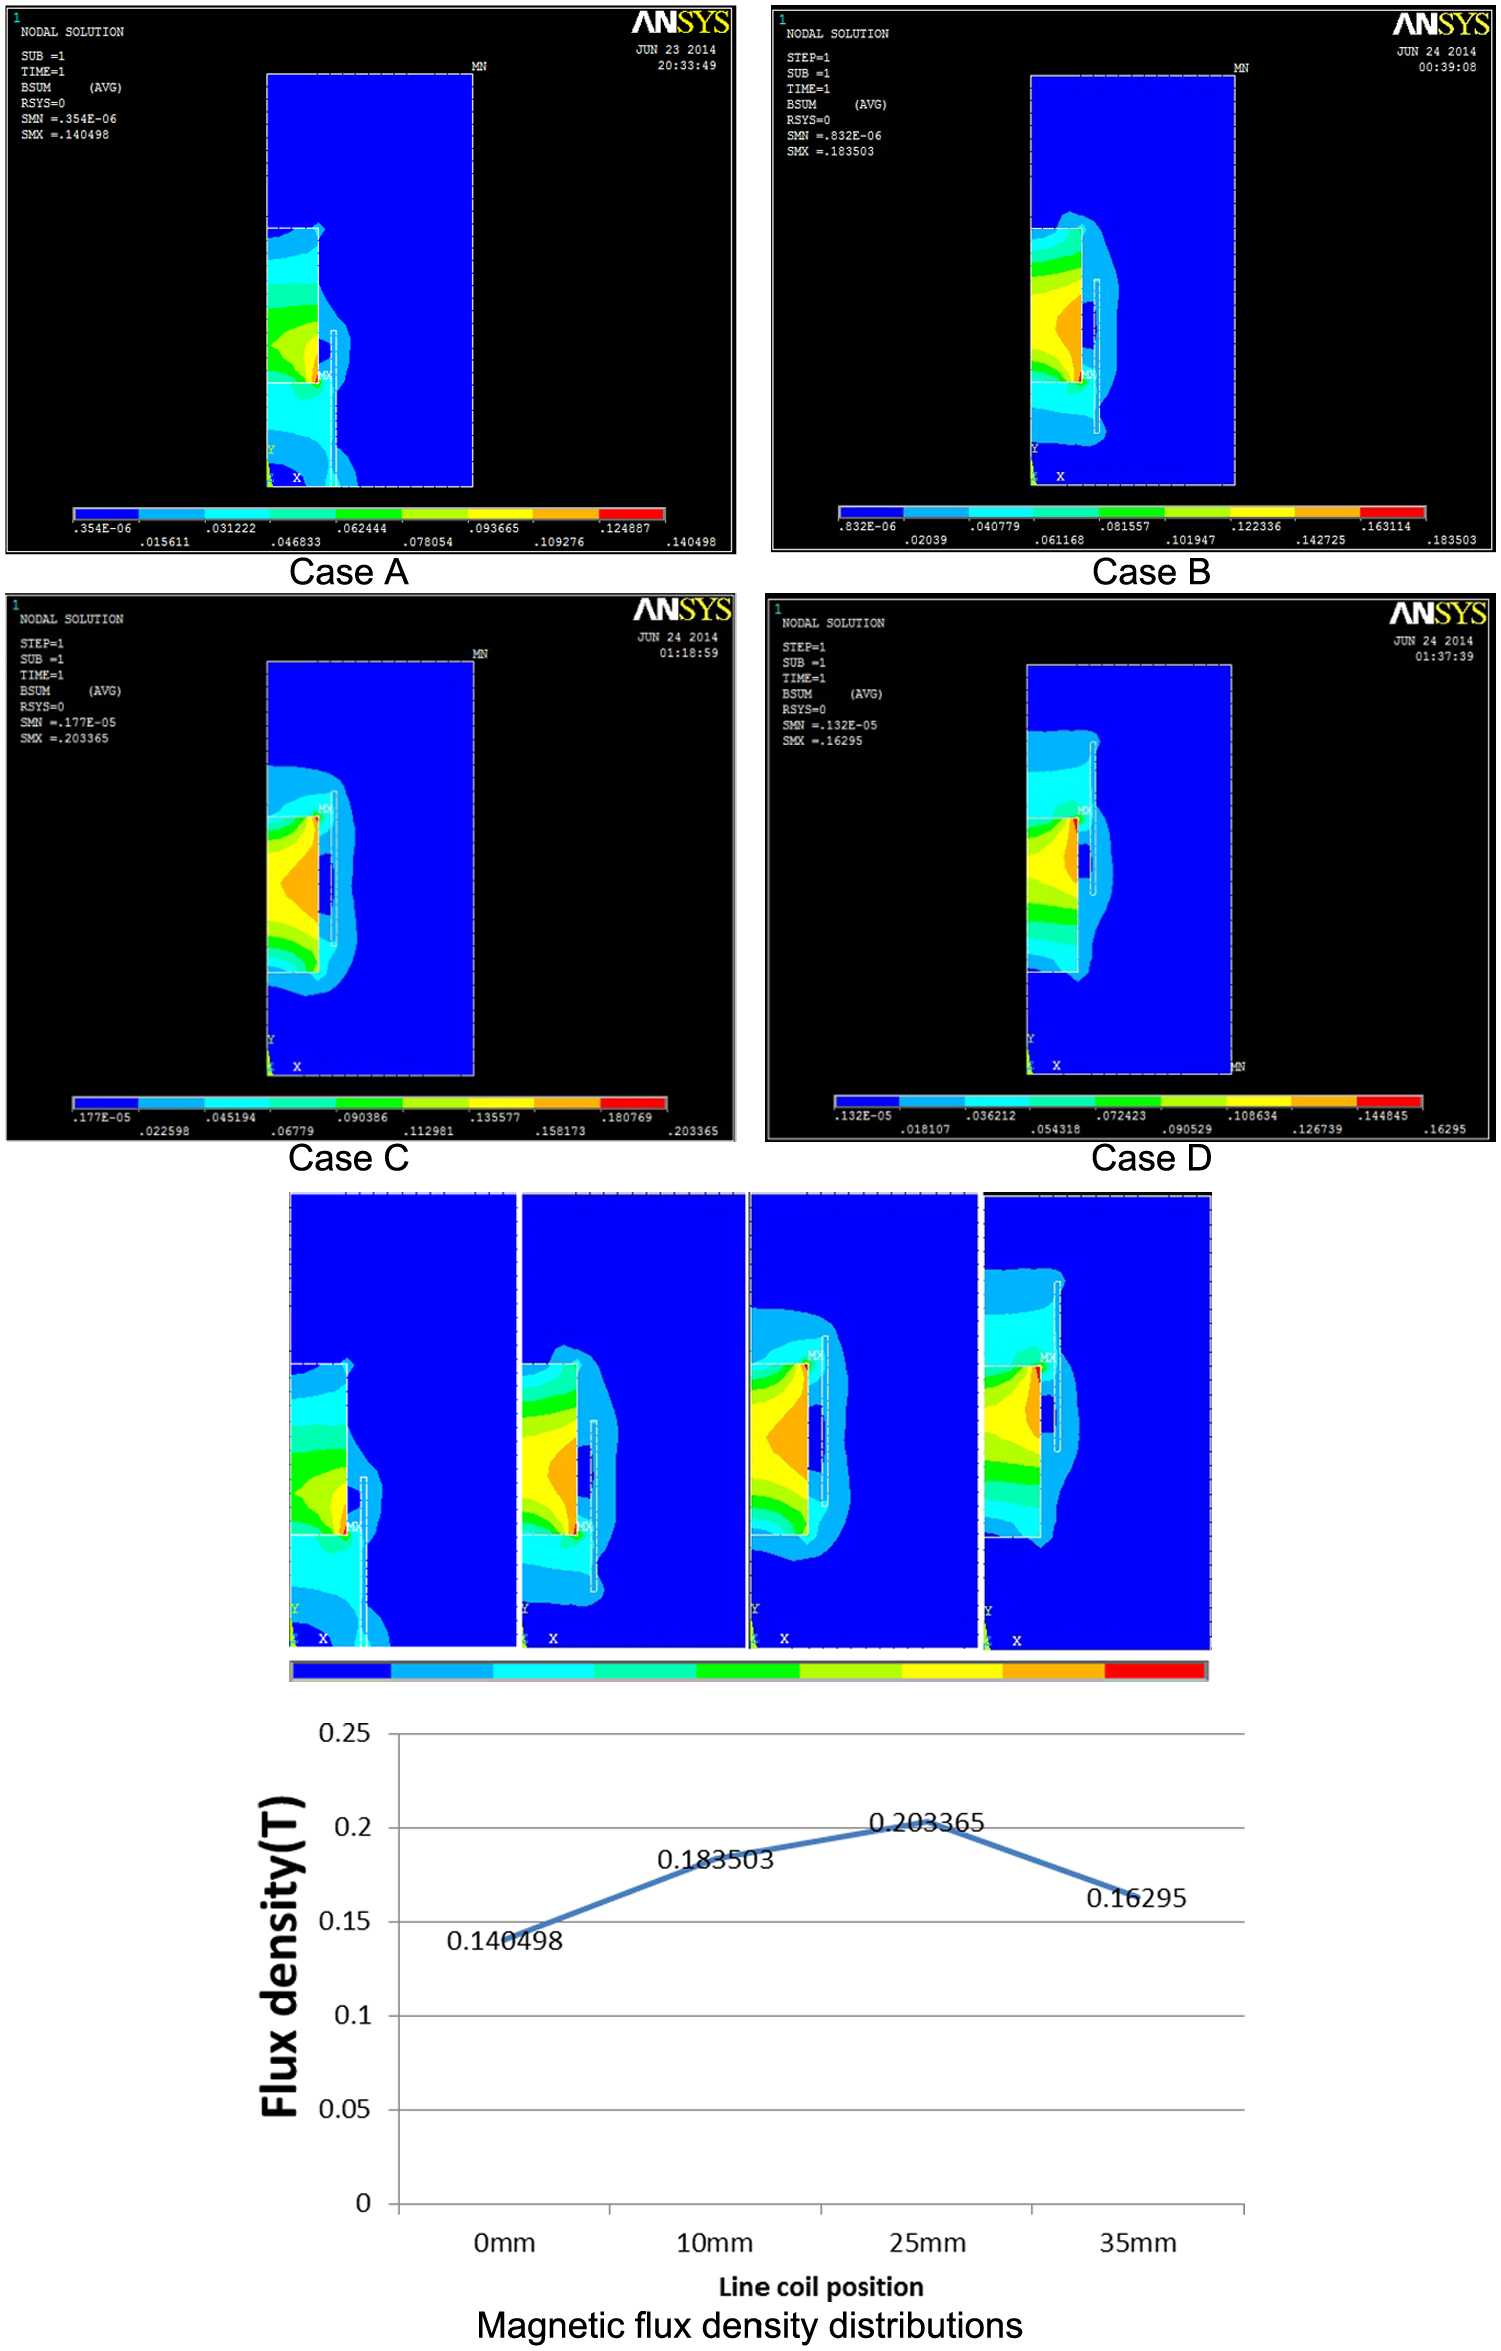
Magnetic flux density distributions for four line coil positions from the bottom.
Taguchi analysis of the piezoelectric material for determining the voltage value
The Taguchi method is one of the most well known and widely applied of all robust design methodologies. The fundamental advantage of the Taguchi approach is its ability to provide a detailed understanding of the individual and combined effects of various design parameters on the basis of a minimum number of experimental or simulation trials. The basic aim of the Taguchi method is to establish the optimal combination of design (or processing) parameters and to reduce the variations in the product (or process) quality by rendering the parameter design robust to the effects of noise.
The Taguchi method employs generic signal-to-noise (S/N) ratios to quantify the quality of the product or process design. Depending on the particular characteristics of the design problem, different S/N ratios may be applicable, that is, “lower is better” (LB), “nominal is best” (NB), or “higher is better” (HB).
In the design problem considered in this study, the aim is to maximize the output voltage values during the rolling process. Accordingly, the HB S/N ratio is applicable, that is
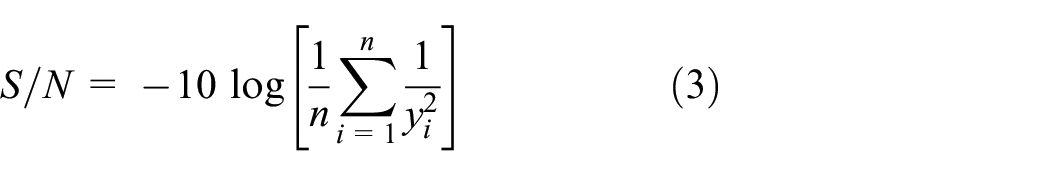
where n is the number of experimental or simulation repetitions performed under the same design parameter conditions, yi is the simulation or experimental result, and i indicates the number of design parameters arranged in the Taguchi orthogonal array (OA).
Having carried out the trials prescribed in the OA, the resulting S/N data are analyzed using the analysis of means (ANOM) statistical method. The ANOM results are then used to produce S/N response tables and S/N response graphs from which the optimal design parameters can be obtained.
The mean S/N ratio of (generic) Factor A at level m is given by

where nA is the number of appearances of Factor A in the OA table and (S/N) Am is the S/N ratio of Factor A at level m.
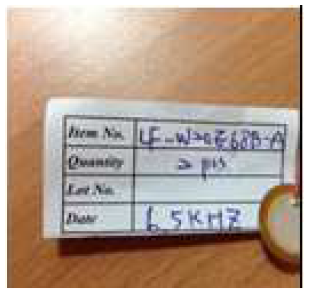
This study also analyzed the resonance frequency, impedance, capacitance, and thickness of the piezoelectric materials by applying the Taguchi method. 17 We selected the above four factors which each has three levels of the piezoelectric materials, as shown in Table 3, and implemented the Taguchi OA L9(34) to perform the experiment, as denoted in Table 4. The parameters of the piezoelectric material included vibration frequency (kHz): 1.3, 4.0, and 6.6; resonant impedance (Ω): 100, 600, and 400; capacitance value (PF): 47,000, 20,000, and 14,000; and material thickness (mm): 0.2, 0.28, and 0.23. Table 5 presents the output voltage values, and Table 6 is the characteristics response table. According to the optimized Taguchi analytic results of the piezoelectric material (A3B3C2D1), we found that the best levels of the vibration frequency, resonant impedance, capacitance value, and material thickness values are 6.5 kHz, 400 Ω, 20,000 PF, and 0.2 mm, respectively. And the maximum output voltage is 1.99 V.
Parameters of the piezoelectric material.

Orthogonal array for experiment L9(34).

Output voltage values.

Characteristics response table for voltage value.

Bold values are the optimized Taguchi analytic results.
Taguchi analysis of the piezoelectric material for determining the magnetic flux density
We selected the design factors and levels of the piezoelectric material, as shown in Table 7, and applied the Taguchi OA L9(34), as denoted in Table 8. Table 9 presents the output magnetic flux densities, and Table 10 is the characteristics response table. According to the optimized Taguchi analytic results of the piezoelectric material (A1B1C3D1), we found that the best levels of the line coil width, magnetic diameter, magnetic height, and air gap are 0.5, 10, 25, and 1.5 mm, respectively. And the maximum output magnetic flux density is 0.328981 T, as shown in Table 9. In addition, the optimization analysis of the magnetic flux density in ANSYS is shown in Figure 8.
Design factors and levels of the piezoelectric material.
Orthogonal array L9(34) for determining magnetic flux density.
Output magnetic flux density values.
Characteristics response table for magnetic flux density.

Bold values are the optimized Taguchi analytic results.
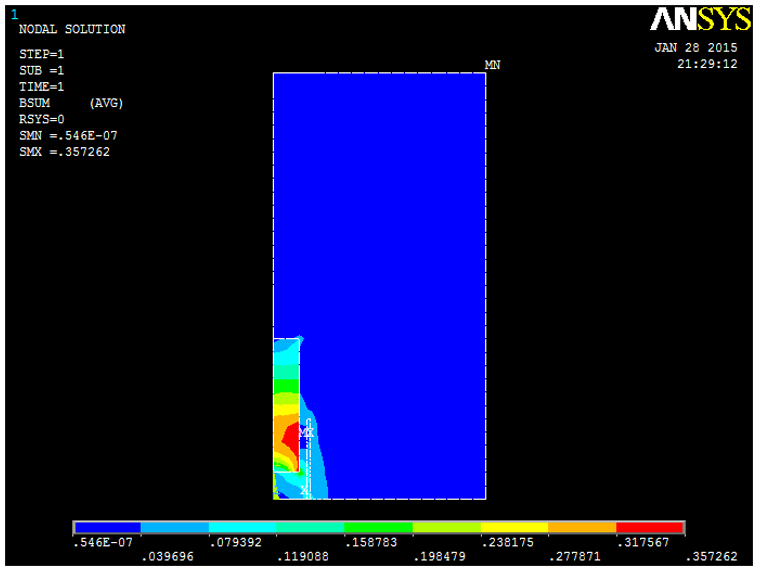
Optimization analysis of the magnetic flux density.
Figure 9 shows the experimental assembled product including strong magnet, piezoelectric sheet, spring, and insulating spacers, and it presents the coil output voltage waveform. It can be seen that the device may produce small electricity, the maximum voltage about 3.84 V, and the minimum voltage about −2.52 V.
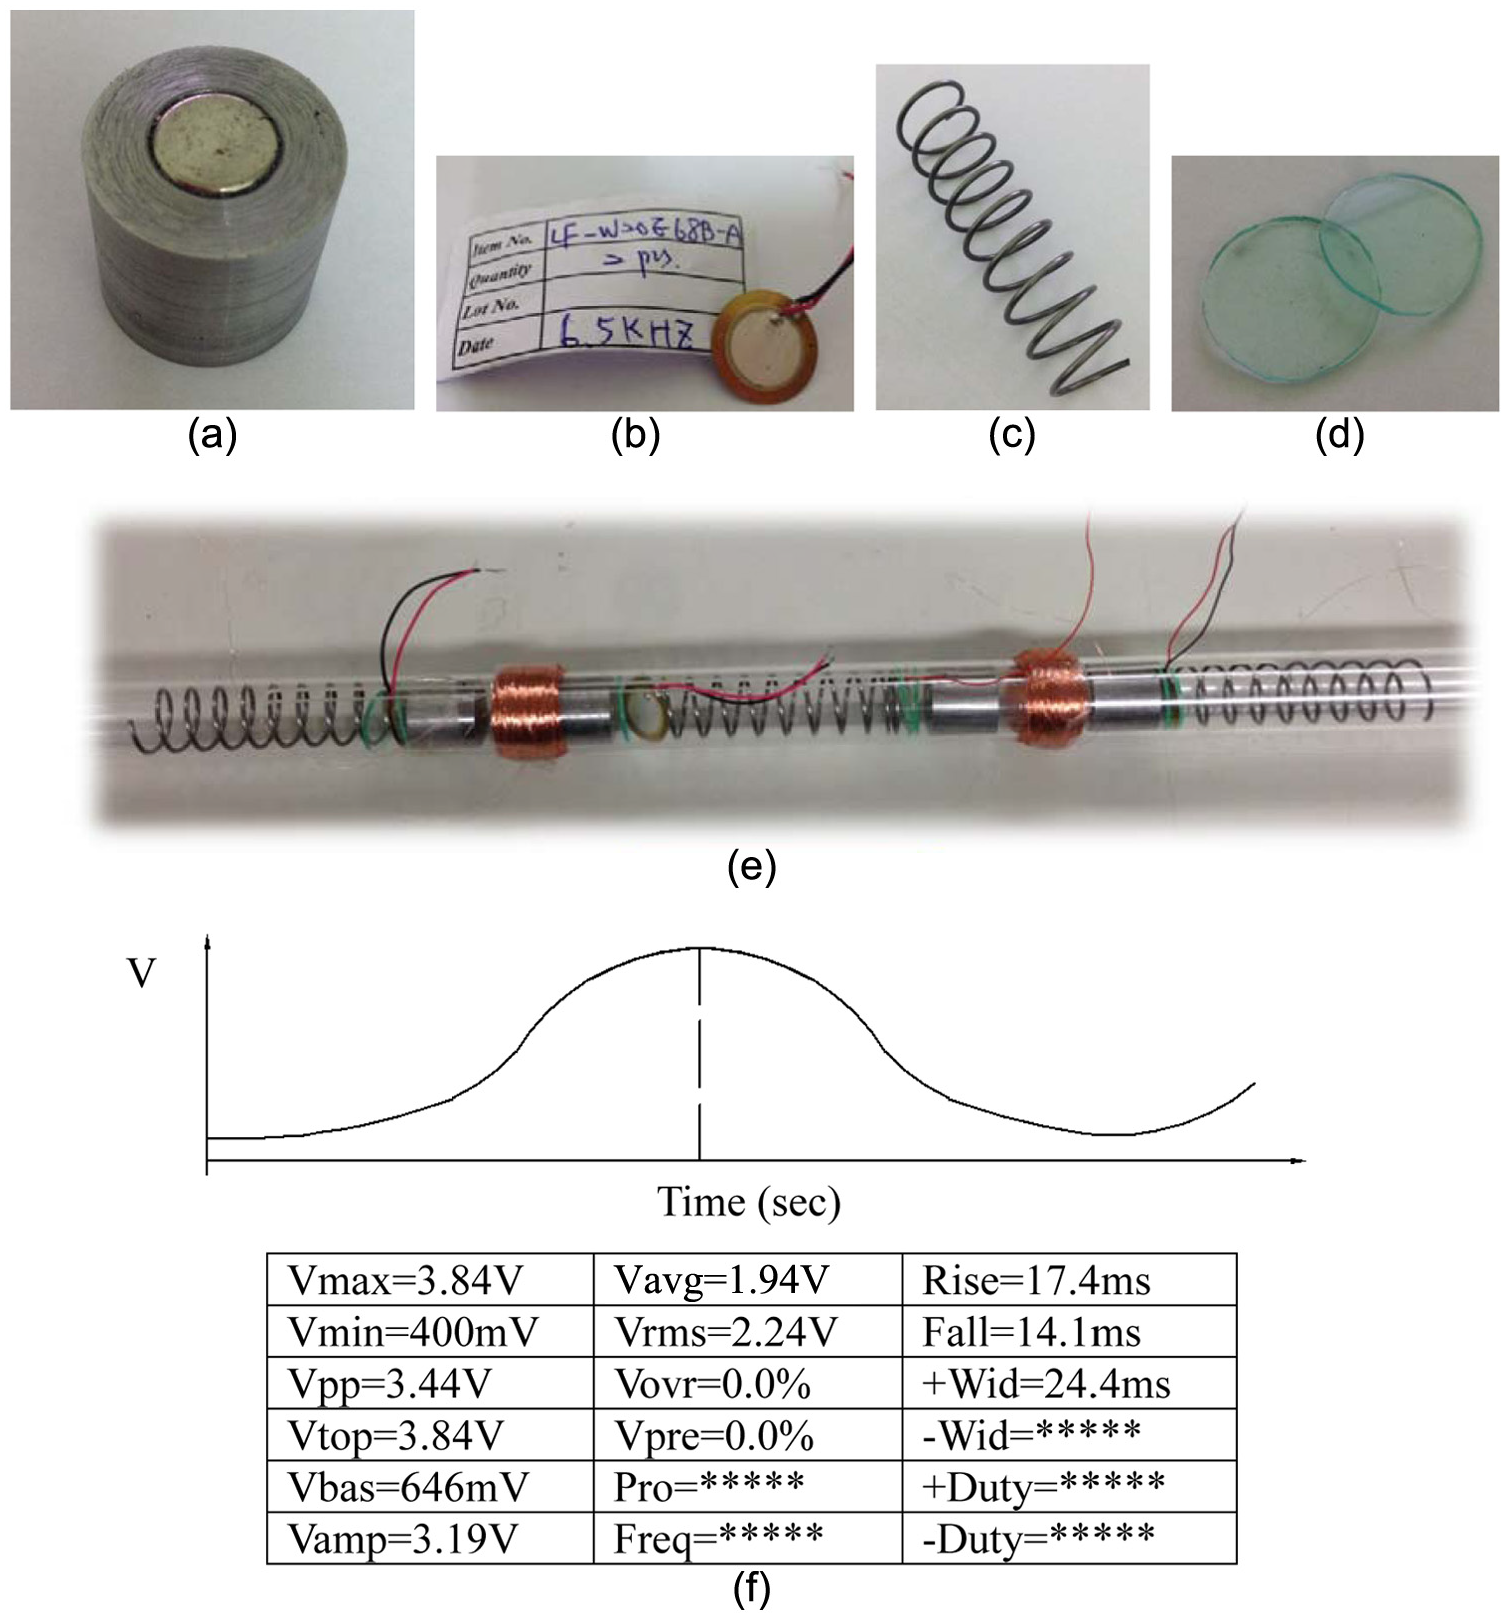
Experimental assembled product: (a) strong magnet, (b) piezoelectric sheet, (c) spring, (d) insulating spacers, (e) finish product, and (f) experimental values.
The article used the magnetic force and the spring pushes the PZT-5H piezoelectric material caused the piezoelectric effect, the mechanical energy is converted to electrical energy, combined with the bicycle frame, and used COMSOL analyze piezoelectric material can be found the impedance and electric current optimization analysis of piezoelectric material. It can be seen that the impedance of 666.67 Ω, the electric current.
Conclusion
This study applied an FEA method to analyze nonlinear magnetic spring components. The simulation and analysis were conducted to explore the optimized parametric dimensions for maximizing the kinetic energy captured and power transformation. The results can assist the suspension manufacturers to innovate their design for energy harvesting and impact absorbing. The results showed that (1) positioning the magnet closer to the line coil induces a stronger magnetic field line distribution and magnetic field; (2) a smaller magnet diameter yields a higher flux density; (3) a greater line coil width yields a lower flux density; (4) positioning the line coil at 25 mm produces the maximum magnetic flux density of 0.2 T; and (5) according to optimization analysis of the piezoelectric material (A3B3C2D1), the best levels of the vibration frequency, resonant impedance, capacitance values, and material thickness are 6.5 kHz, 400 Ω, 20,000 PF, and 0.2 mm, respectively. And the maximum output voltage value is 1.99 V.
Footnotes
Academic Editor: Stephen D Prior
Declaration of conflicting interests
The author(s) declared no potential conflicts of interest with respect to the research, authorship, and/or publication of this article.
Funding
The author(s) disclosed receipt of the following financial support for the research, authorship, and/or publication of this article: The authors gratefully acknowledge the financial support of the Ministry of Science and Technology of the Republic of China under Grant No. NSC 102-2622-E-018-003-CC3.