
Abstract
The inlet gas quantity has a great influence on the performance and inner flow characteristics of a mixed-flow pump. In this article, both numerical and experimental methods are used to carry out this research work. The effects under the steady gas volume fraction state and the transient gas quantity variation process on the mixed-flow pump are investigated and compared in detail. It could be concluded that the head of the mixed-flow pump shows slight decline at the low gas volume fraction state, while it decreases sharply at the high gas volume fraction state and then decreases with the increasing gas quantity. There is an obvious asymmetric blade vapor density on the blade suction side under each cavitation state. The cavities can be weakened obviously by increasing the inlet gas volume fraction within a certain range. It has little influence on the internal unsteady flow of the mixed-flow pump when the gas volume fraction is less than 10%, but the pump starts to operate with a great unsteady characteristic when the inlet gas volume fraction increases to 15%.
Introduction
As an energy conversion machinery, pumps exist in almost all fluid flow places and are used widely nowadays. 1 With the development of industry, more and more high-power mixed-flow pumps are required to meet the industrial needs. The stability and reliability of mixed-flow pumps are very important and should not be ignored because they influence the safety of industry systems directly.
Studies on mixed-flow pump were started from a long time, and both improving the hydraulic performance and revealing inner flow patterns have been conducted till now. Van Esch and Kruyt 2 analyzed the hydraulic performance of a mixed-flow pump based on the unsteady inviscid computations and loss models. Kim and Kim 3 significantly improved the efficiency of a mixed-flow pump at large flow rate by modifying the vaned diffuser geometry. Bing and Cao 4 put forward a three-dimensional design method for the blades of a mixed-flow pump with controllable wrap angle, and Wu et al. 5 applied trailing-edge modification method based on trailing-edge rounding in the suction surface to widen the operating range of a mixed-flow pump.
Water usually flow inside mixed-flow pumps with a certain amount of gas when operating some conditions, so the performance of mixed-flow pumps is affected inevitably under these gas–liquid two-phase flow patterns.6,7 Many literatures on gas–liquid two-phase flow of pumps have been carried out in the recent years. Samaras and Margaris 8 presented a very simple map and used this map to show the measured data and the flow regime transitions. Shi et al. 9 developed a fuzzy model cerebellar model articulation controller (CMAC) based on digital techniques to measure flow parameters and used this method to analyze two-phase flow characteristics, such as vapor size, vapor velocity, and vapor distribution. Minemura et al. 10 used a one-dimensional two-fluid model to predict the air–water two-phase flow performance of a centrifugal pump. In addition, some other research works have been done to investigate the gas–liquid two-phase characteristics, including both numerical and experimental methods.11–15
Cavitation, which can cause head drop, vibration, and noise of pump systems, is a typical kind of two-phase flow phenomenon existing in many kinds of pumps. In order to reduce the damages caused by cavitation, a lot of researchers do a great deal work on it.16–19 Moreover, some researchers have done deep research work to reveal flow mechanism under cavitation state,20–23 and some cavitation-induced unsteady flow characteristics have also been investigated through numerical and experimental ways.24–27
In the literatures, there is little open study and analysis on gas–liquid two-phase flow in the mixed-flow pump. In this article, the effects of gas volume fraction on the two-phase flow performance of an industrial mixed-flow pump are studied in detail. Both results under the steady gas volume fraction state and the transient gas quantity variation process are compared. The research contents in this article can be used as a reference for the optimal design of mixed-flow pumps.
Numerical procedure
Physical model
The pump model is a high-power reactor coolant pump, which is one of the most important components in the nuclear power plants. The safety, reliable operation, and hydraulic performance of the pump should be considered when it is designed. The whole flow passages of the pump are made of inlet, impeller, diffuser, and annular volute, and all parts were modeled by Pro/E, which is shown in Figure 1. The main parameters of the pump are listed in Table 1.

Physical model of the mixed-flow pump: (a) assembled domain, (b) impeller, (c) diffuser, and (d) main parameter of impeller.
Main parameters of the pump.

Mesh generation and grids independence
The four calculation parts of the mixed-flow diffuser pump were imported to grid generation tool ICEM-CFD with blocking method, and each of the parts is meshed independently. The impeller layer spacing is 0.1 and aspect ratio is 1.2. The static mesh is selected and the same global size of each part is set for the calculation. The general grid interface is used to transfer data from rotating nodes to stationery nodes. Mesh grids are not only the expression forms of the geometry but also the calculation objects in the numerical simulation. The mesh quality and grid numbers have a great influence on the simulation results and the calculation time. The independence of the solutions from the number of grid elements was carried out through three grid topologies, and the details of varying grid sizes are given in Table 2. The heads of the pump at the nominal operating condition with four different grid numbers are compared in Figure 2. It can be seen clearly that the head of the pump reaches to an asymptotic value with the increasing grid numbers. According to Figure 2, 4.99 million grid elements for the whole fluid domains are considered to be reliable to guarantee the simulating precision. Figure 3 shows the mesh images of annular volute and impeller of the model pump.
Grids number of the pump.

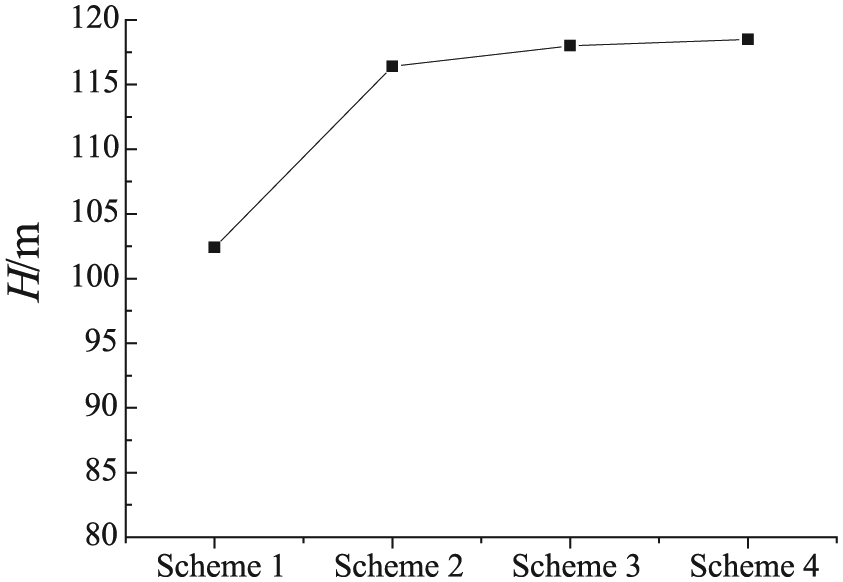
Calculated head under four grid numbers.

Mesh image of: (a) the volute and (b) the impeller.
Numerical setup
The flow in this high-power reactor coolant pump is a gas–liquid two-phase flow and the flow pattern is very complex. The k−ε turbulence model has a strong adaptability and it can be used in most flow simulation occasions, and it was verified to have a good result in cavitation calculation in the literature, 28 so this turbulence model was selected in the simulation of the mixed diffuser pump to solve the Reynolds-averaged Navier–Stokes equation in our work.
It is concluded that Zwart–Gerber–Belamri model has higher precision at large flow rate from the literature, 29 and the cavitation performance of the charging pump at the maximum flow rate is a main topic of research. So, Zwart–Gerber–Belamri model, which is given by formulas (1) and (2), is applied in our work


The average static pressure fields were set as the inlet boundary condition, and the mass flow rate was specified as the outlet boundary condition. The impeller domain was set as rotating domain with a rotational speed n = 1750 r/min, while the other domains were set as stationary. The wall roughness was set as 10 µm in order to keep the real situation, and the near walls were modeled using the standard wall functions. All the walls were thermal isolation and set as non-slip wall. The water volume fraction at inlet was 1, while the vapor volume fraction was 0, and the root mean square (RMS) convergence criterion was set to 10−4.
Some assumptions in the numerical simulation of gas–liquid two-phase flow should be fulfilled in the following aspects:
The liquid is a continuous incompressible phase, while the gas is a scattered incompressible phase, and the physical characteristic of each phase is constant.
The particle size of gas is uniform.
The distributions of liquid phase and gas phase are uniform on the inlet and they have the same axial velocities.
The numerical simulation was performed over a wide range of operating points, from the shut off operating point to maximum flow rate. In order to analyze internal flow characteristics of the mixed-flow pump under different gas volume fraction states, several typical monitoring points were defined in the pump domain. All the monitoring points are on the middle streamline of the pump except P2 and P5, and P2 locates on the pressure side, while P5 locates on the suction side of the same impeller radius. The position of each monitoring point is shown in Figure 4.
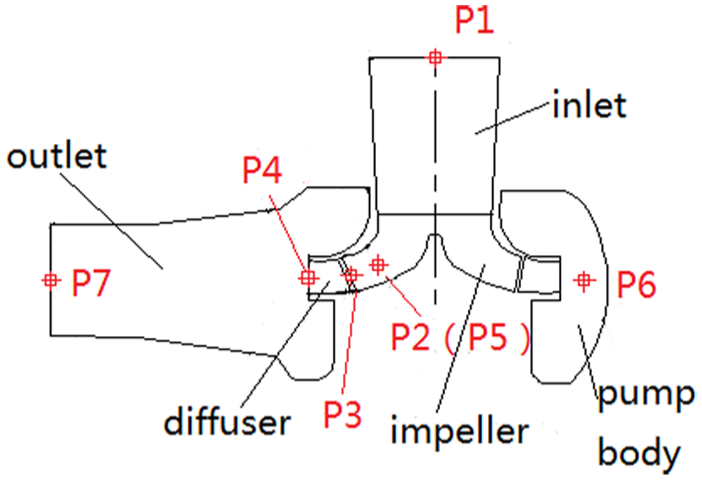
Monitoring points distribution on the mixed-flow pump.
Numerical results
Results under the steady gas volume fraction state
Figure 5 presents the effect on cavitation area of the blade surfaces with different inlet gas volume fraction (i.e. 10%, 20%, and 30%, respectively) in the cavitation process. The cavitation process of the mixed-flow diffuser pump is divided into three parts, namely, incipient cavitation process, developed cavitation process, and serious cavitation process, corresponding to the net positive suction heads (NPSH) of 7.35, 6.2, and 5.61 m, respectively. As can be seen, the cavities mainly generate and develop near the leading edge on suction side of the blade. There is an obvious asymmetric blade vapor density on the blade suction side under each cavitation state. At the incipient cavitation state, the thickness of the vapor is relatively small and thin, while with the development of the cavitation, the vapor density becomes heavier and heavier and it extends to the middle part of the blade suction side. The inlet gas volume fraction has a strong influence on the cavitation level at the three cavitation states. When the gas volume fraction increases, the cavitation area becomes smaller and smaller instead under the same cavitation state. The main reason is that as the gas quantity increases on the inlet, the pressure of the cavitation area near the blade leading edge becomes lower and the vapor enters this low pressure area. The vapor generates a thin layer on the blade surface by the centrifugal force and this layer prevents the fluid flowing through the blade inlet region. It can decrease the cavitation area obviously by increasing the inlet gas volume fraction within a certain range.

Impact of gas quantity on cavitation level of the blade surface under different cavitation states: (a) incipient cavitation state (NPSH = 7.35 m), (b) developed cavitation state (NPSH = 6.2 m), and (c) serious cavitation state (NPSH = 5.61 m).
Usually it is called critical cavitation operating points when the head of the pump drops down 3% in the cavitation process and the NPSH of this state is 6.85 m. Figure 6 shows the vapor volume fraction on each blade surface along the impeller radius with different gas quantities (10% and 30%) under the critical cavitation state. Each line in the figure shows the vapor volume fraction distribution on each blade and “d” stands for the distance from the back shroud to front shroud of the impeller.

Vapor variation along blade surface under different gas volume fractions: (a) β = 10% and (b) β = 30%.
In Figure 6(a), the vapor volume fractions αv increase sharply before 0.2R and then nearly keep constant between 0.2R and 0.6R in the four different shroud distances, which means the vapor mainly distributes on the middle part of the blade under the critical cavitation state. The distribution of vapor volume fraction on each blade is different on the outer part of the blade, and it presents asymmetric blade vapor distribution characteristics. The main difference is that the vapor distributes from the inlet to the middle part in some blades, while some other blades have been scattered nearly from the inlet to the outlet part. The vapor volume fractions of the blades fluctuate strongly at d = 0.2 and they are non-uniform in the whole blades, while the distribution of the vapor becomes better and better as d increases.
In Figure 6(b), the fluctuations of the vapor volume fraction are much greater than before when the inlet gas volume fraction β changes from 10% to 30%. When vapor distribution is at β = 10%, the vapor volume fraction at β = 30% is not uniform with a small value of d, but it becomes better with the increasing d. In addition, the vapor volume fractions decrease quickly and some of them start to decrease less than half of the blade. So it means that the inlet gas quantity has a significant influence on the vapor quantity of the blade when the mixed-flow pump operates under the cavitation state. This is in agreement with that the vapor volume fraction decreases as the inlet gas volume fraction β increases.
Figure 7 presents the vapor volume fraction distributions in the impeller flow channels of the mixed-flow pump with different inlet gas quantities under the serious cavitation state. The images of three vapor volume distributions make parabolic curves and the highest points locate in the range of 0.4R–0.6R. The three curves of the vapor volume fraction nearly overlap before 0.36R and then separate. As the gas quantity increases, the vapor volume fraction decreases instead in the impeller flow passage under the serious cavitation state. This is a same phenomenon with the vapor distribution on the blade surface. The main reason for this is that cavitation vortex is generated and they prevent the vapor to enter.

Vapor distribution in the impeller passage under serious cavitation state.
Results on the transient variation of gas volume fraction
In order to further investigate the effect of the gas quantity on the performance of the mixed-flow pump, the characteristics of the transient variation in gas volume fraction were discussed in the following part. The gas volume fraction was adjusted with time by the function (3), which was realized by the CEL language of CFX, and the total volume flow rate of gas phase and liquid phase keeps constant

To resolve the real flow patterns in the transient process of numerical simulation, the time step has been adjusted to Δt = 0.00114 s, which means the impeller has been iterated 30 times per revolution. The time that the impeller rotates 30 circles was defined as total time, so the gas volume fraction β will increase from 0.01 to 0.21 in the transient process. The previously used grid is used again for the transient simulation and the steady result is selected as initial value in the transient simulation.
The pressure coefficient Cp is used to describe pressure characteristics during the period of transient variation of gas quantity, and Cp is defined by formula (4)

Figure 8 shows the transient pressure on inlet and outlet of the mixed-flow pump in the process of gas quantity variation. Two typical monitoring points (P1 and P7) are selected, respectively, on the inlet and outlet to demonstrate the pressure characteristics. The pressure fluctuates in the whole transient process but the amplitudes of both P1 and P7 are small. This is because the two monitoring points are far away from the rotating impeller and the flow pattern is less influenced by the rotor–stator interaction. The pressure of P1 nearly keeps constant in the range of 2% < β < 10% and then increases like a straight line until the end of the transient process. The pressure of P7 drops down a little before β = 5% and then almost remains unchanged to β = 15%, after that it decreases quickly. As we know, the pump head is calculated by formula (5), so the pressure difference of P7 and P1 determines the head directly. From Figure 8 it can be concluded that the head of the mixed-flow pump shows slight decline in the low gas volume fraction (β < 10%), while it decreases sharply in the high gas volume fraction (β > 10%). The pump head reduces with the increasing gas quantity in a certain range

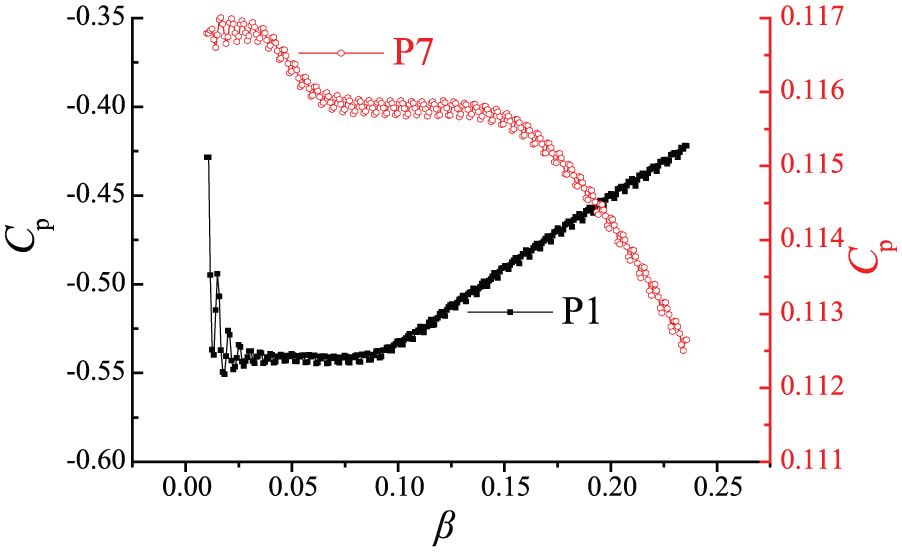
Transient pressure on inlet and outlet of the pump.
Two monitoring points (P2 and P5) in the middle part of blade are selected to investigate the pressure characteristics of the blade: one is on the pressure side and the other is on the suction side. The pressure of P2 is much larger than P5 and the pressure fluctuation amplitude of P2 is also greater than P5 in the whole transient process, as shown in Figure 9. It has obvious periodicity of pressure fluctuation of P2, which means the pressure side of the blade is affected more easily by the rotor–stator interaction. In addition, the pressures of both P2 and P5 increase from β = 10% to the end of the transient process, so the inlet gas quantity has same influence to the pressure of both sides of the blade.
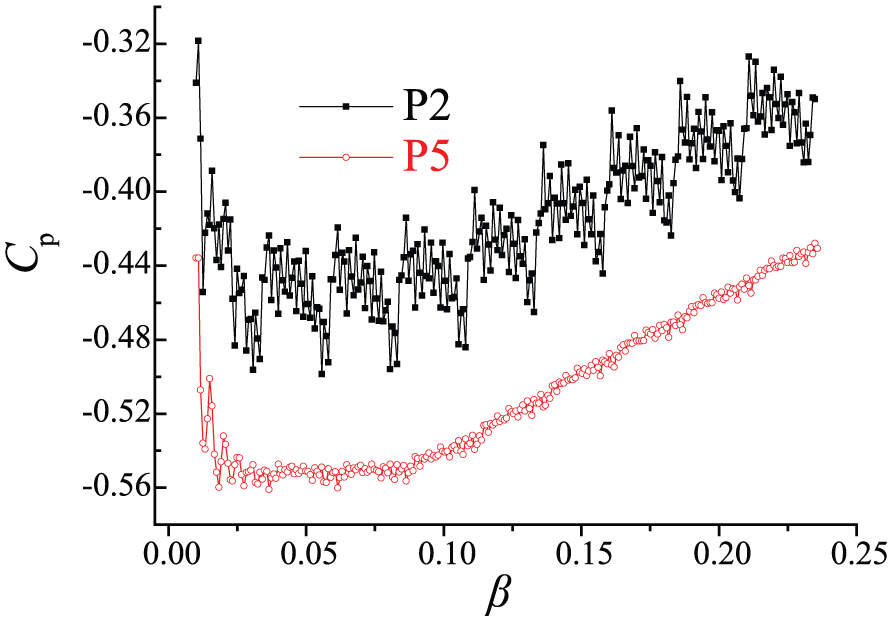
Transient pressure on pressure and suction sides of the blade.
Figure 10 shows the pressure fluctuations of impeller outlet and diffuser outlet in the whole transient process of gas quantity variation. P3 locates on the middle part of impeller outlet and P4 locates on the middle part of diffuser outlet. It can be seen clearly that, as the gas quantity raises, the pressure of impeller outlet increases while the pressure of diffuser outlet decreases. The pressure of P3 starts to raise from β = 10%, but it starts to decrease nearly from β = 12.5% of P4. The main reason for P3 and P4 start to change at different gas volume fractions is that it takes some time for the gas flowing to the outlet of diffuser in the transient process, and the gas volume fraction increases a small amount during this short period. Here, the outlet of impeller is also impacted by the rotor–stator interaction strongly, which can be obtained from the pressure fluctuation periodicity of P3 in Figure 10.
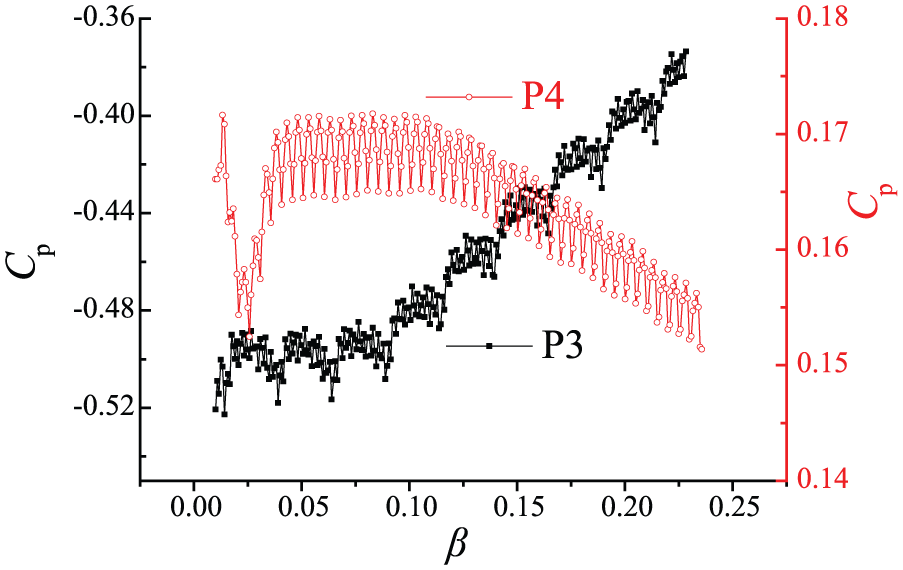
Transient pressure on inlet and outlet of the diffuser.
A typical monitoring point P6 in the pump case is selected to reveal the pressure characteristics of one part in the pump case in the transient process. From Figure 11, it can be found that the pressure of P6 fluctuates at a certain range in the transient process but the average pressure is almost not changed before β = 12.5%. The pressure of P6 decreases sharply with a straight line trend when the gas volume fraction increases from β = 12.5% to the end of the transient process. On the other hand, because the monitoring point P6 is far away from the interface between the impeller and the diffuser, the pressure of P6 is less influenced by the rotor-stator interaction.
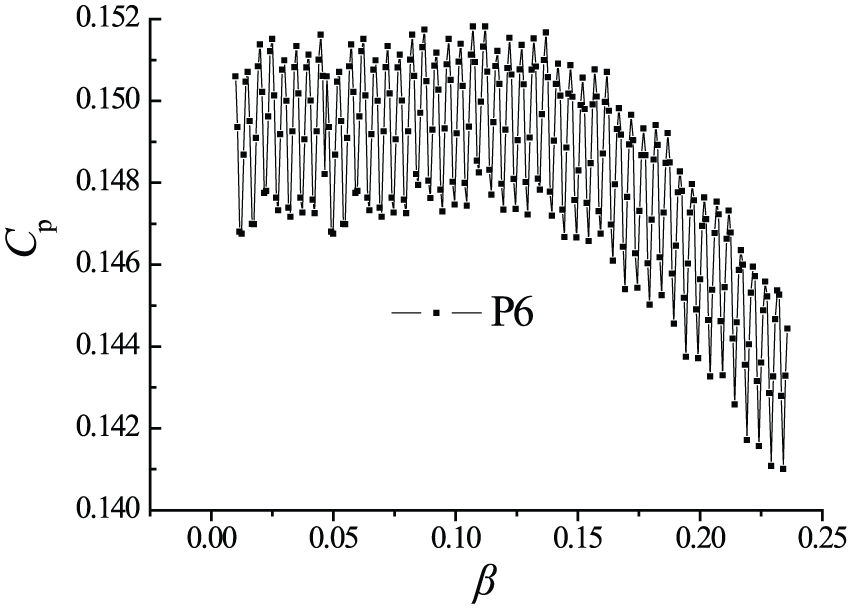
Transient pressure on the pump case.
Experimental results and discussion
The test is carried out in Jiangsu University according to National Grade 2 Precision of China. The precision standard of grade 2 is given in Table 3 and the test rig is shown in Figure 12. The flow rates of gas and water were measured by two kinds of turbine flow meter, and both of them have 0.5% measurement uncertainty. The pressure in the inlet and outlet was measured by pressure sensors, whose uncertainty is 0.1%. An integrated measuring instrument platform was used to acquire the test data with ±0.5% uncertainty in the test and the similarity laws are applied to obtain the final test data.
Test precision standard of grade 2 in China.


Test rig of the mixed-flow pump.
A compressor was used to import 1.0 MPa gas continuously to the system and a reduction valve was applied in the gas pipe to control the inlet gas quantity. The test rig includes the gas loop and the water loop, and the two loops can operate together and separately. When the gas loop is closed, it can be used to do the hydraulic performance test. When the two loops are opened, the gas and the water enter the pump system with the two-phase flow measurement.
Figure 13 shows the comparison between the calculated and measured performance curves of the mixed-flow pump. The head and efficiency, which are defined by equations (5) and (6), are used to describe the performance of the mixed-flow pump. About 3%–5% deviation can be seen between the measured head and the calculated head, and about 2%–8% deviation can be seen between the measured efficiency and calculated efficiency for the whole flow rate range. The main reason for that deviation is that the mechanical loss and some partial loss generate in the test system. Although the deviation exists, it is an allowable error and overall good agreement between the simulation results and the experimental results can be observed


Hydraulic performance.
Figure 14 shows the head comparison among different inlet gas quantities, and large differences on the head at different gas volume fractions can be seen clearly. As the inlet gas quantity increases, the head of the mixed-flow pump decreases instead. When the inlet gas volume fraction increases to 15%, the pump operates with a great unsteady characteristic and the head falls and rises suddenly under about 0.95Qn. The head performance is in agreement with the pressure fluctuation on the mixed-flow pump under transient gas quantity variation process.

Head comparison among different gas quantities.
Conclusion
In this article, the effect of gas quantity on the two-phase flow characteristics of the mixed-flow pump has been investigated comprehensively through numerical and experimental methods. Both results under the steady gas volume fraction state and the transient gas quantity variation process are compared.
Although the hydraulic performance deviation exists between the simulation results and the experimental results, it is an allowable error and overall good agreement can be observed, which can not only validate the accuracy of numerical simulation but also verify the transient pressure fluctuation in the mixed-flow pump. The head of the mixed-flow pump has small decline at the low gas volume fraction state (β < 10%), while it decreases sharply at the high gas volume fraction state (β > 10%) and then the head decreases with the increasing gas quantity.
There is an obvious asymmetric blade vapor density on the blade suction side under each cavitation state and the cavities mainly generate and develop near the leading edge on suction side of the blade. When the gas volume fraction increases, the cavitation area becomes smaller and smaller instead under the same cavitation state. It can decrease the cavitation area obviously by increasing the inlet gas volume fraction within a certain range.
The inlet gas quantity almost has the same effect on pressure tendency of two sides on the blade, but different pressure fluctuation amplitudes of the blade surface are mainly determined by the rotor–stator interaction. According to transient pressure fluctuation characteristics, it has little influence on the internal unsteady flow of the mixed-flow pump when the gas volume fraction is less than 10%. When the inlet gas volume fraction increases to 15%, the pump starts to operate with a great unsteady characteristic.
Footnotes
Appendix 1
Academic Editor: Jianqiao Ye
Declaration of conflicting interests
The author(s) declared no potential conflicts of interest with respect to the research, authorship, and/or publication of this article.
Funding
The author(s) disclosed receipt of the following financial support for the research, authorship, and/or publication of this article: This study is financially supported by the National Natural Science Foundation of China (Grant No. 51379091, No. 51509108), Natural Science Foundation of Jiangsu Province (Grant No. BK20140554, No. SBK2015042921), Postdoctoral Science Foundation of China (Grant No. 156993) and Priority Academic Program Development of Jiangsu Higher Education Institutions (PAPD). The supports are gratefully acknowledged.