
Abstract
The processing map on the basis of dynamic material model has been recognized to be an effective method to evaluate the hot workability of metal alloys. To evaluate the mechanical behavior of TA2 pure titanium, a sets of hot compression tests were conducted on the TMTS machine in the temperature range of 800°C–1000°C and the strain rate range of 0.01–10 s−1. Then, the processing map is constructed from the strain–stress data with the strain of 0.25, 0.4, 0.55, and 0.7. The fact that the strain will not impact the workability obviously for the little change of the stable regions of the processing maps in different strains was discussed. Finally, an overall consideration was given in the processing maps and the optimized workability of TA2 should be within the strain rate range of 0.5–1 s−1 and temperature range of 900°C–925°C.
Introduction
High ratio of strength to weight, excellent resistance in corrosion environments, and good mechanical performance are the major remarkable characteristics of titanium alloys. TA2, as a typical pure titanium, shows good mechanical performance in high-temperature environment,1–3 which has been widely used in space industry, military industry, and other fields. 4 In recent years, the various manufacturing processes, for example, casting 5 and laser forming, 6 are used to produce the titanium alloy components. However, the productivity cannot be accepted for mass production as well as the mechanical performance. Thus, the bulk forming processes, for example, forging, hot rolling, and extrusion, are proposed to improve the productivity. 7
Workability, as an important parameter in bulk forming processes, represents the ability of the metal alloys to deform without defects or fractures within the wide ranges of temperature, strain rate, and strain. In general, the workability consists of state of stress (SOS) workability and intrinsic workability,8,9 where the former is determined by the shape of deformation region as well as the imposed stress state in different forming processes. The intrinsic workability is to consider the microstructure evolutions in the forming process that are largely depended on the temperature, strain rate, and strain and can be evaluated by the approach of processing map that is derived from the dynamic material model (DMM). 10 The DMM model was first proposed by Prasad et al. 11 in 1984 and revised by Gegel et al. 12 However, the strain sensitivity of strain rate is not related to the temperature in the above-mentioned models and it is not so reasonable to describe the flow behavior of metal in hot forming. 8 Therefore, Murty et al. 13 proposed a modified model to give a dynamic strain sensitivity of strain rate (so-called m values) depending on the change in temperature, strain, and strain rate. Nowadays, the processing maps have been widely used to evaluate and optimize the intrinsic workability.
In this work, the intrinsic workability of TA2 pure titanium alloy in high temperature is studied using the processing maps under different strain rates. With the help of processing maps, the trial-and-error methods are discarded to save the expenditure and time for improving the productivity in bulk forming of TA as well as the yield rate.
Basics of the processing maps
Based on the DMM, the workpiece under processing can be considered as a power dissipater. 8 Hitherto, the DMM can describe the dynamic recovery (DRV) and dynamic recrystallization (DRX) behavior in hot deformation on the angle of energetics. The processing maps are based on the DMM and make it possible for people to predict the workability of the material.
The total power dissipated (P) in forming process can be divided into power dissipater content (G) and the power dissipater cocontent (J). G and J are represented plastics converted into viscoplastic heat or became lattice defects in workpiece, and f microstructure evolution such as DRX or internal crack, respectively.
14
The total power dissipated is related to strain

From the DMM model, the strain sensitivity strain rate (m) can be obtained by partial derivative of G and J
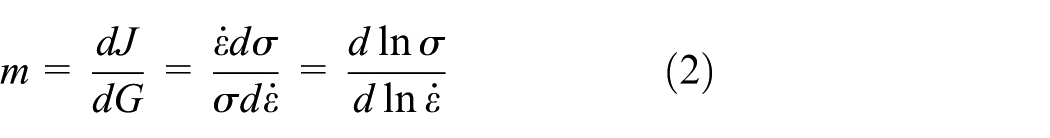
For a linear dissipation process, m = 1, which means J will reach its maximum value

The efficiency of power dissipation in DMM is defined by

In Prasad’s criterion, the strain rate and temperature are constant. Also, the flow stress should obey the following equation

The efficiency of power dissipation (η) can be simply calculated by

The criterion of the flow instabilities based on the principle of material maximum rate of entropy is given by

However, in Murty’s criterion, the strain sensitivity strain rate (m) will vary with the change in temperature, strain, and strain rate for most of alloys to obtain a more precise result. So, the efficiency of power dissipation is defined by

The stable flowing region is derived from the maximum rate of power dissipation considerations by material systems and experimental observations can be defined when

Also, the m values should be in the range of

The forming process will be stable when the process follows the above requirements. Between the above two criteria, Murty’s criterion is proved suitable for titanium and its alloys. 13 So, it was used in this work to make the processing map and identified the workability of TA2 pure titanium in hot processing process.
Material preparation and experiments
In this work, the ingredient of TA2 specimens is as follows (in wt %) 0.30 Fe, 0.10 Si, 0.10 C, 0.05 N, 0.25 O, 0.0015 H, and balance Ti. The specimens were made into cylinder with 12 mm in diameter and 18 mm in height. And axisymmetric compression (ASC) testing was used in this work to reflect the stress change with strain under various strain rates and temperatures on a computer-controlled servo test TMTS machine where the experiments of metal behavior in dynamic hot deformation are implemented with high precision, repeatability, and stability.
Figure 1 shows the microstructure of as-extruded TA2 pure titanium with an α-phase structure and second-phase precipitates. This figure shows the grains with the average grain size of approximately 15 µm. To achieve the desired mechanical properties of the final products, the understanding of microstructure evolution of workpiece in the forging process is essential. Therefore, how to find a way to predict and analyze the microstructure evolution and deformation behavior of TA2 alloy in the forging process under different forging conditions, including different strains, strain rates, and deformation temperatures, is an important issue.

Optical microstructure of as-extruded TA2 pure titanium.
In our experiments, the specimens were put into TMTS and heated to the temperature of 800°C, 850°C, 900°C, 950°C, 1000°C, and 1050°C. Then, the specimens are lubricated and compressed with a constant strain rate of 0.01, 0.1, 1, and 10 s−1.
Results and discussion
Strain-rate sensitivity in TA2
The strain-rate sensitivity can be evaluated by m value which shows great importance in the process of metal forming in titanium alloys. m values vary in different temperature, strain, and strain rate in single forming process. 15 The variation of m values represents different transition mechanisms in hot deformation process. In previous research, 16 the change of m value may indicate the occurrence level of non-basal slip. In the previous experiment, the true stress–strain curves under different strain rates of 0.01, 0.1, 1, and 10 s−1 were shown in Figure 2 to explore the relationship between stress and strain rate. A third-order polynomial was used to fit the curve of stress and strain rate in log scale with the non-linear relationships in Figure 3. Then, the m value was calculated separately by equation (2) with the data of stress and strain rate in the temperature of 800°C, 850°C, 900°C, 950°C, 1000°C, and 1050°C and the strain rate of 0.01, 0.1, 1, and 10 s−1.

True stress–strain curves of TA2 under the temperature of 800°C, 850°C, 900°C, 950°C, and 1000°C, with strain rates (a) 0.01 s−1, (b) 0.1 s−1b, (c) 1 s−1, and (d) 10 s−1.

Stress and strain rate in log scale under temperature from 850°C to 1000°C at true strain (a) 0.25, (b) 0.4, (c) 0.55, and (d) 0.7.
It is noticed that the m value representing the strain-rate sensitivity is related to the mechanisms of transfer and deformation of the unit cells in alloys. In the processing of the deformation of the unit cells, basal slip and non-basal slip are the two major mechanisms. However, the previous researches reported the non-basal slips rather than the basal slips have the fair probability to determine the m value in the deformation process 17 because most experimental results reflected that the number of basal slip is constant at different temperatures. The m value varies with the change in temperature in Figure 4(a)–(d), which suggests that the non-basal slip is the domain reason of the change in m value with different temperature in the deformation processing of TA2 alloy. There is a negative m value region in Figure 4(a), which suggests that dynamic strain aging (DSA), shear band deformation, and deformation twinning occurred with the decreasing of stabilities.18–20

m value with different temperatures and strain rates at true strain (a) 0.25, (b) 0.4, (c) 0.55, and (d) 0.7.
Power dissipation efficiency maps
The power dissipation efficiency maps are presented in Figure 5(a)–(d) obtained at strains of 0.25, 0.4, 0.55, and 0.7. In this work, the η value, which represented power dissipation efficiency, can reflect the rate of microstructure change in the hot deformation process. The lower η value represented the unstable status such as deformation twinning and more fracture while the higher η value may represent the stable factors such as DRV and DRX. Then, by the analysis of the power dissipation efficiency maps, the deformation mechanisms can be inferred. 16 The η value in different conditions can be calculated from equation (6) and the power dissipation efficiency maps can be given by plotting the η value into a temperature–strain plane. From equation (6), the negative m value leads to the negative η value in the power dissipation efficiency maps. And the regions with negative η value can be considered the unstable flow of alloy material in the hot deformation process, in which the workability of materials will decrease dramatically.

Power dissipation maps for TA2 alloy at the true strain (a) 0.25, (b) 0.4, (c) 0.55, and (d) 0.7.
In Figure 5(a)–(d), it can be seen that the strain will slightly effect on power dissipation efficiency maps. On the opposite, the synthetic action of temperature and strain rate will lead to the varieties of η value. When the temperature is between 800°C and 860°C while the strain rate between 0.01 and 0.03 s−1, the power dissipation efficiency maps show almost the same η value and remain high in different strains. Also, with the strain rate increase from 0.03 to 10 s−1 under the temperature between 800°C and 860°C, the η values are steady for little changes. But when the temperature rises to 860°C–960°C, the η value will no more be constant, and with the increase in strain rate, it will rise first and then drop. With the temperature rising over 960°C, the η value will be steady again while the strain rate changes.
The processing maps
The instability maps based on the instability criterion in DMM theories were introduced to obtain the processing maps in Figure 6. Equation (7) was used to get the ξ value which characterized the unstable flow in metal deforming process when ξ ≤ 0. The gray region in Figure 5(a)–(d) means that negative ξ value is generally considered when flow instabilities occurred and localized deformation is caused.

Processing maps for TA2 alloy at the true strain (a) 0.25, (b) 0.4, (c) 0.55, and (d) 0.7.
In previous researches, lower m value represented that fewer deformation mechanics coexist in the process of deformation, which also means the material shows less workability in certain conditions of temperature, strain, and strain rate. Nevertheless, higher m value does not mean easier for alloys to process, and complicated factors coacted in the processing procedure. The comprehensive comparison of these above three ingredients should be used in this work. Based on the strain rate sensitivity (m value), the power dissipation value (η value) and the instability criterion (ξ value) were combined to make the processing maps out to give a more credible criterion to judge the workability of alloys in hot deformation process.
In the processing maps of Figure 6(a)–(d), the gray regions show the stable areas when processing the alloys. In Figure 6(a) and (b), at the strain of 0.25 and 0.4, there are three regions suggesting unstable metal flow limited by the section lines, the total unstable region is almost one-third of stable areas. And in Figure 6(c) and (d), at the strain of 0.55 and 0.7, there are two regions suggesting unstable metal flow limited by the section lines, the total unstable region is almost quarter of stable areas. It can be inferred that with the strain increase, more slip systems and mechanics of deformation were active by the energy yielded in the process to stabilize the procedure of hot forming. Also the DRX will stop the accumulation of strain, formation of inter-crystalline cavity, twinning and triple junction (wedge) cracking, or shear bands which increase the instability features. 16
A comprehensive consideration was made combining the power dissipation value and the instability criterion to give a more credible judgment in Figure 6. Areas limited by line of dashes with ξ > 0 and higher η value are considered the safe domains with the occurrence of dynamic restoration, like DRX and DRV.
There are three safe domains at the strain of 0.25 and 0.4 in Figure 6(a) and (b) and two larger safe domains at the strain of 0.55 and 0.7 in Figure 6(c) and (d). So the whole area of safe domain is related to the strain. From the true strain of 0.25 to 0.55, the area increases with the deformation process. However, the safe domain shrinks a little when the strain changes from 0.55 to 0.7.
Conclusion
Hot deformation is a complex process with slip, twinning, and dynamic restoration. In this work, processing map was used to analyze the behavior of hot deformation of TA2 alloy. The noticeable results are listed below:
The processing maps for two different criteria were compared to give a more credible judgment on the stabilities in hot deformation process. The feasibility of Prasad’s criterion and Murty’s criterion is discussed. Murty’s criterion is finally chosen for the consideration of temperature change.
The contour maps of m value represented strain-rate sensitivity were given to conduct the possible reasons of the change of m value. In the strain of 0.25, when the strain rate is between 0 and 1 s−1 and the temperature is between 800°C and 850°C, the workability is poor for the negative m value which means more likelihood of occurrence of DSA, shear band deformation, and deformation twinning.
The contour map of η value represented power dissipation efficiency were plotted to give a criterion to identify the stable and unstable region in different deformation conditions. And the effect of negative m value to power dissipation efficiency and stabilities were discussed. An overall consideration is implemented among Figure 5(a)–(d) and the region in the temperature of 880°C–940°C and the strain rate between 0.01 and 0.06 s−1 shows the lower η value in different strain. The lower η value regions also mean bad workability.
The processing maps of TA2 alloy were developed to identify the stable and unstable regions in hot deformation process. And the change tendency of stable areas with the change of true strain were disused and a convincing mechanism was proposed. Finally, the process condition under the temperature between 850°C and 1000°C and the strain rate between 0.07 and 5 s−1 in different strain always shows better workability in hot deformation processing. So in this region the metal is stable which means the less occurrence likelihood of fracture and the occurrence of DRV and DRX. With the occurrence of DRV and DRX, the grain size will be refined and better material performance will be obtained.
Footnotes
Academic Editor: M Ravichandran
Declaration of conflicting interests
The author(s) declared no potential conflicts of interest with respect to the research, authorship, and/or publication of this article.
Funding
The author(s) disclosed receipt of the following financial support for the research, authorship, and/or publication of this article: This work was fully funded by National Natural Science of China (NSFC) under the grant nos 51345013 and 51405044.