
Abstract
Tungsten inert gas welding and vacuum brazing butt joints of Al–Mg–Si alloy 6061 in the artificially aged condition T6 were studied. Constant amplitude and variable amplitude fatigue loading tests were performed. The experimental S-N curves were compared with the fatigue design curves recommended by the International Institute of Welding, British Standard, and Eurocode 9. Two mean stress correction methods, Goodman and Gerber, were evaluated. In terms of the size effect on the fatigue life, this article proposed an innovational thickness correction method based on the ratio of the ultimate tensile strengths of specimens with different thickness. For vacuum brazing components, the tensile strength–based thickness correction method was better than the thickness correction methods recommended by the International Institute of Welding and Eurocode 9.
Introduction
Recently, environmental problems and concerns about energy consumption have led to the increasing use of aluminum alloys in the automobile, aerospace, and other industries. In particular, 6000 series aluminum alloys have been studied extensively because they have better strength, weldability, corrosion resistance, and cost less than other aluminum alloys.1,2 AA 6061 is one of the most versatile of the heat-treatable alloys and popular for medium-to-high strength applications. It has a wide range of applications such as in transportation components, medical equipment, and national defense products.
Butt welding has numerous advantages such as good connection efficiency, easy workmanship, and weight reduction.
3
The wide range of application of butt welds in various structures provides researchers a large scope for analyzing their behavior under various loading conditions.
4
The frequently preferred process for welding aluminum alloy is tungsten inert gas (TIG) welding owing to its relative simplicity and cost. However, this process causes grains to coarsen in the fusion zone, distortion, hot cracking, and residual stresses. Vacuum brazing (VB) can eliminate the disadvantages of TIG welding. It is performed at
Fatigue is an important issue for welded structures subjected to cyclic loading. 5 However, welded joints exhibit poor fatigue properties. In welding techniques, failure is a key problem that is related to the stability and safety of the welded structure. 6 The fatigue properties of welded structures are function of welding material, shape of the welded structure, radius of weld toe, weld angle, height of the reinforcement, and welding quality.7–10 With respect to the studies on the fatigue in aluminum alloy weldments, most literature discussed the fatigue behaviors of weldments prepared by the molten welding methods, such as inert-gas metal-arc welding, 11 TIG welding,12–14 and friction stir welding.15–19 Few studies investigated the diffusion-bonding weldments.
Several associations classify aluminum alloy weldments into different categories based on joint geometry and load type. Many related experiments have been performed. The experimental data yield the stress–life relationship of each category, and design specifications are established. Research into fatigue culminated in such design specifications as British Standard (BS) 8118:1991, 20 Eurocode 9:2007, 21 and International Institute of Welding (IIW). 22
Due to the complexity of the materials used and local geometry of welded structures, inadequacies exist when performing fatigue design according to the existing specifications of aluminum-welded structures. This study investigates the fatigue behavior of 6061-T6 aluminum alloy butt welded by TIG welding and VB. Fatigue tests were performed using constant and variable amplitude loadings. The results of fatigue tests were compared with fatigue design specifications of Eurocode 9, BS 8118, and IIW and could provide the designer with the amendments for fatigue design required in the proposal. The following two problems were also considered in this study:
Differentiation between VB and TIG welding;
The influence of thickness and the variable amplitude loading on the fatigue life.
Experimental methods
The material used in this research was Al–Mg–Si alloy (AA 6061-T6). Rolled aluminum alloy plates with thickness of 6 and 12 mm were jointed, respectively. TIG-welded joints were fabricated in a single-V butt joint configuration as shown in Figure 1. The ER5356 filler rod was used in the TIG welding process. Highly pure argon was the shielding gas. Multi-pass welding was conducted to fabricate the joints. Figure 2 shows the butt joint configuration of VB. The BAlSi-4 filler and nitrogen cooling gas were used in the VB process. The direction of welding was normal to the rolling direction. All necessary care was taken to prevent join distortion and the joints were made after the sheets were clamped. The welded plates were milled to a thickness of 4 or 10 mm, respectively.
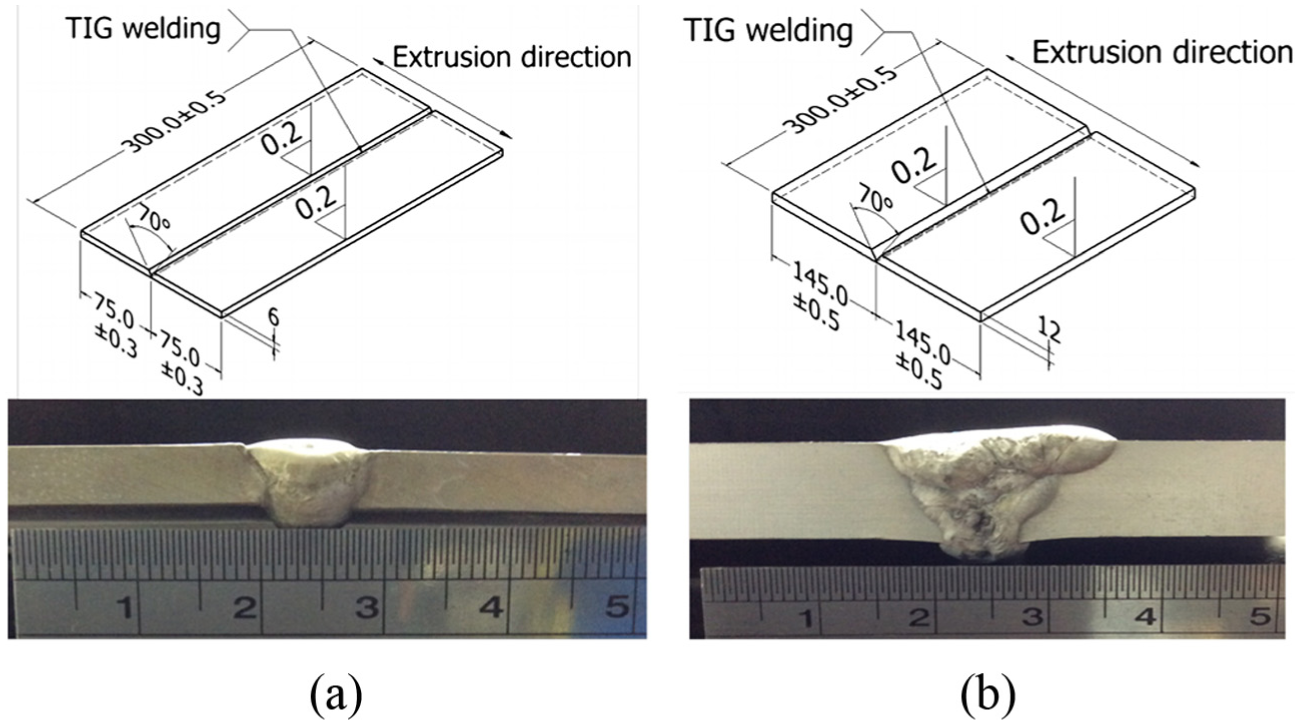
Configuration of single-V butt joint for TIG welding: (a) 6 mm and (b) 12 mm (all dimensions in mm).

Configuration of butt joint for vacuum brazing: (a) 6 mm and (b) 12 mm (all dimensions in mm).
Table 1 presents the chemical compositions of the base metal and weld metals. Table 2 lists the tensile properties of the base metal. The process parameters of VB as shown in Table 3 were optimized in our previous study. 23
Chemical compositions of the base metal and weld metals (wt.%).

Tensile properties of the base metal.

Process parameters of vacuum brazing.

Optical microscope images were captured from the cross sections of the weldments. After the specimens were cut, they were cold-mounted and then mechanically ground and polished. After polishing, the specimens were etched using Keller’s reagent. Deionized water and ethanol were subsequently used to neutralize the specimens. All samples were then cleaned for 20 s in an ultrasonic bath using ethanol, dried, and placed in a desiccator until they were analyzed using a microscope.
In order to characterize the welded joints, Vickers hardness across the welded joint cross section was obtained using a microhardness tester, with an indentation load of 0.05 kgf, according to the ASTM E384 standard. The microhardness was measured from the center of the weld bead to both sides until microhardness was stabilized. The interval of measurement was 0.1 mm for VB specimen and 1 mm for TIG welding specimen.
Tensile and fatigue properties of the 6061-T6 plates in the transverse direction were evaluated. The tests were carried out according to ASTM E8 and ASTM E466 standards, respectively. Configurations of the tensile and fatigue specimens are shown in Figure 3.
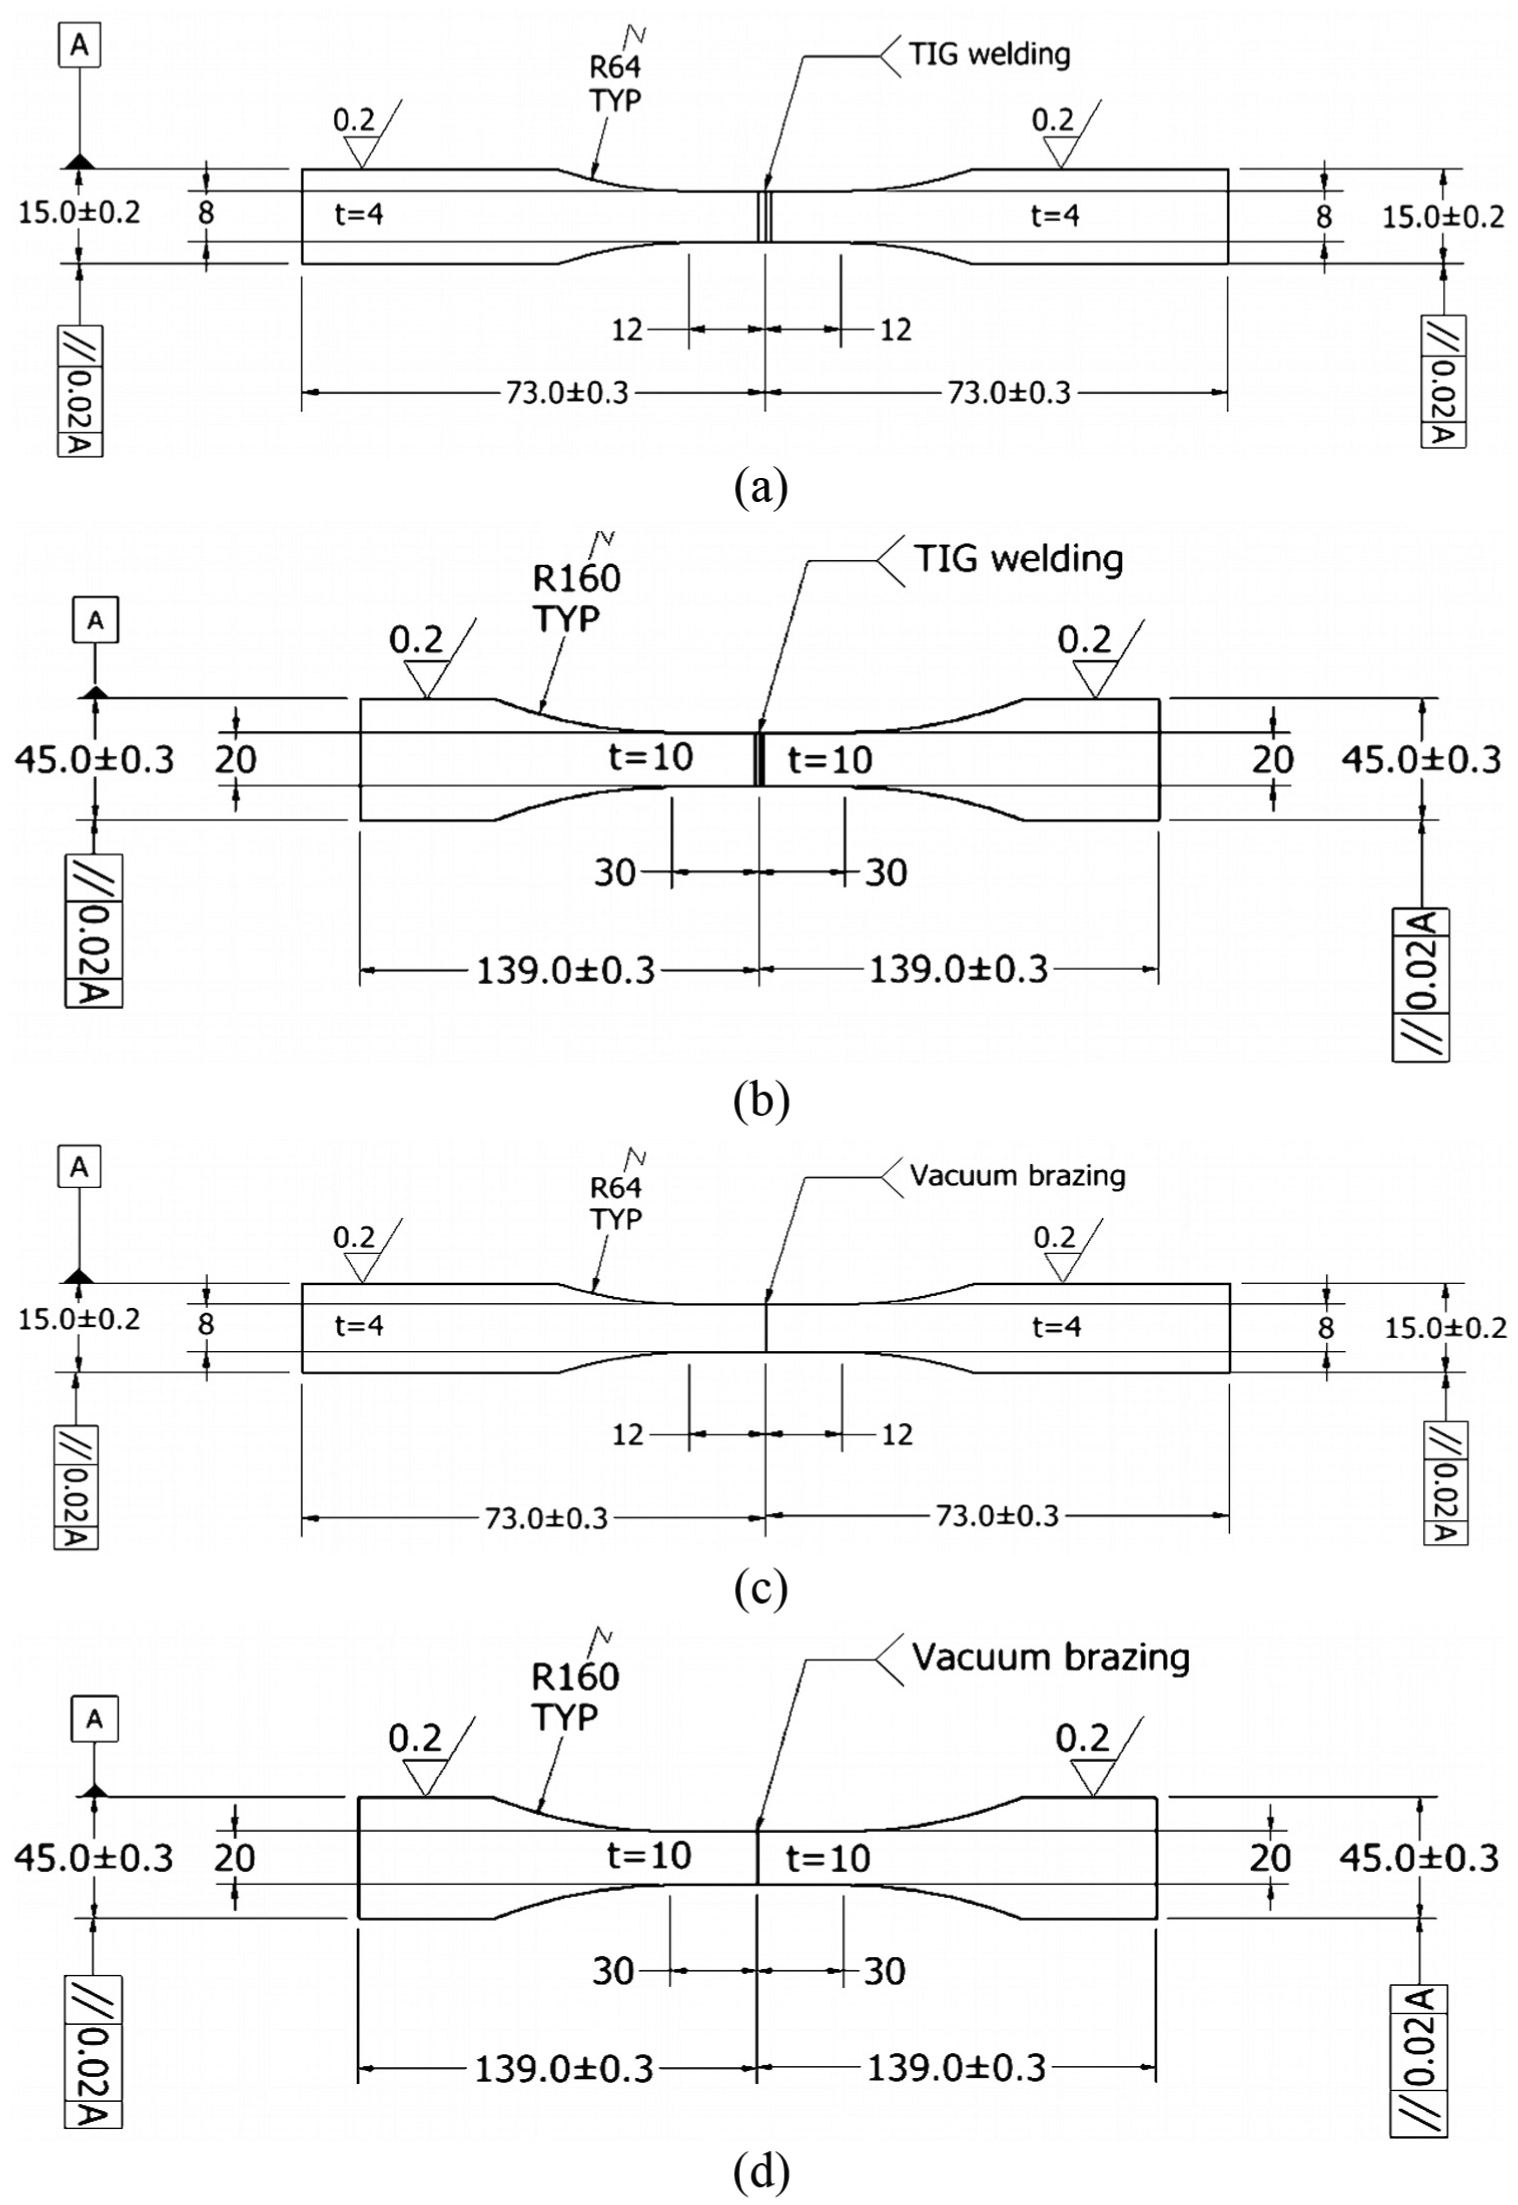
Dimensions of fatigue and tensile specimens: (a) 4 mm (TIG welding), (b) 10 mm (TIG welding), (c) 4 mm (vacuum brazing), and (d) 10 mm (vacuum brazing) (all dimensions in mm).
The deformation of the tensile specimens was measured using an extensometer. The specimen finally failed after necking, and the load was recorded as a function of displacement. Axial fatigue tests were carried out at room temperature with a servo-hydraulic machine at a frequency of 10 Hz and a stress ratio of R = −1. Before the fatigue tests were performed, the specimen surfaces were polished in the loading direction using emery papers with a grade up to 1000.
In order to discuss the influence of thickness correction and mean stress, this study conducted variable amplitude fatigue testing on weldments with thickness of 4 and 10 mm. The transmission (TRN) history developed by the American Society of Automotive Engineers (SAE) was adopted. This history contained predominantly tensile loadings along with significant compressive loads. It has been normalized and has a maximum value of 999. As most signals in the transmission history have small fluctuations, they had little effect on the fatigue life. Accordingly, the signals with small amplitudes could be ignored to reduce significantly the length of transmission history. The racetrack-counting method could condense and reveal significant events in a complex reversal history. For this procedure, a racetrack width(s) must be defined first. Only reversal points at which a racer would have to change from upward to downward or vice versa are counted. In this study, the racetrack width was set to be 40% of the greatest range of the history. The reduced history had 130 reversal points as shown in Figure 4. We adjusted the scale of the condensed transmission loading course to the desired level before each variable amplitude fatigue test.

Condensed SAE transmission history.
The rainflow-counting method was adopted to count the number of cycles of each stress range in the fatigue analysis. Dowling 24 demonstrated that the rainflow-counting method accurately identified closed hysteresis loops in a variable amplitude histogram.
Miner’s rule had been developed to estimate the accumulation of fatigue damage of metals subjected to a cyclic loading with varying amplitudes. The failure criterion is

where ni is the number of cycles at stress level Si, Ni is the fatigue life in cycles at stress level Si, and C is the critical damage value which is selected on a knowledge of the load history or on a desired factor of safety. The C value is usually assumed to be 1 for random and pseudo-random histories. In this study, C was equal to 1.
Results and discussion
Microstructures
As TIG welding requires a large local heat input and provides a low welding rate, it easily produces high temperature in the weld bead and expands the heat-affected zone (HAZ). Figure 5(a) and (b) shows the microstructures of a TIG weld bead and the HAZ, respectively. The grains grew in the 6061-T6 weld bead and the HAZ. The precipitates in the HAZ gradually concentrated to the grain boundary and grain center.

Optical micrographs of TIG weldment: (a) weld bead and (b) heat-affected zone.
VB is a heating method that uses radiation and allows uniform heating and automatic temperature control. It can prevent local overheating and the formation of a HAZ. In this method, the deformation of the workpiece and the residual stress is minimal. Figure 6(a) and (b) displays the microstructures of a brazing bead and the base metal, respectively, after VB. Unlike TIG welding, VB resulted in no obvious variations among brazing bead, HAZ, and base metal. In Figure 6(a), many inter-metallic compounds surround the diffusion layer of the brazing bead after the filler metal elements diffused toward the base metal. According to Figure 6(b), since the temperature in the VB process was high and maintained for over an hour, most of the precipitates were solid dissolved. After quenching with nitrogen gas, the solid solution formed a supersaturated phase, and then, a small quantity of precipitates was generated through natural aging.
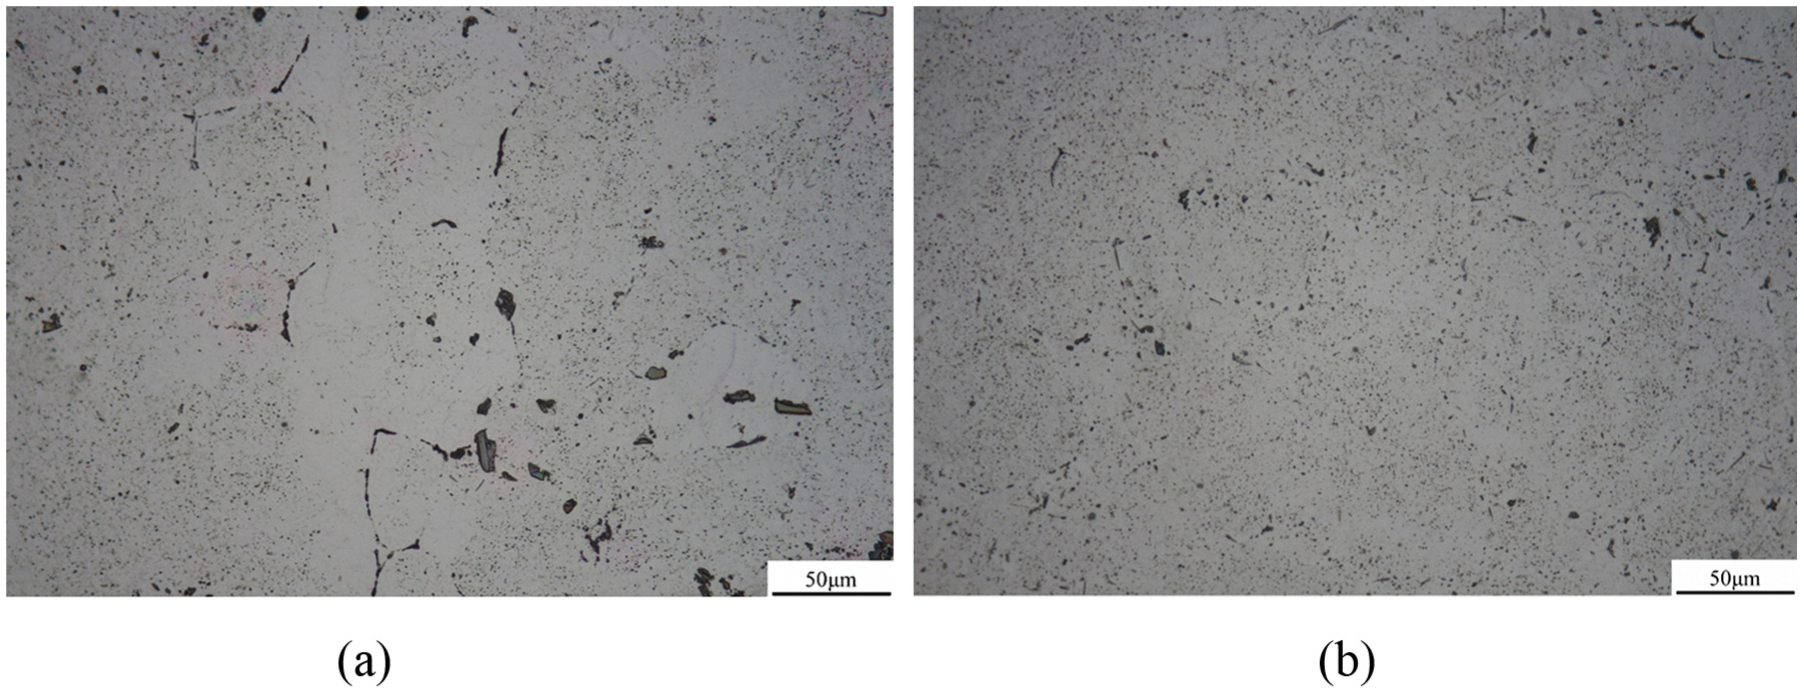
Optical micrographs of vacuum brazing specimen: (a) weld bead and (b) base metal.
Microhardness
The microhardness test was conducted at the welding surface of the specimen. Figure 7(a) and (b) plots the microhardness distribution achieved by TIG welding and VB, respectively.

Microhardness profile across the weld: (a) TIG weldment and (b) vacuum brazing specimen.
Figure 7(a) shows that under the influence of a local high temperature in TIG welding, the area with the lowest microhardness was the HAZ with a microhardness value of HV50. The microhardness of the base metal was HV100. The HAZ extended to approximately 22 mm to the left and right of the weld bead. The microhardness distribution along the two sides of the weld bead was asymmetric because the TIG welding specimen was prepared using a two-pass method. During the second pass, the first weld bead was reheated, causing annealing, thus reducing the microhardness.
In Figure 7(b), no clear HAZ was observed because the weldment was heated to a uniform temperature in a vacuum, so local overheating did not occur. The rapid cooling and partial coarsening of precipitates reduced the microhardness of the base metal from HV100 to HV65, which was close to the microhardness of the HAZ in TIG weldment.
Tensile properties
Table 4 presents the tensile properties of two types of AA 6061-T6 weldments. Three specimens were tested for each type of joint. The averages and standard deviations of tensile properties are given in Table 4. Tensile strength of the base metal was 306.7 MPa, and that of the TIG welding joint was 174 MPa, which was 56.7% of the strength of the base metal. The tensile strength that was achieved by VB was 177 MPa, which was 57.7% of the strength of the base metal. This experimental result indicated that 6061-T6 had the same tensile strength in both VB and TIG welding, because it was a heat-treatable aluminum alloy. When the VB temperature elevated to 600°C, and rapidly cooled using nitrogen gas, precipitation hardening occurred, improving the mechanical properties of the weldment.
Tensile properties of different AA 6061-T6 weldments.

TIG: tungsten inert gas.
For TIG welding, local high temperature molten welding minimized the tensile strength of the HAZ, causing necking there, and fracture surface was classified as ductile as shown in Figure 8(a). In VB, the specimen fractures at the weld toe and the fracture surface did not exhibit obvious necking, so the fracture surface was classified as brittle as shown in Figure 8(b).

Fracture surfaces for tensile specimens: (a) TIG welding and (b) vacuum brazing.
The tensile strength of the 10-mm-thick VB specimen was 195.5 MPa, which exceeded that of the 4-mm-thick VB specimen, because increasing the diffusion-bonding surface improved the mechanical properties. However, the tensile strength of the 10-mm-thick TIG welding specimen was 168.8 MPa, which was less than that of the 4-mm-thick TIG welding specimen, because more welding passes yielded poorer mechanical properties.
Fatigue properties
To obtain S-N curves, seven VB specimens and eight TIG welding specimens were tested. Based on the fatigue strength assessment recommended by the IIW, 22 statistical analysis and processing of fatigue experimental data were performed.
When

where
Parameters for the S-N curve of 4-mm-thick AA 6061-T6.

TIG: tungsten inert gas.
The fatigue design curve of aluminum butt joint was classified as IIW FAT 45, BS 8118 class 42, and Eurocode 9 category 56-7. For effective stress ratios, based on consideration of both applied and residual stresses, R < 0.5 a fatigue enhancement factor f(R) may be considered by multiplying the fatigue class of classified details by f(R)

where R is the stress ratio. When R = −1, f(R) = 1.3.
Figure 9 shows the S-N curves of AA 6061-T6 butt joints processed by TIG welding and VB and the recommended design curves in three specifications. The recommended design curves of IIW FAT 45 and Eurocode 9 category 56-7 had been multiplied by 1.3 in Figure 9. The stress amplitude in the fatigue experiments was 40%–85% of the tensile strength. The linear regression line obtained from experimental data represents 50% survival probability. The experimental S-N curve with 95% survival probability was obtained from the standard deviation shift with Z95. In the higher life region

S-N curves of 4 mm thickness of AA 6061-T6.
Safety factors were evaluated from experimental and design curves
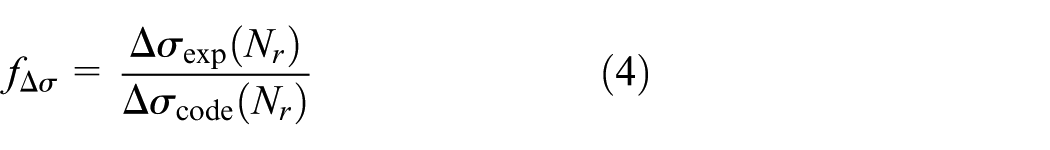
where
Safety factors of TIG and VB specimens are listed in Table 6 and also plotted in Figure 10(a) and (b). The following observations were made:
Safety factor increased with increasing life duration except that obtained from Eurocode 9 in TIG weldment.
Safety factors depended on the welding process. They are higher for TIG weldment than for VB specimen.
For short life duration, safety factors of TIG weldment and VB specimen were below the value of 2 indicated by IIW FAT 45, BS 8118 class 42, and Eurocode 9 category 56-7.
Safety factors for TIG welding and vacuum brazing.

TIG: tungsten inert gas; IIW: International Institute of Welding; BS: British Standard.

Safety factors: (a) TIG welding and (b) vacuum brazing.
Since the HAZ was the area with the lowest microhardness, the rupture of the TIG-welded fatigue specimen occurred in the HAZ, close to the weld bead. Figure 11(a) shows the fracture surface of the TIG weldment, which revealed a large number of smaller dimples mixed with several larger dimples distributed on the fracture surface. The fracture surface of the TIG weldment showed a ductile fracture dominated by dimples due to microvoid coalescence. The rupture of the VB fatigue specimen occurred at the weld bead. Since the cracks grew in the diffusion layer of the weld bead and the bonding surface of the base metal, the thickness of the diffusion layer strongly affected the crack growth. Furthermore, if the welding temperature was maintained for longer, then the diffusion of the weld bead was more complete, and the diffusion layer of the weld was less likely to contain defects. Figure 11(b) shows the fracture surface of VB specimen. The cleavage planes were found on the left side of fracture surface, and the dimples were found on the right side of fracture surface. The fracture surface of VB specimen showed a combination of both ductile and brittle regions.

Fracture surfaces for fatigue specimens: (a) TIG welding and (b) vacuum brazing.
Mean stress effect
Many service load histories have a non-zero mean stress. In this study, the transmission history developed by the SAE in the United States was adopted; the mean stress is tensile. Mean stress correction methods have been developed to eliminate the burden of having to carry out fatigue tests at different mean stresses. Generally, there are many theories used to evaluate the influence of the mean stress. In this article, we employed two theories that are commonly used to modify the prediction of fatigue life under fluctuating loading. Experience has shown that test data tend to fall between the Goodman and Gerber curves. Goodman is usually a good choice for brittle materials and not bounded when using negative mean stresses. Gerber is usually a good choice for ductile materials and bounded when using negative mean stresses


where
The predicted life and experimental life were compared using the S-N curves from the experimental TIG welding and VB data with a specimen thickness of 4 mm, following mean stress correction methods that were carried out using equations (5) and (6), respectively. Figure 12(a) plots the predicted life and experimental life of 4-mm-thick weldments that were prepared by TIG welding. The predicted life made for the 4-mm-thick weldment using the Goodman mean stress correction method agreed closely with experimental life. Figure 12(b) plots the predicted life and experimental life of 4-mm-thick weldments that were prepared using VB. Goodman mean stress correction method also agreed closely with experimental life. As TIG welding was a fusion-bonding method and VB was a diffusion-bonding method, the two types of bonding methods were different. Hence, the resulting tensile and fatigue properties were different, which affected the fatigue life prediction based on the variable amplitude test. As found in Table 4, the elongation of VB specimens was better than that of the TIG welding specimens. In other words, TIG welding specimens were more brittle than VB specimens. Therefore, using the Goodman mean stress correction method to predict the fatigue life of TIG welding specimens would be more accurate.

Comparison between the predicted life and experimental life of 4-mm-thick weldments: (a) TIG welding and (b) vacuum brazing.
As revealed by the above results, for the 4-mm-thick TIG welding and VB specimens of aluminum alloy 6061-T6, under the transmission history, the Goodman mean stress correction method could be used to prediction life achieved using both welding.
Size effect
The fatigue strength of weldments usually decreases due to geometry, residual stress, slag, porosity, surface defect, crack, and HAZ. In the fatigue analysis of weldment, S-N curves recommended by several standards or codes are adopted. Thickness correction is also included in some specifications such as IIW. In this study, we consider the fatigue strength of 4-mm-thick specimen as a reference and check the suitability of different thickness correction methods. The fatigue strengths of welded joints that fail from the weld toe are generally believed to decrease as the plate thickness increases.
26
Recent work has demonstrated that the thickness effect depends on the overall proportions of the welded joint.27,28 These effects are accounted for by the fatigue rules in Eurocode 9. A further refinement in the IIW recommendations modifies the thickness correction exponent p for various welds. Values range from 0.3 to 0.1, reflecting the fact that the thickness correction also depends on the degree of stress concentration that is induced by the welded joint. The lower fatigue strength of thicker members is considered by multiplying the stress range of the structure by the thickness reduction factor

where the reference thickness

The IIW specification provided the above equation, which was applicable to molten welding (TIG). VB was not a molten welding (but was classified as a diffusion bonding), and as the thickness increased, the tensile strength increased accordingly, so the thickness correction equation of the IIW specification was not available. The fatigue strength of aluminum alloy was directly proportional to its tensile strength, so the authors proposed a tensile strength–based thickness correction method. The S-N equation could be expressed as
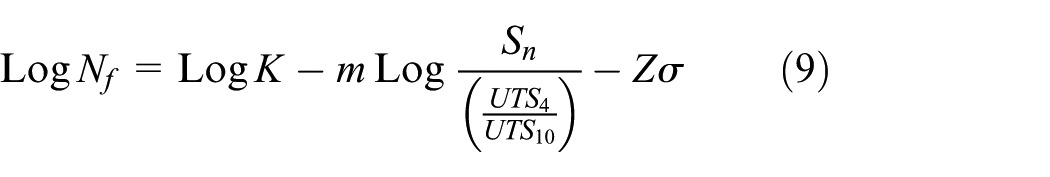
where
According to the experimental S-N curves of 4-mm-thick TIG weldment and 4-mm-thick VB specimen, the thickness corrections were carried out using equations (8) and (9). After the mean stress correction was conducted by re-applying equations (5) and (6), the predicted life and experimental life were compared. Figure 13(a) plots the predicted life and experimental life of TIG weldment, with an applied thickness correction (equation (8)) based on the data from the 4-mm-thick S-N curve. For a 10-mm-thick weldment under the Goodman mean stress correction method, the predicted life agreed closely with the experimental life. Figure 13(b) plots the predicted life and experimental life of AA 6061-T6, processed using VB, with an applied tensile strength–based thickness correction (equation (9)) based on data from the 10-mm-thick S-N curve. As revealed by Figure 13(b), the life predicted using the Goodman mean stress correction method with the tensile strength–based thickness correction was better than others. For the 10-mm-thick weldment, the predicted life agreed closely with experimental life under the Goodman mean stress correction method. The above results indicated that for the 10-mm-thick TIG welding and VB specimens of aluminum alloy 6061-T6, under the transmission history, the fatigue life could be well predicted using the Goodman mean stress correction method.

Comparison between the predicted life and experimental life of 10-mm-thick weldments: (a) TIG welding specimen with IIW thickness correction and (b) vacuum brazing specimen with and without tensile strength–based thickness correction.
The 10-mm-thick S-N curves could be derived via equations (8) and (9) and 4-mm-thick experimental S-N curves. Figure 14 plots the S-N curve for TIG welding that was obtained by applying the thickness correction (equation (8)); the S-N curve for VB that was obtained by applying the tensile strength–based thickness correction (equation (9)). Both curves were compared with those recommended by three specifications. The S-N curves of both TIG weldment and VB specimen following thickness correction were higher than the design curves for the IIW FAT 45, BS 8118 class 42, and Eurocode 9 category 56-7.

S-N curves of 10 mm thickness with corrections.
Conclusion
This study investigated the mechanical properties of AA 6061-T6 weldments processed by TIG welding and VB. Fatigue tests were conducted on TIG welding and VB of butt-welded joints. The effects of mean stress and specimen thickness on the fatigue life were presented. The following conclusions were drawn:
For the TIG weldment, the area with the lowest microhardness was the HAZ. For the VB specimen, no clear HAZ was observed.
TIG welding was a molten soldering method and VB was a diffusion-bonding method. Difference in mechanism between these two joining methods leaded to different size effect on tensile strength. The tensile strength of the VB specimen increased with specimen thickness, whereas that of the TIG welding specimen decreased.
TIG butt joints of AA 6061-T6 achieved higher fatigue strength as compared to the fatigue design curves of IIW FAT 45, BS 8118 class 42, and Eurocode 9 category 56-7. In the lower life region (N = 104–105), it was found that the fatigue strength of VB joint was lower than that of IIW FAT 45, but still higher than those of the BS 8118 class 42 and Eurocode 9 category 56-7.
When a TIG weldment or VB joint of aluminum 6061-T6 was subjected to a variable amplitude loading with tensile mean stress, Goodman method was suitable to modify the mean stress effect.
In terms of the size effect on the fatigue life, the thickness correction method recommended by the IIW with p = 0.1 was applicable to the TIG butt joint of aluminum 6061-T6.
This article proposed an innovational thickness correction method which was based on the ratio of the ultimate tensile strengths of specimens with different thickness. For VB components, the tensile strength–based thickness correction method was better than the thickness correction methods recommended by the IIW and Eurocode 9.
Footnotes
Academic Editor: Filippo Berto
Declaration of conflicting interests
The author(s) declared no potential conflicts of interest with respect to the research, authorship, and/or publication of this article.
Funding
The author(s) disclosed receipt of the following financial support for the research, authorship, and/or publication of this article: This work was supported by the Ministry of Science and Technology, ROC under the contract no. NSC-101-2221-E-008-011-MY3.