
Abstract
This article investigates the interaction between the resin spray and the wood chips in a vapour stream using a multi-phase multi-component computational fluid dynamics approach. The interaction between the spray and the chips is one of the main issues in the industrial process for manufacturing medium density fibre boards. Thus, the optimization of this process can lead to important benefits, such as the reduction in the emission of formaldehyde-based toxic chemicals, the reduction in energy consumption in the blending process and energy saving in the fibreboard drying process. First step of the study is the numerical analysis of the resin injector in order to extend the experimental measurements carried out with water to the resin spray. The effects of the injector’s geometrical features on the spray formation are highlighted under different injection pressure values and needle displacements. Afterwards, the results obtained in the analysis of the single injector are used for the complete simulation of multi-injector rail where the mixing of the resin spray and wood chips takes place. The influence of the main operating conditions, such as the vapour and the wood chip flow rates, on the resin distribution is addressed in order to optimize the resination process.
Introduction
The environmental impact is becoming a leading issue in the research and development path. The environment concern is even more important when the industrial process under investigation is involving substances that may harm human health and nature life. Usually, manufacturers of medium density fibre (MDF) boards use urea-formaldehyde (UF) resin to bind wood fibres. 1 The employment of formaldehyde is a subject of concern in the resin-bonded wood-base panel industry.2–4 The UF resin is applied by means of blowline blending that has the main advantage of eliminating resin spots on the board surface, but it results in lower resin efficiency (or higher resin requirements) than mechanical blending in order to achieve comparable board properties. 5 The resin efficiency for MDF can be defined as the achievement of the desired property of a panel for a given resin content. Thus, the performance of wood fibre–based composites is strongly affected by the resin distribution process onto the wood fibre. 6 On one hand, the improvement in the fibreboard products depends significantly on the capability of the industrial resin deposition system in achieving the optimal distribution or adhesion to the wood fibres. On the other hand, the effective resin distribution on the wood chip cannot be easily determined experimentally since it is difficult to differentiate the resin from the fibre and quantify its presence. 7
Therefore, numerical simulation becomes a valuable tool in assessing the resin distribution on the wooden fibre. During the last two decades, modelling and computer simulation have reached high level of accuracy in predicting complex physics including real geometries typical of industrial processes.8–11 In particular, spray formation can be extensively studied by means of the numerical analysis, 12 and experimental data can be integrated with the simulation results in order to deepen the understanding of the phenomena. 13
This study investigates the resin spray formation in a high-pressure injector and the interaction between the resin jet and the wood chips in a vapour stream. A multi-component multi-phase numerical approach is used in order to predict the resin distribution at the injector outlet as well as within the vapour pipe.
First step of the analysis is the simulation of the injection process in order to predict the resin distribution downstream the component’s outlet and the effects of the main operating parameters such as the fluid properties, pressure and the injector geometry. The numerical results are compared with experimental measurements carried out using water; thus, the behaviour of the resin injection is extended to the real working fluid by means of the numerical simulation.
The resin distribution is then employed in the simulation of the full three-injector rail, and the interaction between the resin and wood fibres is addressed. The influence of the main operating conditions, such as the vapour and the wood chip flow rates, on the resin distribution is addressed in order to optimize the resination process. In fact, the optimization of the resin injection process leads to the reduction of the amount of formaldehyde used in the MDF boards manufacturing, thus reducing the emission of formaldehyde-based toxic chemicals and the energy consumption in the blending process as well as in the drying process
Analysis of the single injector
First step of the analysis is the simulation of the single injector in order to determine the resin spray distribution at the injector outlet. The simulation is carried out by means of the STAR-CCM+ v10.02 code licensed by the CD-adapco, Inc. The numerical approach adopted in the analysis is based on the multi-phase multi-component volume of fluid (VOF) approach since the feature of the physical problem analysed in this article is a transient flow of two immiscible compressible and uncompressible fluids (i.e. air and resin). This part of the analysis is set up to predict the behaviour of the liquid jet in a quiescent volume of air in order to reproduce the experimental measurements carried out by the manufacturer’s R&D test department. The VOF method is adopted to determine the interface between the two fluids as the phase fraction in each computational cell. 14
The VOF model description assumes that all immiscible fluid phases present in a control volume share velocity, pressure and temperature fields. Therefore, the same set of basic governing equations describing momentum, mass and energy transport in a single-phase flow is solved. 15
The equations are solved for an equivalent fluid whose physical properties are calculated as functions of the physical properties of its constituent phases and their volume fractions.
The equations are


where

is the volume fraction and
The conservation equation that describes the transport of volume fractions

where
Turbulence is accounted for by means of the two zonal versions of the k-ω model, known as the shear stress transport model. 16 This approach demonstrated in previous studies a good accuracy in predicting the flow field for multi-phase flows in hydraulic components. 17 The computational domain accounted for in the simulations includes the injector hole, the helical ducts and the injector body comprising the needle and the inlet duct. Downstream of the injector outlet a large plenum is considered in order to represent the open ambient at atmospheric pressure where the liquid spray is forming. The grid is realized by means of the polyhedral mesher available in STAR-CCM+, and the cell reference size in the injection region is set to one-fiftieth of the injector diameter (i.e. 2 mm). Figure 1 shows the computational fluid domain considered in the simulation as well as the grid in the helical and injector nozzle region. The total number of cells used in the computational fluid dynamics (CFD) domain is approximately 3 millions. The mesh used in the simulation is the best trade-off between result’s accuracy and computational effort. Several grid sizes were tested, and the percentage difference in terms of calculated flow rate was within the 0.1% among the different meshes.

(a) Injector geometry included in the CFD analysis and (b) detail of the computational grid in the helical and injector nozzle region.
Bounded central differencing is used for the discretization of the momentum, second-order scheme for subgrid kinetic energy and the mixture fraction. The conservation equations for mass, momentum and energy are solved simultaneously using a pseudo-time-marching approach. The second-order implicit method is used for time integration scheme.
The main target of the CFD simulations is the analysis of the break-up behaviour of the water jet in quiescent ambient. The calculated results are then compared with the measurements carried out in an experimental test rig in order to validate the numerical models. Table 1 lists the operating conditions adopted in the experiments and simulations. A sensitivity analysis of the injection process with respect to different injection pressures and needle lifts is carried out, and the influence of these parameters on the water or resin spray is addressed.
Operating conditions for the experimental measurements and simulations.
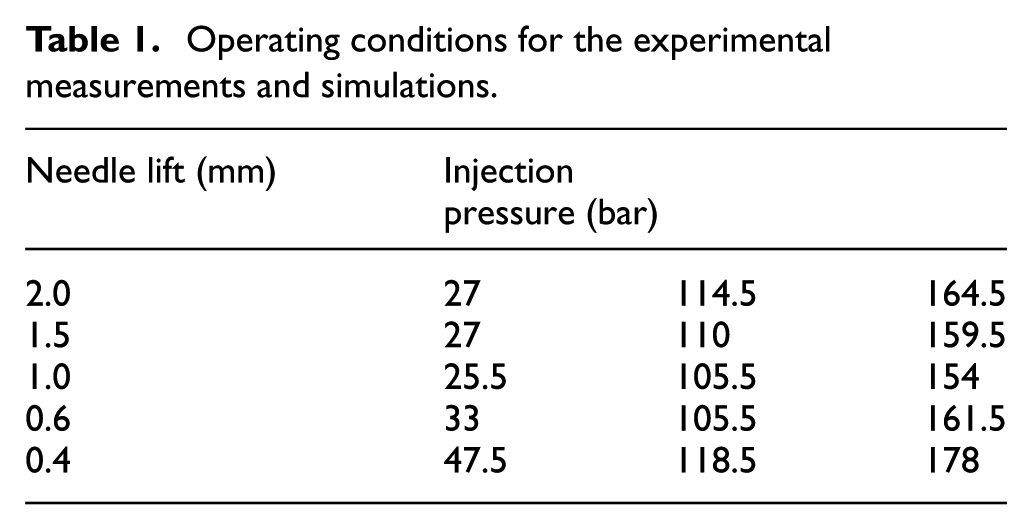
Both in the experiments and in the simulations, a constant pressure is set in the supply line of the injector, and the spray is investigated for different needle lifts, ranging from a very small aperture (i.e. 0.4 mm) to a large opening (i.e. 2.0 mm). The selected operating conditions are typical values for MDF boards manufacturing systems and span from high to low production set-ups.
In the numerical simulations, the fluid properties reported in Table 2 are adopted for water and resin (i.e. Seloform, which is made by 35% of resin and the remaining part by water). Measurements and simulations are carried out at ambient temperature; thus, the properties considered in Table 2 are assumed at 25°C.
Fluid properties adopted in the simulations.

The main output from the experimental campaign and the simulations was the mass flow rate injected at different operating conditions. Figure 2 shows the comparison between the experimental measurements and the calculated results in terms of flow rate through the injector at different supply pressures. For the numerical result validation, the simulations are carried out using only water as in the experimental test. The agreement resulted to be good for the varying operating conditions considered in the analysis. The numerical model validated against measurements using water as operating fluid is then used for the analysis of Seloform injection.

Measured versus calculated flow rate as a function of the injection pressure for different needle lifts: (a) 2.0 mm and (b) 0.6 mm.
Figure 3 depicts the calculated flow rates for all the analysed needle lift as an overview of the injector permeability at different operations considered in the simulations. It is interesting to note that at constant injection pressure, the flow rate is scarcely influenced by the needle lift when ranging from 1 to 2 mm, and only below the displacement of 1 mm, the flow rate decreases significantly. This behaviour can be explained by determining the influence of the helical and the metering area on the overall pressure drop across the injector.
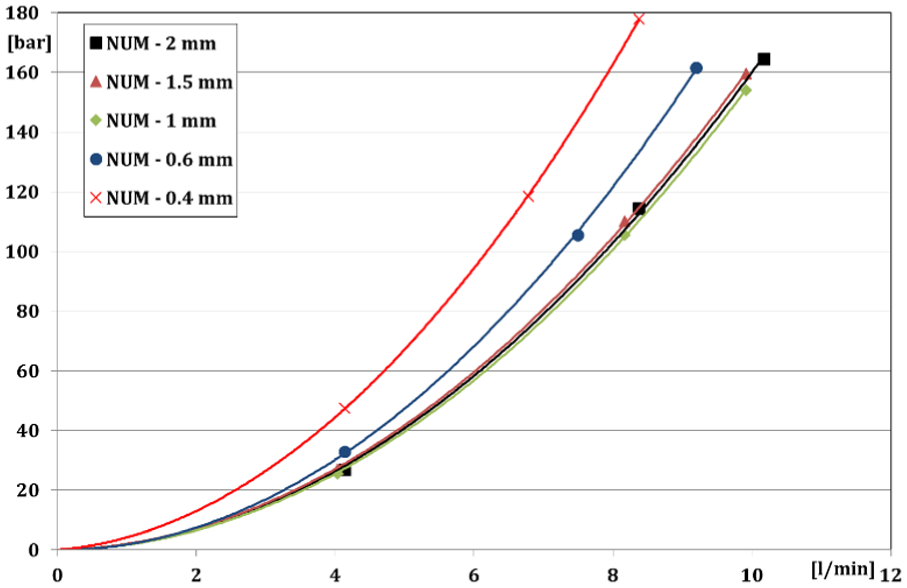
Calculated flow rate as a function of the injection pressure for all the analysed needle lifts.
The metering area is calculated at the section of the nozzle geometry where the flow area is minimum (see Figure 4). The pressure difference between the inlet and region upstream of the metering area (pm of Figure 4) is assumed as the contribution of the helical to the total pressure drop of the injector. Similarly, the contribution of the metering area to the total pressure drop is calculated as the difference between pm and the ambient pressure downstream of the nozzle.

Sketch of the section adopted for the metering area (dashed line) and monitoring region for the intermediate pressure.
Figure 5 shows the ratio between the pressure drop occurring in the helical and metering area, respectively, with respect to the total pressure drop across the component.

Influence of the helical and metering area on the total pressure drop at different operating conditions of the injector.
The importance of the fluid dynamic losses in the helical is significant throughout all the analysed needle lifts. Even for very small metering areas, the losses due to the helical amount are remarkable. For instance, in the case of needle lift equal to 0.4 mm, the importance of the helical on the overall pressure drop amounts approximately to 20%, reaching up to 40%–50% for the larger displacements. The contribution of the helical to the pressure drop reduces the effects of the needle lift motion. By comparing the results plotted in Figure 6 at different inlet pressures and needle lifts, it is evident that the importance of the helical losses is quite similar holding constant the lift while it increases significantly when opening the injector.

Velocity flow field on a cross section through the injector’s axis at two needle lifts and different injection pressures.
Figures 6 and 7 show the influence of the needle lift and injection pressure on the spray formation at the injector’s outlet. Holding constant the needle displacement, the simulations demonstrate that the spray angle is increasing while the supply pressure reduces. This behaviour is likely due to the effects of the helical on the tangential velocity at the injector’s hole. When the injection pressure is low, the importance of the helical on the flow field is more significant than at the high supply pressure; thus, the high tangential component of the liquid velocity results in large spray angles. At high injection pressure, the conical metering area tends to reduce the tangential component of the flow field, and the liquid is more directed towards the injector’s axis. Therefore, the spray is characterized by smaller angles when increasing the feeding line pressure.
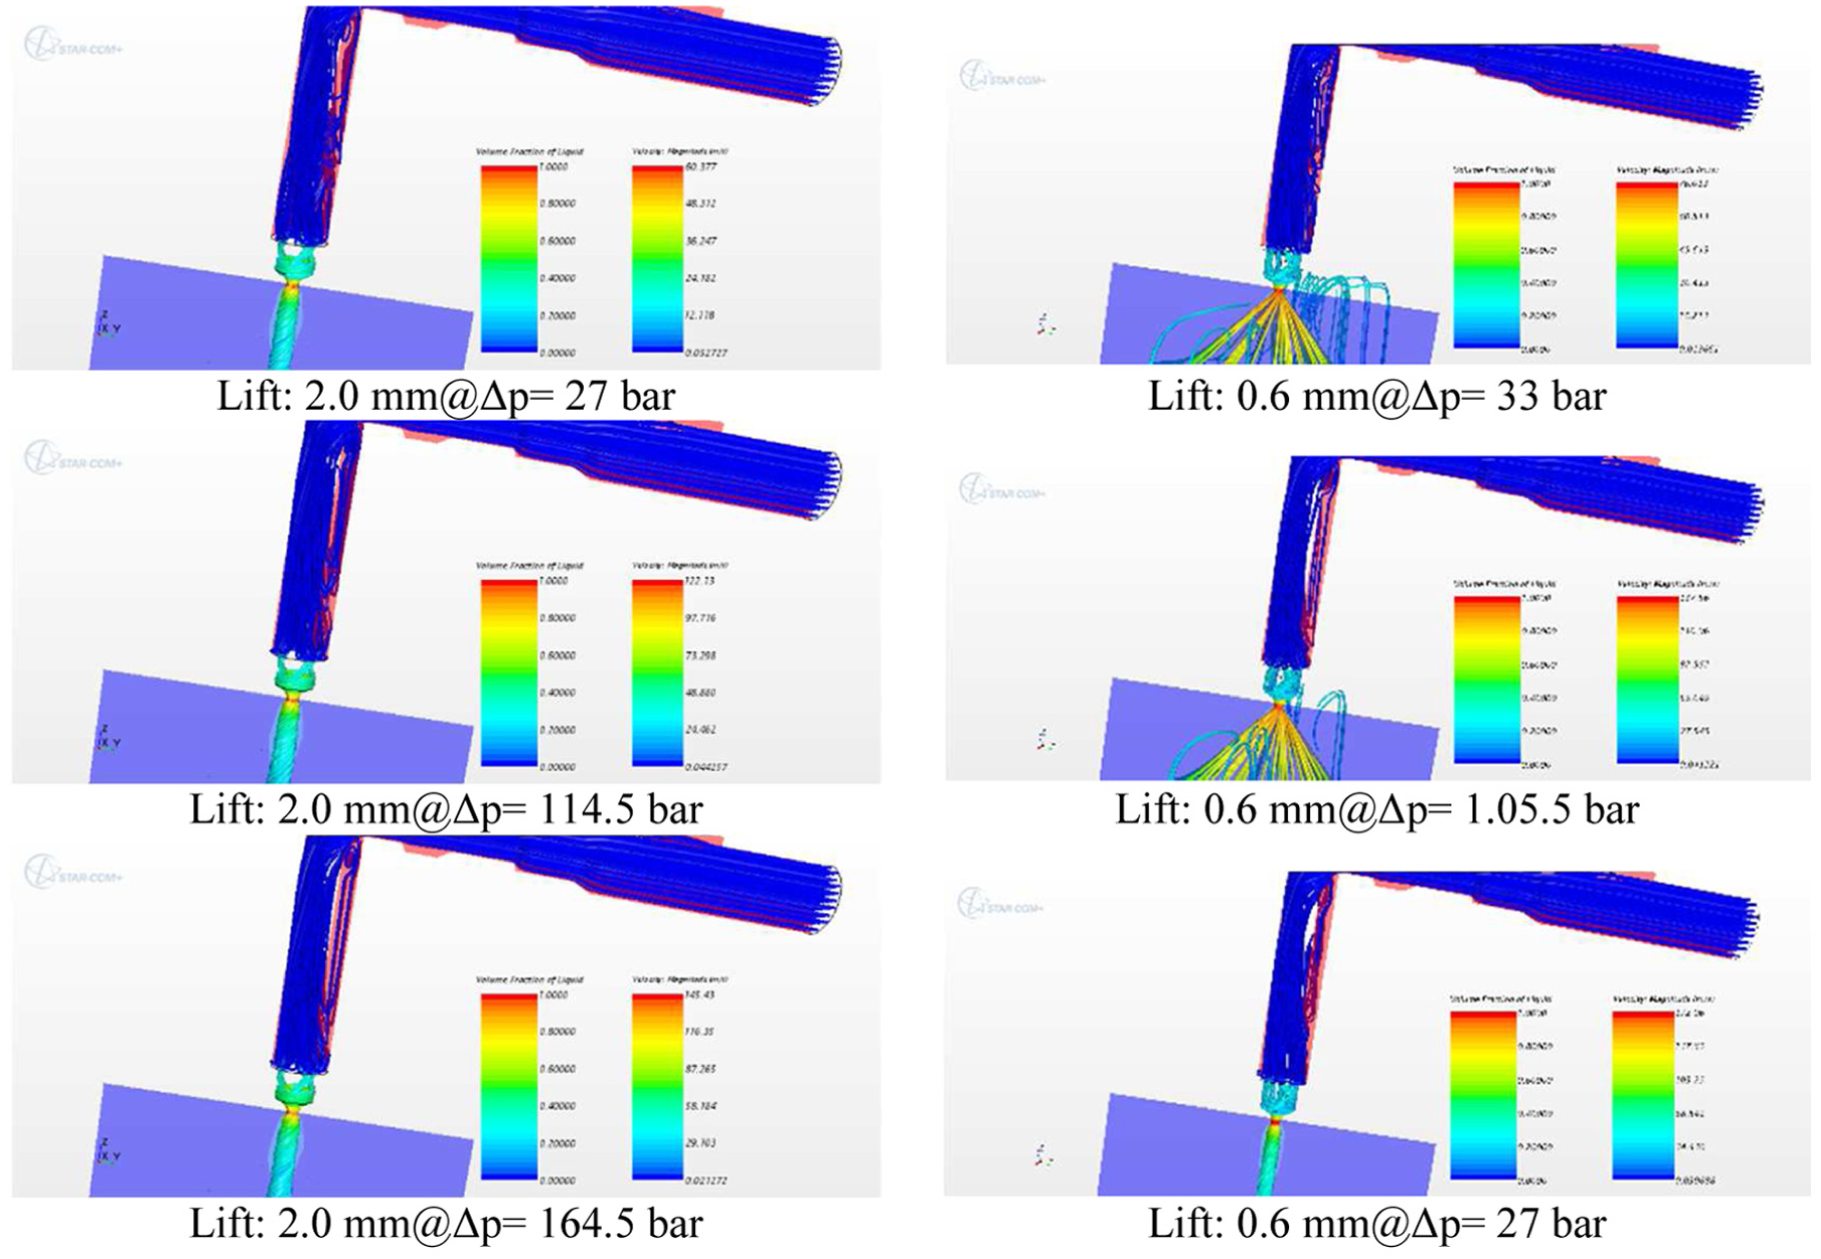
Streamlines at the injector’s outlet and water distribution on a cross section through the injector’s axis at two needle lifts and different injection pressures.
This result is evident when observing the streamlines in the region downstream of the injector’s hole. The streamlines result to be more clustered at high injection pressure.
When comparing the results at similar injection pressure, the trend on the spray angle is less evident. Nevertheless, it can be observed that the needle lifts have a weaker influence on the spray shape than the injection pressure.
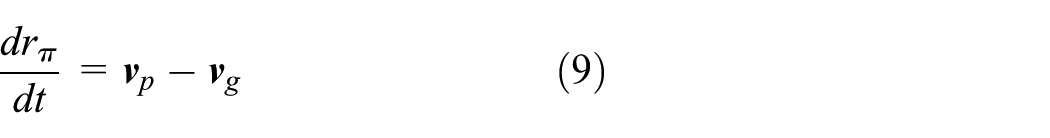
The CFD analysis of the injection process enables the accurate calculation of the spray forces that may act on the wood chips. In fact, by calculating the momentum of the liquid jet in the region downstream of the injector hole, it is possible to determine the pressure of the liquid stream exerted on the surface in that point. This quantity has the dimension of a force acting on a surface, and thus, it can be considered as a stress (see equation (6))

where
Therefore, the force of the liquid jet on a wood chip,

Figure 8 shows the different planes that have been selected for the evaluation of the flow stresses. The contour plots of Figure 9 depict the values of the flow stresses on different planes for one of the simulated operating conditions (i.e. needle lift of 2.0 mm and injection pressure = 164.5 bar). This figure compares also the flow stress distribution with the liquid mass fraction on the selected planes. It is interesting to note that the pattern of these quantities differs significantly. In fact, in order for the flow stress to be characterized by a large value, a high liquid mass fraction and a large velocity magnitude are necessary. Figure 8 shows clearly that in the spray centre, even though the liquid mass fraction is significant, the velocity is rather low, and thus, the flow stress results to be very small when compared to the outskirt region of the spray distribution.

Section planes orthogonal to the injector axis selected for the flow stress calculation.
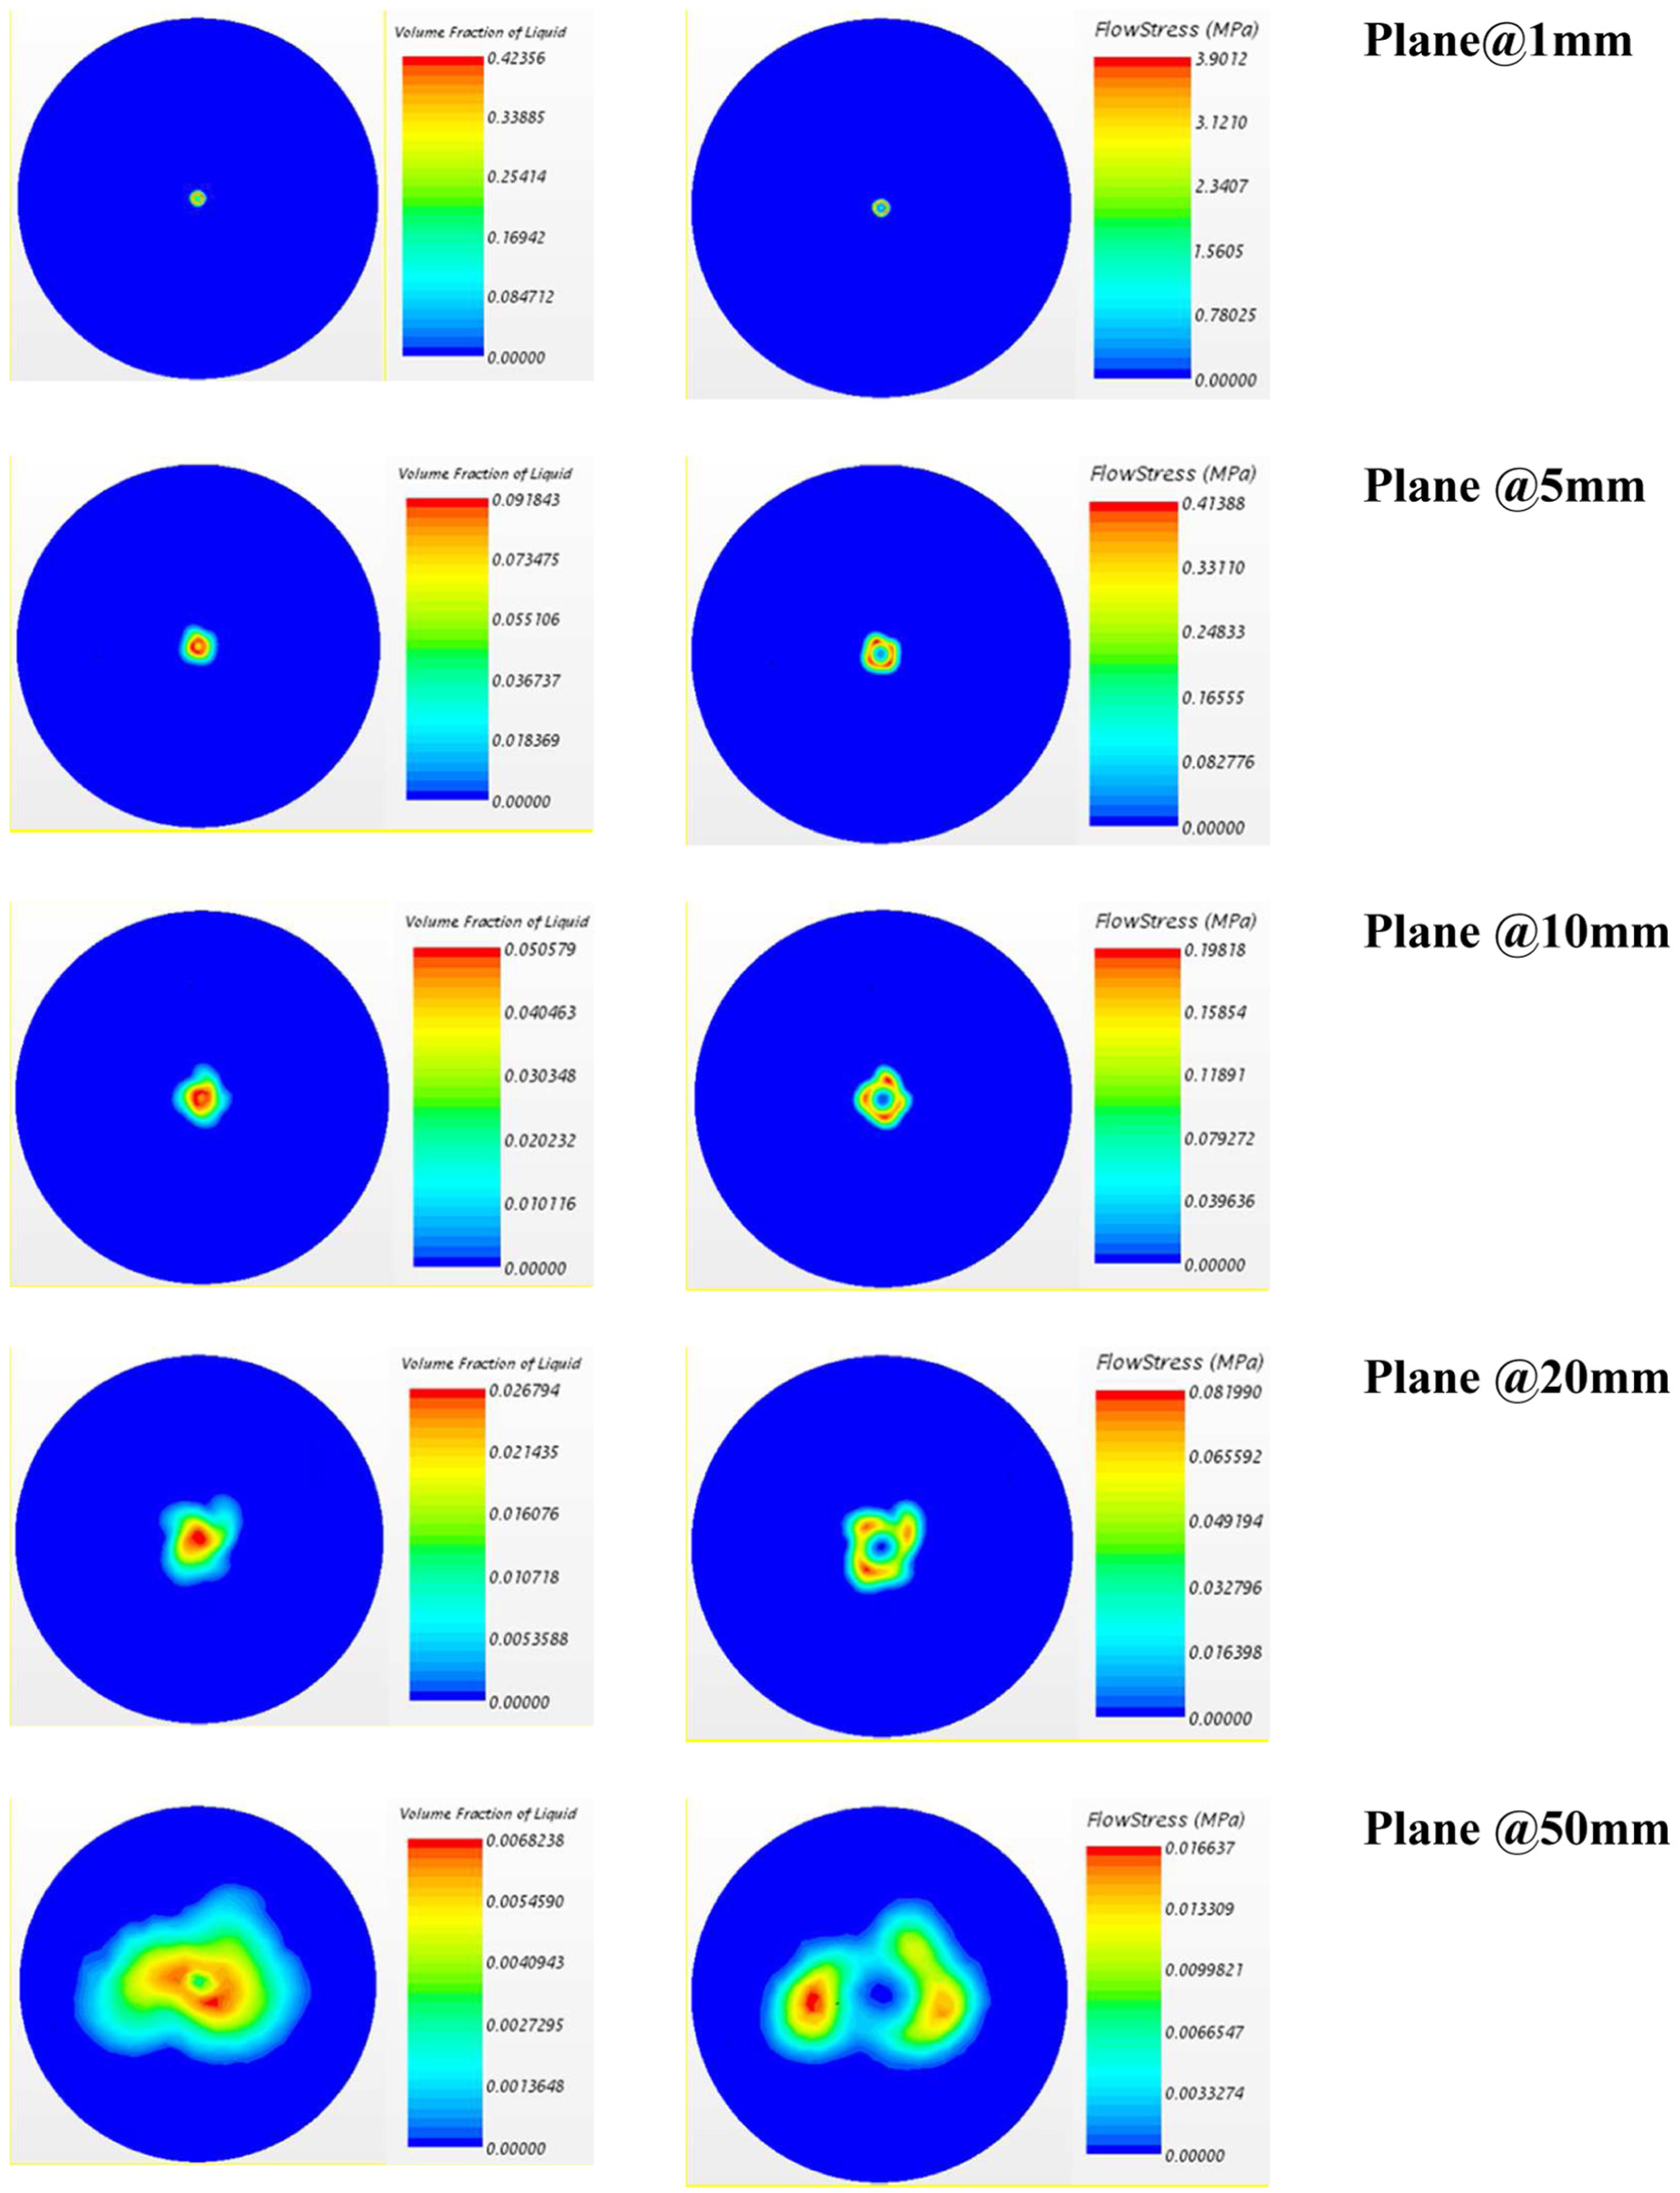
Contour plots of the liquid mass fraction and flow stress on the section planes orthogonal to the injector axis selected for the flow stress calculation (needle lift = 2.0 mm and injection pressure = 164.5 bar).
Analysis of the three-injector rail
The CFD analysis of the single injector is then used for the simulation of the complete three-injector rail under actual operating conditions. In the real system, the wood chips are conveyed through the rail by means of a vapour stream. Thus, the numerical approach used for the simulation of the whole three-injector rail is similar to the one adopted in the previous chapter being the liquid phase the resin and the gaseous phase the vapour. In addition, a Lagrangian approach is employed in the modelling in order to simulate the wood chips. In a Lagrangian framework,
18
particle-like elements that are known as parcels are followed through the continuum. The state of each parcel is updated according to a selected set of models.
15
The most basic particle description involves only its position

The grid velocity
Individual particles are not tracked, instead a single parcel represents a set of identical particles, at some mean centroid
where the grid velocity is now evaluated at
The generic form of the equation of conservation of momentum for a material particle is

Here


where
The momentum transfer to the particle from the continuous phase is simply
The equation for the drag force is
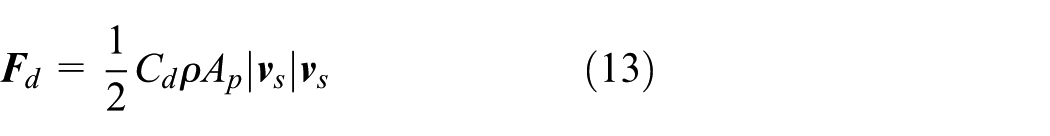
where
The drag coefficient
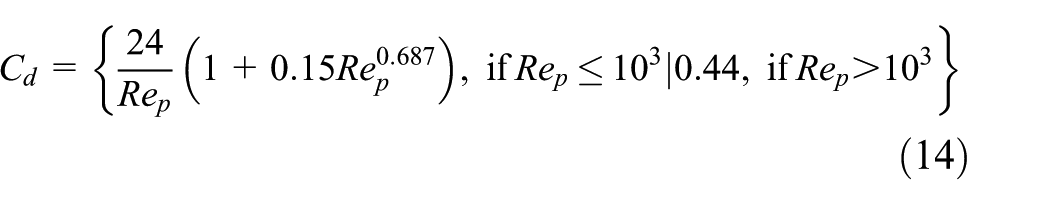
where

and
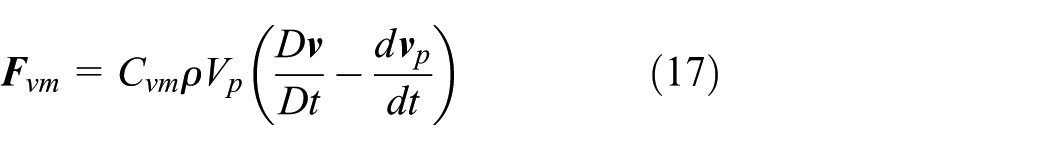
The equation for the pressure gradient force is

where
where

where
For the Lagrangian phase interaction with wall boundaries, the rebound model is adopted. Rebounding particles remain active in the simulation; the mode is distinguished by its treatment of the particle velocity. The rebound velocity relative to the wall velocity is determined by the impingement velocity and user-defined restitution coefficients

The superscripts R and I denote rebound and impingement respectively; the subscripts n and t denote wall-normal and tangential, respectively. Perfect elastic rebound is assumed for the restitution coefficients
In the analysis, the average size of the wood chip is set to be 1.5 mm long and with a diameter equal to 0.1 mm. The computational domain accounted for in the simulations includes the rail where three injectors are located as in Figure 10. The pipe is extended for 500 mm at the outlet in order to address the mixing process of the resin downstream of the injectors. The resin jet at the injector’s holes is simulated starting from the results of the simulations presented in the previous section. In fact, the resin flow field at the injector’s hole is mapped from the single-injector analysis’ results into the computational domain of the complete system simulation. Therefore, the flow within the three injectors is not computed as it is assumed that the injector’s flow is not significantly influenced by the vapour and wood chip stream. This assumption reduces remarkably the computational effort for the entire system simulation while still capturing the effect of the rail flow on the resin distribution. The average size of the mesh is set to be 1 mm, and refinement zones up to 0.04 mm are used in the nozzle outlet regions, in order to increase the accuracy in the prediction of the injector spray.
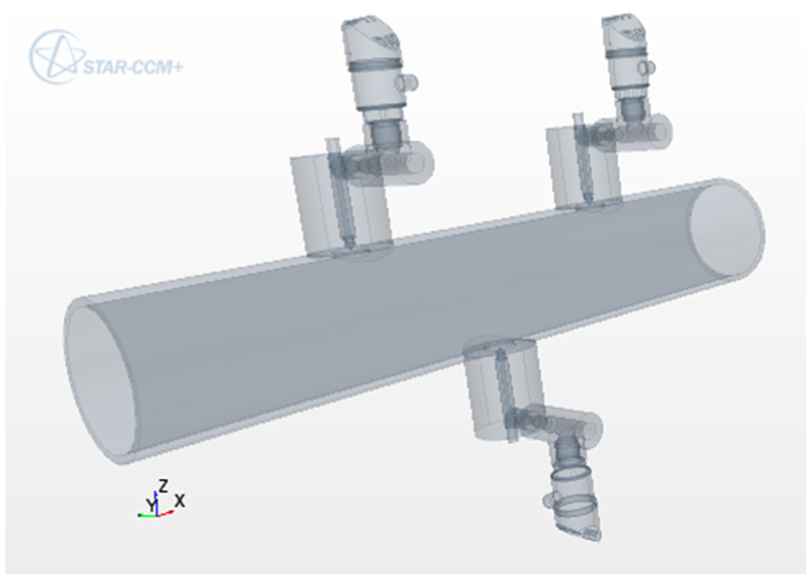
Geometry of the three-injector rail included in the CFD analysis.
Figure 11 shows the circular section adopted for the mapping of the results from the single-injector analysis to the full three-injector rail simulation. In particular, the injector operating conditions are set to be 100 bar for the supply pressure and a needle lift of 2.0 mm. The results mapped in the intersecting section between the rail and the nozzle are calculated on the same section of the single-injector simulation. The values of pressure, velocity and resin mass fraction are then extrapolated onto the rail CFD domain.

Circular section used for the mapping from the single-injector simulation to the whole-system analysis.
The operating conditions selected for the simulation represent a high-load and a low-load working cases. Table 3 details the values of the vapour and wood chip rates.
Operating conditions for the whole-system simulation.
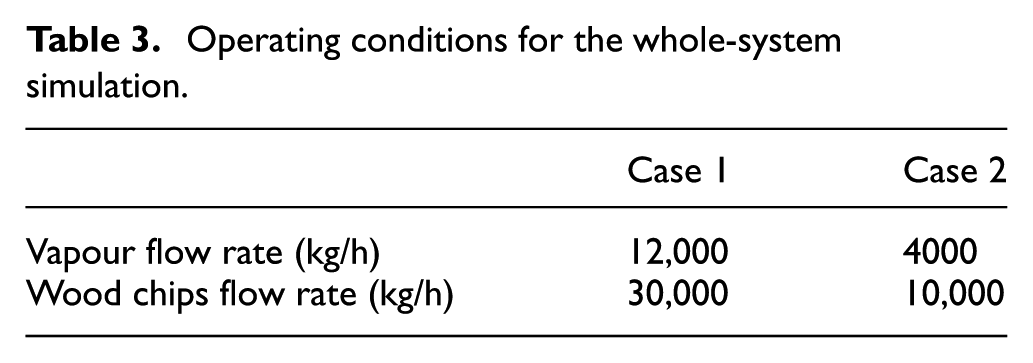
The vapour and wood chip flow at the rail inlet is assumed uniform and directed along the axis of the rail. The temperature of the vapour and chips at the rail inlet is set to be 160°C, corresponding to a pressure of the vapour of approximately 6 bar. Indeed, the flow in this section is remarkably turbulent and dependent on the upstream geometry. Nevertheless, the target of the present analysis is to address the influence of the relative velocity between the vapour or wood chip stream and the injector liquid jet on the resin distribution within the rail regardless of the real condition of the inlet flow.
Figures 12–14 show the results of the simulated cases on a section plane through the injectors and the rail axes as well as on the three section planes through the injector axis and orthogonal to the rail 1. Figure 12 depicts the velocity convolution distribution, and it can be noted that in case 1, the main flow is perturbed mainly downstream of the injectors’ outlet, while along the rail axis, it remains uniform. Conversely, in case 2, the resin spray penetrates deeper, and the main flow results to be perturbed all over the considered sections. Consequently, the resin distribution within the rail seems to be more concentrated on the rail wall in case of large vapour velocity (i.e. case 1), while in case 2, spots characterized by a large resin concentration can be seen also close to the rail axis (see Figure 13).
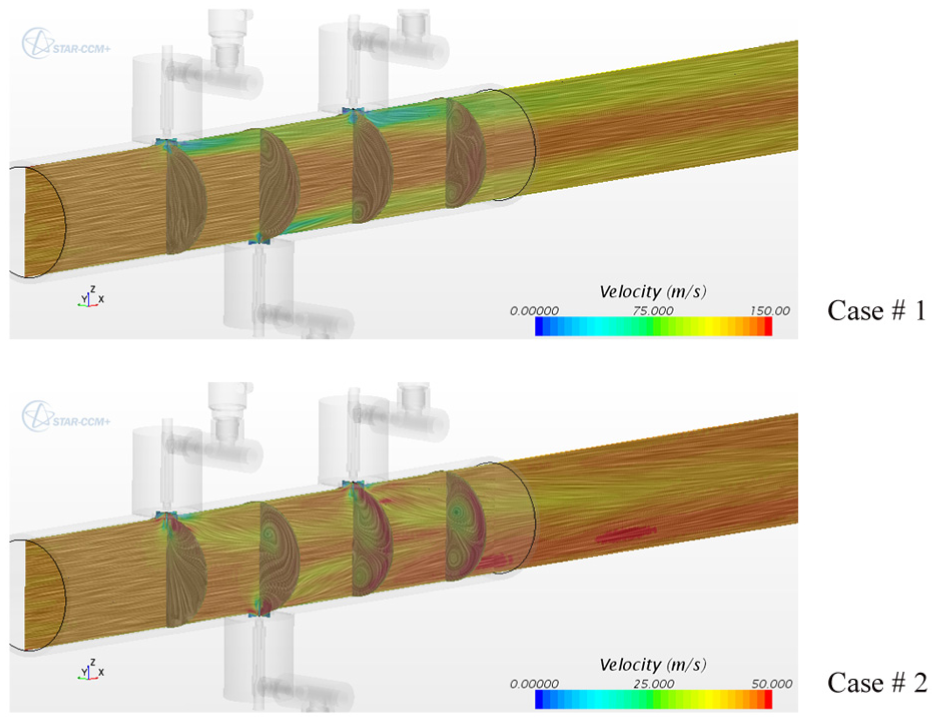
Velocity convolution distribution within the rail.

Resin distribution within the rail.
Resin and wood chip distributions within the rail.
This result is even more evident when plotting the streamlines from the injectors’ holes and the Lagrangian particles representing the wood chips. In fact, Figure 14 demonstrates that the streamlines remain grouped close to the rail wall for case 1, while when the vapour velocity is low, they penetrate in the rail and mix together close to the axis.
In Figure 15, the zoomed view of the region downstream of injector 1 hole is shown. By comparing the flow field in this region in terms of velocity convolution as well as the streamlines from the injector’s outlet, the resin spray can be addressed under actual operating conditions. The calculation demonstrates that the shape of the resin spray is largely influenced by the vapour or wood chips stream, and after few millimetres, the jet is bended and follows the main flow stream.

Zoomed view of the resin spray and rail flow field in the region close to the outlet of injector 1.
In order to address the resin distribution within the rail for the simulated vapour flow rates, two different sections are selected: the first one is just downstream the third injector, while the second section is located 500 mm downstream (see Figure 16).

Outlet sections selected for the analysis of the resin distribution.
Figures 17 and 18 show the resin distribution on the selected sections and as mentioned before, it can be noted that case 2 is characterized by a larger resin concentration close to the rail axis due to the deeper penetration of the spray. Nevertheless, the larger spray penetration of case 2 does not lead to a uniform distribution of the Seloform through the rail section. In fact, the efficiency of the resin mixing process with the stream of vapour and wood chips is addressed by calculating the standard deviation value,


where
Resin distribution on section out 1.

Resin distribution on section out 2.
In order for the resin distribution to result homogeneous, the value of equation (20) should be as low as possible, while the value of the uniformity index should be close to unity.
Figures 19 and 20 clearly show that the resin distribution results to be more homogeneous in case 1 even though the spray seems to penetrate shorter into the rail when compared to case 2. Thus, the numerical analysis demonstrates that the influence of the vapour or wood chip stream velocity is larger than the spray penetration.

Standard deviation values for the simulated cases on the selected sections downstream the three injectors.

Uniformity index values for the simulated cases on the selected sections downstream the three injectors.
Similar consideration can be drawn when observing the stress flow distribution within the rail (see Figure 21). The images in this figure confirm that the main contribution to the impact flow forces on the wood chips depends mainly on the vapour or wood chips velocity rather than on the resin spray velocity. In fact, for the simulated case, the latter values are the same while the flow stresses result to be remarkably different. This behaviour agrees with what was observed previously concerning the spray shape. In particular, the velocity of the resin jet downstream of the injector’s outlet decreases rapidly, and it evens out to the main stream velocity.

Flow stress distribution within the rail.
Conclusion
This article investigated the resin spray formation in a high-pressure injector and the interaction between the resin jet and the wood chips in a vapour stream. A multi-component multi-phase numerical approach was used in order to predict the resin distribution at the injector outlet as well as within the vapour pipe. First step of the analysis was the simulation of the single-injector operation in order to predict the resin spray and the effects of the main operating parameters.
The simulation of the injector operation at varying supply pressures and needle lifts demonstrated that at constant injection pressure, the flow rate was scarcely influenced by the needle lift when ranging from 1 to 2 mm, and only below the displacement of 1 mm, the flow rate decreased significantly. In order to explain this behaviour, the influence of the helical and the metering area on the overall pressure drop across the injector was calculated. In particular, the importance of the fluid dynamic losses in the helical resulted to be remarkable for all the analysed needle lifts. Even for very small metering areas, the losses due to the helical amount demonstrated to be remarkable (i.e. approximately 20% at needle lift of 0.4 mm). When increasing the needle lift, the contribution of the helical to the total fluid dynamic losses amounted up to 40%–50%, thus reducing the effects of the needle lift motion on the mass flow rate. Holding constant the needle displacement, the simulations demonstrated that the spray angle was increasing while reducing the supply pressure. Furthermore, the needle lifts resulted to have a weaker influence on the spray shape than the injection pressure.
Afterwards, the results of the single-injector analysis were employed in the simulation of the full three-injector rail to address the interaction between the resin and wood chips. The injector operating conditions were set to be 100 bar for the supply pressure and a needle lift of 2.0 mm, while the working conditions of the systems were modified in order to simulate two different cases representing a high-load and a low-load operations.
For the high-load case, the main flow resulted to be perturbed mainly downstream of the injectors’ outlet while remaining uniform along the rail axis. Conversely, in low-load operation, the resin spray penetrated deeper, and the main flow was perturbed all over the considered sections of the vapour rail. Thus, the numerical analysis demonstrated that the resin distribution is more concentrated on the rail wall in case of large vapour velocity, while in case of low vapour velocity, spots characterized by a large resin concentration can be seen also close to the rail axis.
Furthermore, the resin spray was largely influenced by the vapour or wood chips stream, and after few millimetres, the jet resulted to be bended and to follow the main flow stream. In particular, the velocity of the resin jet downstream of the injector’s outlet decreases rapidly, and it evens out to the main stream velocity. In fact, the resin was predicted to penetrate deeper into the vapour rail for the low-load operation, while in the high vapour flow rate case, it concentrated close to the cylindrical wall. Nevertheless, the larger spray penetration did not determine a more homogeneous resin distribution as demonstrated by the calculation of the standard deviation and uniformity index of the Seloform distribution. Thus, the numerical analysis outlined that the influence of the vapour or wood chip stream velocity is larger than the spray penetration.
Finally, the modelling remarked that the main contribution to the impact flow forces on the wood chips depends mainly on the vapour or wood chips velocity rather than on the resin spray velocity. In fact, for the simulated case, the latter values turned to be the same while the flow stresses resulted to be remarkably different.
Footnotes
Academic Editor: Hyung Hee Cho
Declaration of conflicting interests
The author(s) declared no potential conflicts of interest with respect to the research, authorship and/or publication of this article.
Funding
The author(s) disclosed receipt of the following financial support for the research, authorship and/or publication of this article: This work was supported by the European Community LIFE+ programme by the project LIFE+ 2012 ENV/ITA/000307 –‘High Pressure Resination System’– Acronym LIFE HPRS.