
Abstract
It is known that the full hydraulic braking system has excellent braking performance. As the key component of the full hydraulic braking system, the parameters of the accumulator charging valve have a significant effect on the braking performance. In this article, the key parameters of the charging valve are analyzed through the static theoretical and an Advanced Modeling Environment for performing Simulation of engineering systems (AMESim) simulation model of the dual-circuit accumulator charging valve is established based on the real structure parameters first. Second, according to the results of the dynamic simulation, the dynamic characteristics of the charging pressure, the flow rate, and the frequency of the charging valve are studied. The key parameters affecting the serial production are proposed and some technical advices for improving the performance of the full hydraulic system are provided. Finally, the theoretical analysis is validated by the simulation results. The comparison between the simulation results and the experimental results indicates that the simulated AMESim model of the charging valve is accurate and credible with the error rate inside 0.5% compared with the experimental result. Hence, the performance of the charging valve meets the request of the full hydraulic braking system exactly.
Introduction
The full hydraulic braking system has become a new developing trend in construction machinery field due to its excellent braking performance, which transfers the pressure through hydraulic oil merely. As one of the key components of hydraulic braking system, the accumulator charging valve is mainly used to control the energy storing of accumulator by charging oil. When the pressure of the accumulator falls below the default value P1, it will be charged by the charging valve, while the charging valve will stop working when the pressure of the accumulator is higher than another default value P2. Hence, the pressure of the accumulator is kept in a certain range (P1–P2) and the braking system could maintain a stable performance.1–3 Furthermore, the dynamic characteristics of the charging valve are extremely crucial to the braking system of the vehicle and the traffic safety. Therefore, grasping the key effect parameters and the dynamic characteristics of charging valve accurately can provide an adequate theoretical basis for the designing, matching, and optimizing of the full hydraulic braking system.
The charging process of the charging valve is accomplished by matching the system pressure and the states of accumulator. Hence, the accurate grasping of the conversion time, the dynamic characteristics of the pressure, and the flow rate of the charging process will provide a basis for the design of the charging valve and the corresponding system. 1 The research and development companies of the full hydraulic braking system in a leading position include Rexroth and MICO, in which MICO mainly focuses on developing the key hydraulic components (such as charging valve, braking valve and brakes, and others) of full hydraulic braking system and the system matching in a technical monopoly position. In this article, the charging valves are analyzed as the research object which is the key component in dual-circuit full hydraulic braking system and the corresponding hydraulic component design (HCD)4,5 model is established through the Advanced Modeling Environment for performing Simulation of engineering systems (AMESim) simulation software. Moreover, the dynamic response characteristics of the charging valve are studied comprehensively and the key factors affecting the dynamic characteristics of the charging valve are determined. Finally, the correctness of the theoretical analysis is validated through the experiments and the error rate of 1.4% between the simulation and theoretical analysis and the error rate of 0.5% between the simulation and experiments is obtained.
Structure and working principle of the charging valve
An accumulator charging valve is divided into two types of single circuit and dual circuit depending on the type of full hydraulic braking system, which is applied to the corresponding brake system. The dual-circuit brake system has a higher security compared to the single-circuit brake system, since the two braking circuits and the two accumulators are independent and the accumulators are controlled by the shuttle valves of the charging valve to charge and discharge liquid alternately in the dual-circuit braking system. As shown in Figure 1, the shuttle valves control the charging of the accumulator with the lower pressure between the front and the rear axles. Therefore, the leakage fault occurring in any of the circuit will lead to the accumulator not being charged and the braking performance being limited. Besides, the blockage failure occurring in any of the circuit will not affect the function of the braking system. The dual-circuit charging valve analyzed in this article consists of four parts: main charging valve, one-way valve and filtering components, pilot valve, and shuttle valves, as indicated in Figure 1. The connection of the charging valve and the full hydraulic brake system is accomplished as follows: port P is connected to the outlet of the hydraulic pump, port O is connected to the other downstream working system, port SW is linked with the low-pressure alarm switch, port T is connected to tank, and ports A1 and A2 are connected to the two accumulators, respectively.

Working principle of charging valve.
The charging valve works as a pressure control switch substantially which controls the pressure of the double accumulators of the braking system working in a setting range with the lower limit pressure of P1 = 11.4 MPa and the upper limit pressure of P2 = 13.8 MPa. The rated flow rate is Q0 = 10 L/min. The variable P represents the lower pressure of two accumulators, which is a feedback to the control chamber of charging valve 3. According to the different ranges of variable P, the working process of the charging valve is divided into three processes:
Initial charging stage. As shown in Figure 1, when P is smaller than P1, the pilot valve 3 works in the right position while the main charging valve works in the left position due to the feedback of accumulator’s pressure to main valve 1. The outlet oil from the pump charges the accumulator whose pressure is lower through the main charging valve 1, one-way valve and filtering component 2, pilot valve 3, and shuttle valve 4, and the pressures of the two accumulators increase alternatively.
End of charge. When P is greater than or equal to the setting value P2, the pilot valve 3 works in the left position and the main charging valve works in the right position due to the feedback to the accumulator pressure being 0. Most of the outlet oil from the pump goes to the downstream working system through port O which leads to the pressure of port P being lower than the pressure of the accumulator. Hence, the accumulator pressure is stable under the action of one-way valve and filtering component 2.
Process of energy discharge. This process will lead to two results: one is that the pressure of the accumulator decreases but not less than P1 after the braking operation, that is, when P is greater than or equal to the setting value P1 and smaller than or equal to the setting value P2, the accumulator pressure keeps stable because the charging valve keeps the status of process (2) due to the changes in stress area at the end of valve spool. The other is the pressure of the accumulator drops below P1, that is, P is smaller or equal to P1 and the initial charging stage will be repeated.
It can be derived from the analysis that the pilot valve 3 in Figure 1 is the key component to achieve the judgment of the pressure of the accumulator. The structure of the pilot control valve is shown in Figure 2 and the static equilibrium equation 6 is defined as

where FT1 is the force of the pilot valve’s supporting spring, FT2 is the force of pilot valve’s resetting spring, and F is the hydraulic synthesis force in the right end of pilot valve.

Structure diagram of pilot valve.
According to Figure 2, the parameters FT1, FT2, and F in equation (1) are introduced, respectively. The supporting spring is located on the right side of the pilot valve spool and produces a support spring force FT1 with direction to the left, which does not affect the control of pilot valve and is only used for the reset of spool 3 and ball valve 5

The control force FT2 is produced by the supporting spring that is located on the left side of the pilot valve spool with direction to the right, which is mainly used to balance the hydraulic force applied to the right side of spool 3

In Figure 2, the steel balls 5 and 6 constitute the right one-way valve and the left one-way valve of the pilot valve, respectively. The hydraulic pressure on the left one-way valve is 0, while the right one-way valve suffers the feedback pressure from the accumulator. When the right one-way valve is closed, the feedback pressure acts on the lateral spherical of the ball, while the valve is open, the feedback pressure acts on the right side face of spool 3. Hence, the hydraulic pressure on the right side of pilot can be expressed as

In equations (2)–(4), the variables are as follows:
K1: stiffness of the supporting spring, N/mm;
x10: initial deformation of the supporting spring, mm;
K2: stiffness of control string, N/mm;
x20: initial deformation of control spring, mm;
Δx: distance of spool 3 (the left direction be positive), mm;
P: pressure of accumulator, MPa;
D1: diameter of steel ball at the side of the supporting spring, mm;
D2: diameter of valve spool, mm;
α: angle of valve sleeve at the side of the supporting spring, rad.
In the following, the stress analysis of the valve spool with the three work processes (the initial charging stage, the end of charge, and the process of energy discharge) is discussed in detail:
As indicated in Figure 3, when the accumulator pressure P is less than P1,
As shown in Figure 2, when the pressure of the accumulator P is greater than P2,

After the braking operation, the pressure of the accumulator P will drop. When P is smaller than or equal to P1, spool 3 and ball 5 will be reset and the final state is indicated in Figure 3. After reset, work process (1) will be repeated and there is no need to say more here. The stress area where pressure P acted on the spool for reset is


Status of pilot valve with lower limit pressure.
According to equations (5) and (6), the pressure difference ΔP between the lower limit and the upper limit can be derived

The compression of the control spring and the supporting spring is small during the movement of pilot valve spool, that is,

Besides, the stiffness K1 and the initial compression x10 of the supporting spring are also very small. It can also be ignored and equation (8) can be simplified as follows

As indicated in equation (9), the upper limit of the charging pressure depends on the parameters D2 and K2 and the lower limit of the charging pressure depends on the parameters D1, K2, and α. On one hand, it provides the basis for establishing the simulation model, and on the other hand, the key parameters of the system are identified.
Simulation model and parameters
Presently, most of the studies for the hydraulic dynamic characteristics simulation are based on the co-simulation method of MATLAB/Simulink, which can successfully complete the corresponding simulation. However, this method is dependent on the theoretical analysis of the modeling process excessively. Meanwhile, considering the operation speed of the simulation model, it is easy to ignore or equalize some of the detailed factors. Since the fluid operation simulation requires the details of the model highly, the co-simulation method of MATLAB/Simulink 7 has great limitations 8 in the field of hydraulic simulation. To solve this problem, the AMESim professional hydraulic simulation platform is adopted in this article for simulation analysis and the ideal simulation results are obtained. The efficiency and accuracy of the modeling and simulation analysis are improved to some extent.
The actual structure parameter of the charging valve is an important basis for the establishment of AMESim model. In this article, the charging valve HCD models are established according to the structure size of the charging valve on the basis of the working principle of the charging valve, as indicated in Figure 4. The orifice at the outlet of the accumulator is simulated for the load of the braking valve and orifice K is simulated for the load of the downstream working system. The remaining four parts and the other key structures all correspond to the structure principle of the dual-circuit charging valve as shown in Figure 1.

Simulation model of charging valve.
The setting of the key parameters of the simulation model as shown in Figure 4 is determined by the actual structural parameters to guarantee the credibility and reliability of the model. The simulation conditions are also set according to the real working conditions. For example, among the key parameters of the main valve 1, the relationship between the open area A and the displacement x of the spool to the downstream power system is shown in Figure 5. The variation gradient is very small when the displacement x ranges from 0 to 1 mm, while the variation gradient is high when the displacement ranges from 1 to 5 mm. According to the actual structure of the charging valve, the displacement x of the spool is set as 1 mm ≤ x ≤ 5 mm and the open area A of the spool is set as 0 ≤ A ≤ 310 mm2, and the main parameters are defined in Table 1. According to the real experimental system, we set the pump delivery as 50 L/min, and the pressure of downstream working system and the pressure of relief valve as 1 and 19 MPa, respectively. 9 According to the experimental data, we set the spring stiffness. In order to get the real working condition, we measure the real quality and geometry parameters of the main valve, pilot valve, and shuttle valve, as shown in Table 1.

Flow rate area of the main valve.
Key parameters of simulation model.

Simulation analysis and exploration
In this part, the analysis and simulation of charging valve are accomplished. First, the static and dynamic characteristics of the conventional parameters of the charging valve are analyzed, including the upper and lower limit pressures, the accumulator pressure, the charging rate, and so on. Second, the key characteristics of the charging valve are explored such as the parameters which affect the batch production of the charging valve. Finally, the parameters are set according to Table 1 and the calculation and analysis are accomplished and the simulation results are analyzed as follows.
Simulation for accumulator’s pressure
The simulation conditions are set as follows: the initial pressure of the accumulator of the front axle is 9 MPa and that of the rear axle is 10 MPa. The simulation time is 12 s with the leakage existing during the whole simulation process. The curves of the variation in the accumulator pressure of the front and rear axles are shown in Figures 6 and Figure 7 amplified the curves from 0-0.25 seconds of Figure 6. As indicated in the figures, curve 1 and curve 2 nearly overlap and are synchronous. After amplification, it can be seen that the front axle accumulator is charged priority due to the lower accumulator pressure and the pressure will change alternately when the accumulator pressure of the front axle is equal to that of the real axle. When the accumulator pressure reaches 13.86 MPa (points A1 and A2 in Figure 6), the charging valve stops filling with the liquid to the front and rear axle accumulators. At this moment, the pilot control valve is at the left end as shown in Figure 2; the right side of the valve port of the ball valve is closed completely and the simulation results of the valve port area are shown in Figure 8. In Figure 8, points A1 and A2 correspond to points A1 and A2 in Figure 6. Compared with the upper limit of the charging pressure of 13.86 MPa in the simulation results with 13.80 MPa of the theoretical calculation value, the error rate is 0.4%. Then the charging valve stops filling. Due to the leakage present during the whole simulation, the charging valve restarts filling the accumulator when the pressure is lower than 11.24 MPa (point B1 in Figure 6). At this moment, the variation in the open area of the right ball valve is shown in Figure 8 and the point B1 in Figure 8 corresponds to the point B1 in Figure 6. Compared with the lower limit of the charging pressure 11.24 MPa obtained by simulation with that of the theoretical value 11.4 MPa, the error rate is 1.4%.

Simulation for charging pressure. 1-front axle and 2-rear axle.
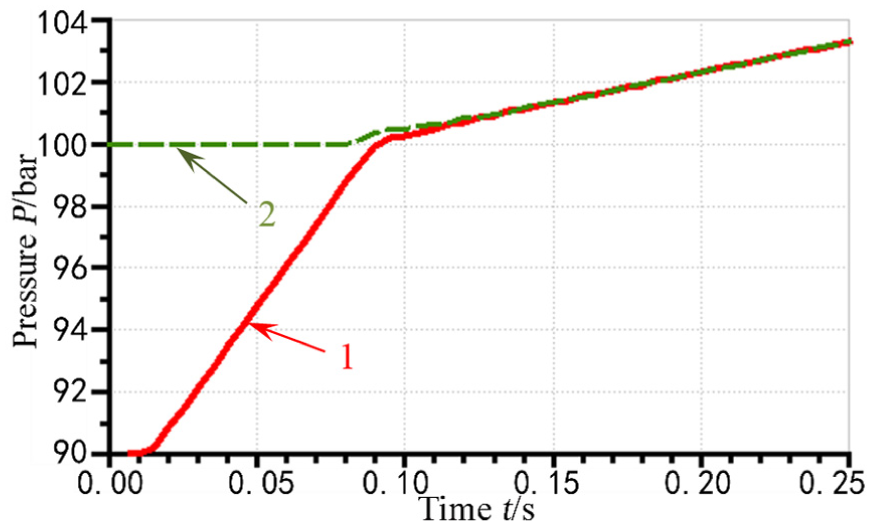
Simulation for charging pressure (enlarge the initial process).
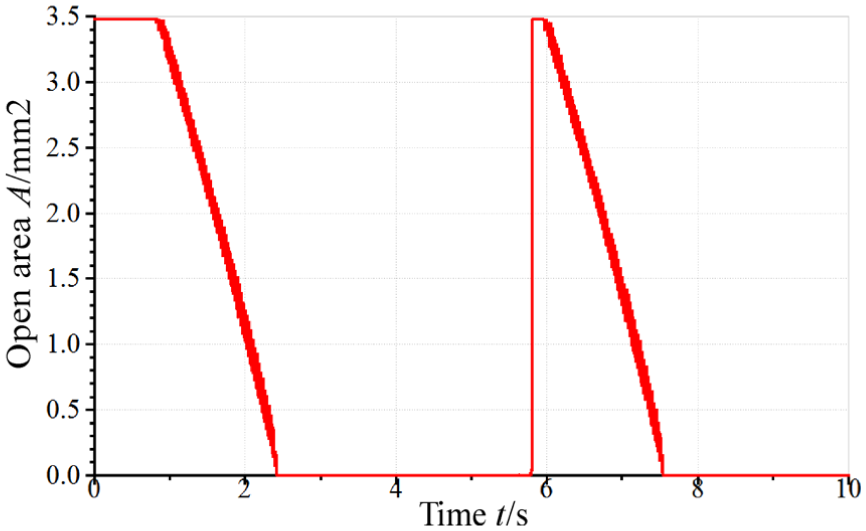
Simulation for flow rate area of pilot valve.
Simulation for charging flow rate
The charging flow rate of the charging valve affects the system in two aspects. First, when the charging flow rate Q is too small, the energy of the accumulator cannot be supplied on time after energy release which leads to the decrease in the system efficiency. Especially during the shovel operation, the inefficiency of the accumulator pressure will lead to the decrease in the braking efficiency and the increase in the braking distance, thereby the working efficiency will be influenced. Second, when the charging flow rate Q is too large, the accumulator is filled with lots of oil in a short time which will damage the airbag and the lifetime of the accumulator. Meanwhile, since most of the flow rate flows to the accumulator and the flow rate of the downstream power system (such as the steering system and the working system) is inefficient, the system stability is affected.
The charging flow rates of the two accumulators are shown in Figure 9, in which the flow rate vibrates severely. This is due to the alternate charging for the two accumulators. But the average flow rate is maintained at 8–9 L/min, which is similar to the set value Q0 = 10 L/min.
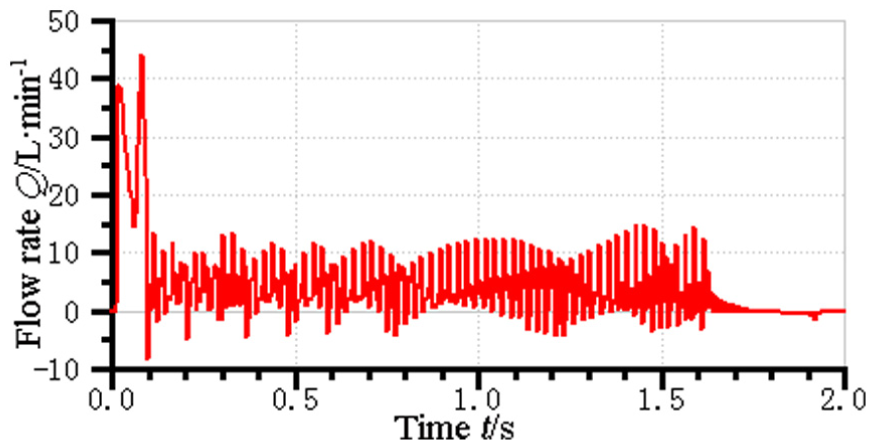
Simulation for charging flow rate.
Employing the fast Fourier transform (FFT) for the charging flow rate, the amplitude spectrum of the charging flow rate is shown in Figure 10. As indicated in Figure 10, the main affecting frequencies are 2.5 Hz (A), 18.6 Hz (B), 39.1 Hz (C), and 80.7 Hz (D), respectively. Among the frequencies, the 80.7-Hz influences the system significantly. Hence, the system runs in a relatively high-frequency field during the charging process.

FFT for charging flow rate.
Simulate the transient response of charging valve and set the braking flow rate increasing suddenly as shown in Figure 11(a), and the charging pressure response to the flow rate’s variation is shown in Figure 11(b). Charging oil will be released in 0.8 s and the charging process will be started.

(a) Braking flow rate and (b) charging pressure of transient response.
Special case about the upper charging limit
During the practical working process, there is a phenomenon that the pressure of the accumulators may exceed the theoretical upper charging limit of P2 = 13.8 MPa. According to the working principle of dual-circuit charging valve shown in Figure 1, after reaching the upper limit, the accumulator pressure will keep stable under the action of one-way valve. However, in the special case that the pressure Pout of port O in Figure 1 (the pressure before the throttle valve K in Figure 4) is higher than the upper limit pressure, the accumulators will be charged until the pressure is equal to Pout. In order to demonstrate the result, the pressures of other power system indicated in Table 1 are set to 18 MPa which is equal to the setting value of the checking valve; the pressures of the two accumulators are simulated and the results are shown in Figure 12. As shown in Figure 12, the upper charging limit achieves 18 MPa (point C1 in Figure 12) which is identical to the theoretical analysis. It is shown that the upper and lower limits of the charging pressure are effective only in the conditions that the downstream working pressure is lower than the upper charging limit pressure. Hence, it is necessary to consider the effects of the downstream working pressure on the braking system in the design of the whole hydraulic system 10 to ensure the security and reliability of the braking system.

Simulation for special case about the upper charging limit.
Key parameters of charging valve
When the charging valve of dual-circuit braking system is in batch production, 11 the upper and lower limits of charging pressure are serialized mainly. According to the analysis of equation (8), the key parameters affecting the value are the diameter D2 of valve spool, the angle α of valve sleeve at the side of the supporting spring, and the initial force of control spring. Also, we can infer that the diameter D2 affects the upper limit of the charging pressure and the angle α of valve sleeve at the side of the supporting spring affects both the upper and lower limits of the charging pressure, while the initial force of control spring affects the lower limit of the charging pressure. According to the analysis, the batch processing function of AMESim is used to make batch processing for these key parameters:
As shown in Figure 13, the initial force values of the control spring are set as 236.88, 257.459, 305.459, and 377.149 N, respectively. The simulation results are shown in Figure 14; four groups of upper limit results are obtained: 12.9, 13.9, 15.8, and 19.0 MPa, which are identical to the theoretical preset values of 12.8, 13.8, 15.9, and 19.0 MPa. Meanwhile, the lower limits obtained by the simulation are 10.9, 11.4, 12.5, and 15.2 MPa, as indicated in the points of E4, E3, E2, and E1 in Figure 14, which are also consistent with the actual designed values of 10.3, 11.4, 12.8, and 15.5 MPa. The reason for the small error in the lower limit value is that the initial segment tension of spring is merely considered, but the influence of the diameter D2 of the valve spool and the angle α of valve sleeve at the side of the supporting spring is ignored. However, the analysis of the parameters also illustrates the effects of the initial force of spring on the upper and lower limits of the charging pressure.
Make batch processing for the angle α of the valve sleeve at the side of the supporting spring. According to the analysis of equation (6), α affects the lower limit of the charging pressure and the lower limit of the charging pressure is inversely proportional to the lateral area
Make batch processing of the diameter D2 of valve spool. According to the analysis of equation (5), it affects the upper limits of charging pressure and is inversely proportional to the upper limits of charging pressure P2. Set the batch processing parameters of the diameter D2 of valve spool as 4.9, 5.4, and 5.9 mm, and the simulation results are as shown in Figure 16. The upper limits of the charging pressure correspond to points A1, A2, and A3 with the pressures of 11.63, 13.81, and 16.71 MPa and the corresponding values of D2 are 5.9, 5.4, and 4.9 mm, respectively. The lower limits of the charging pressure correspond to the points of B1, B2, and B3 with the pressures of 10.7, 10.7, and 10.7 MPa and the corresponding values of D2 are 5.9, 5.4, and 4.9 mm, respectively. The simulation results indicate that the increase in the diameter D2 of valve spool can decrease the upper limits of the charging pressure and has very little effects on the lower limits of the charging pressure, which validates the correctness of the theoretical analysis.

Batch parameters’ setting of pilot valve.

Batch simulation for charging pressure.

Batch simulation of valve sleeve’s angle for charging valve.

Batch simulation of diameter of spool for charging valve pressure.
Experiment and result analysis
The main objective of the experiments is analyzing and verifying the correctness of the above analysis. These experiments include the upper and lower limit pressures’ verification and special circumstances of charging upper limit’s verification (the pressure of downstream power system Pout is higher than the upper limit pressure).The experimental system is arranged as shown in Figure 17(a) and (b). The pressure sensors are equipped at the inlet of pump, outlet of charging valve, and inlet of accumulator 1 and accumulator 2, respectively, which have a measurement range of 0–35 MPa, and the signal of voltage that ranges from 1 to 5 V will be converted into the signal of pressure that ranges from 0 to 35 MPa.

(a) Experiment system of charging valve and (b) experiment system of charging valve.
Conventional experiment about the charging pressure’s limit
The experimental results are shown in Figure 18 where points A1 and A2 are the upper limit of the pressure with the value equal to 13.83 MPa and distributed in the same horizontal line. Compared with the simulation results, the error rate is 0.2%. In order to facilitate the observation of the lower limit pressure, the leakage is assumed existing in the system. The accumulators are charged again when the lower pressure of the two accumulators is lower than 11.3 MPa (corresponding to points B1 and B2 in Figure 18). Compared with the simulation results, the error rate is 0.2%. Thereby the simulation is accurate and credible.

Experiment for charging pressure.
Experiment for charging pressure with a high pressure of downstream hydraulic system
Aiming at the special case of the upper charging limit of the charging valve, the following experiment is designed for verification. First, the accumulators are charged until the pressure achieves the point A1 as shown in Figure 19. Then, lift the loader boom to the highest position and maintain it. At this moment, the pressure of the working system is increased to the overflow rate pressure of 19 MPa and the accumulator pressure is observed. As shown in Figure 19, the pressures of the two accumulators are increased to the point C1 with a value of 19 MPa, which is the same as the theoretical analysis. That is, the accumulators will be charged until its pressure being the same as the pressure Pout of port O when the pressure of downstream working system is higher than the upper limit pressure of the charging valve. In Figure 19, when the pressure of the working system is increased, the changing rates of the accumulator pressure between front and rear axles are different due to the reason that the rear axle accumulator provides the flow rate to the pilot circuit of working system and its pressure decreases fast. Since the independent safety valve is not set in the braking system, during the design and matching in the whole hydraulic system, it is necessary that the highest pressure of downstream working system cannot be higher than the maximum capacity of the braking system.
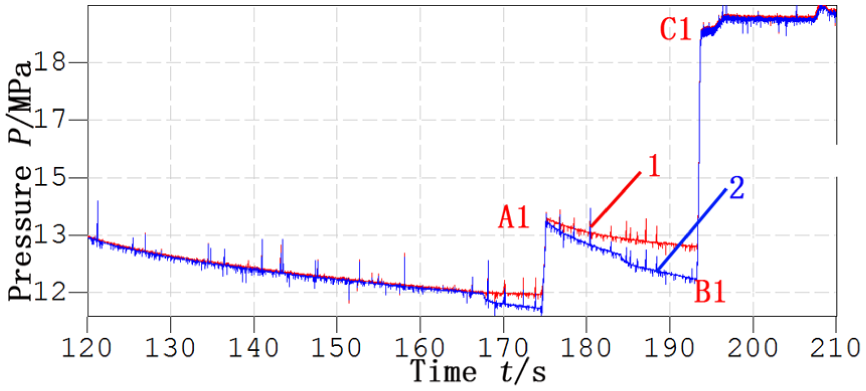
Experiment for higher charging pressure.
Conclusion
In this article, the theory of dual-circuit charging valve is analyzed in detail and an AMESim simulation model is established according to the actual structure parameters of the charging valve. The error rate of the simulation result is 0.4% compared to that of the theoretical calculation, which indicates the model is correct and provides a theoretical basis for the further analysis and research on the static and dynamic characteristics of the charging valve.
The charging flow rate accounts for the total flow rate about 10%–15% and the charging efficiency is guaranteed since the charging process is completed in 1.1 s. Hence, the whole charging process works in a relatively high-frequency range and the charging valve has an excellent dynamic characteristic.
The key parameters of the charging valve in dual-circuit braking system are ball valve diameter D2, the valve seat angle α, and the initial force of the control spring. The increase in the valve seat angleα will increase the lower limit of the pressure of the charging valve and the increase in the valve diameter D2 will decrease the upper limit of the pressure of the charging valve. These conclusions provide a reference for the series production of the charging valve, which also proves that AMESim plays an important role in the design and analysis of hydraulic components.
Finally, the experiments are carried out to verify the AMESim model. The simulation results indicate that the error rate between the experiment and the simulation is less than 0.5%, which verifies the correctness of the theoretical analysis and the simulation.
Footnotes
Academic Editor: Mario L Ferrari
Declaration of conflicting interests
The author(s) declared no potential conflicts of interest with respect to the research, authorship, and/or publication of this article.
Funding
The author(s) disclosed receipt of the following financial support for the research, authorship, and/or publication of this article: This work was financially supported by the National Natural Science Foundation of China (Grant No. 51405187) and Fundamental Research Funds for the Central Universities.