
Abstract
Simulation is a powerful tool in the design and analysis of diesel particulate filters. Various models have been developed in the last three decades and great improvements have been made in terms of model comprehensiveness and accuracy. However, simulation of diesel particulate filter is still not a reliable resort to fine-tuning of diesel particulate filter and much effort is still needed. To promote the development of effective simulation models, first, the various models are viewed. Their characteristics and application occasions are discussed. Second, regarding the limitations of these models, some key submodels are introduced, which are pressure drop model in the wall, filtration model, and soot oxidation model. Finally, some conclusions are made and further researches are recommended.
Introduction
There are growing concerns about the emission of motor vehicles due to their adverse health effects and the climate change. Global emission standards for motor vehicles are becoming increasingly stringent, forcing the industry to adopt green energy or advanced internal combustion engine. Motor vehicles still rely on internal combustion engines for propulsion because of the high cost or low convenience of the competitors, such as electric cars. Diesel engine or gasoline direct injection (GDI) engine is more energy saving, but exhaust much larger amount of particulate matter (PM) than the port fuel injection engine. 1 The Euro 6 emission standard has the same PM requirement for diesel engine and GDI engine, which is 4.5 mg/km in mass and 6 × 10¹¹ #/km in number. To fulfill this high requirement, diesel particulate filter (DPF) is a standard configuration for diesel engine, and the future GDI engine may still need to be installed a particulate filter like the DPF. This calls for the development of DPF technology to achieve demanding requirements in space and cost, especially in passenger cars. 2
DPF has been studied for more than three decades. Traditional experiment approach is very time-consuming and costly, thus provides a privileged window of opportunity for the application of simulation tools, and simulation is increasingly being used for the design of exhaust after-treatment systems with a DPF. 3 DPF behavior strongly depends on the coupling of physico-chemical phenomena occurring over widely disparate spatial and temporal scales. Various models have been proposed and most of them are in the channel scale. Classified by the dimension of flow in the channel, these models are described by one-dimensional (1D) channel, two-dimensional (2D) channel, and three-dimensional (3D) channel model. However, these channel models are unable to consider the inlet non-uniformity and radial heat transfer, so multi-channel model in the filter scale is proposed. All the aforementioned models are very weak in simulating the flow in the wall, so more detailed model called pore-scale model has been introduced to help analyze the flow and the soot depositing process in the wall. DPF models have been reviewed by Konstandopoulos et al. 3 and Koltsakis et al. 4 However, this article gives a more general introduction of various models and the state-of-the-art modeling technology of DPF.
Despite that various model have been proposed, the uncertainties in the soot loading, filtration, and oxidation model remain large. Models’ results have not been accepted unquestionably due to the uncertainties about the soot layer physical properties and the phenomena taking place inside the ceramic porous media during loading and regeneration. Meanwhile, only few experimental measurements present good repeatability and can be used for model tuning and validation. 5 For the above reasons DPF modeling has not yet managed to become a reliable resort for fine-tuning of DPF operation. Therefore, this article will also give a brief review of three important submodels, that is, pressure drop model, filtration model, and soot oxidation model, which provides insight to the physical processes in the DPF and discusses the uncertainty of DPF model in depth.
The article is outlined as follows: first, models in the channel scale are introduced. Second, the multi-channel model is reviewed. Third, pore-scale models are presented. Fourth, all these models are compared and discussed. Fifth, the three submodels, that is, pressure drop model in the wall, filtration model, and soot oxidation model, are introduced. Finally, conclusions and recommendations are made.
Development of DPF models
Since the introduction of DPFs in the early 1980s, different geometric DPF configurations have been used, but so far the most promising configuration is the wall-flow monolith honeycomb, because it demonstrates a very compact arrangement, high filtration efficiency, and thermal capacity.
A wall-flow DPF consists of a monolithic structure with a bundle of axial parallel channels. Channels are alternatively plugged at each end (see Figure 1), so that the gas in inlet channels is forced to flow across the porous wall of DPF while particles are removed from the exhaust gas. The collected PM inside the trap has to be periodically oxidized by some means to reduce the back pressure on the engine. The burning of the PM inside the trap is referred to as regeneration.

Schematic of wall-flow diesel particulate filter.
Very complex phenomena happen in DPF, and it is difficult to investigate experiment methods due to the limitation and high cost. Simulations of DPF are very popular. Various simulation models have been proposed. They are separated by the model scale. In general, there are three coexisting length scales that need to be taken into account for the modeling of DPF, 3 that is, filter wall scale, single channel scale, and the entire DPF scale. Wall scale modeling is actually simulated by the pore-scale model. All of these models are reviewed in this section.
1D single channel model
The first widely adopted 1D model is proposed by Bissett. 6 The major assumptions of his model are as follows:
The properties of the gas entering the front face of the monolith are spatially uniform.
The filter has no temperature gradient in radial direction.
The emitted particles do not interfere with the flow.
The time derivatives of the bulk gas flow variables are omitted.
The filter temperature is the equal temperature of both phases in the filter and independent of the radial direction.
The change in the channel due to the presence of the soot layer is neglected.
The exhaust gas flows through two layers: the particle deposit, which shrinks uniformly with time during regeneration, and the porous ceramic channel wall. The soot deposition is assumed uniform over the monolith channels.
Therefore, a single inlet and outlet channel represents the behavior of all inlet and outlet channels. Flow velocity, temperature distribution, and pressure loss were studied in his model. Most of the 1D DPF modeling efforts of today derives from Bissett’s model and some of his assumptions are reassessed and improvements or extensions are proposed.
Konstandopoulos and Kostoglou7,8 expanded Bissett’s model to consider the catalytic coating on the filter wall. Catalytically affected soot is oxidized through two paths, a catalytic path over a certain fraction of its specific area and a thermal path over the rest. Each path has in principle its own activation energy and frequency factor assumed to be given by a modified-Arrhenius form.
Haralampous and Koltsakis 5 dealt with the temperature uniformity assumption in the soot and wall layer in general 1D model. They added additional grid to predict temperature gradient inside particulate layer and porous wall. It was found that significant temperature gradient existed under some operating conditions, which were associated with high flow rate and large initial particulate loading.
Haralampous and Koltsakis9,10 added a diffusion model in 1D model to account for oxygen diffusion and NO2 back-diffusion on DPF regeneration. The effect of oxygen diffusion is minor and observable only at high soot loadings and uncontrolled regenerations. The contribution of NO2 back-diffusion was responsible for about one-third of the total regeneration rate for catalyst-coated filter. Their works were not calibrated by experiments.
Guo and Zhang 11 proposed a 1D model without the uniform particle layer thickness assumption in Bissett’s 6 model. A distinctive U-shaped particulate layer thickness distribution was found during particle loading, which was caused by non-uniform wall velocity.
Depcik and Assanis 12 discussed the effectiveness of the assumptions of neglecting soot thickness and temperature difference of the gas and the wall in Bissett’s 6 model. The pressure drop predicted by two models is shown in Figure 2. It can be concluded that as soot loading increases, the area conserved model by Depcik is more accurate than the classical model. However, they found that neglecting soot thickness and gas temperature in the wall were valid within the range of typical DPF applications.

Depick’s 12 area conserved model and the classical model versus experiment data.
Torregrosa et al. 13 added the transient term in the flow model to take into account the pulsation of the exhaust gas. The results show that the traditional model is no big difference than their new model below the 200 Hz pulse flow. It can be concluded that the traditional quasi-steady-state model is applicable in normal condition of DPF.
2D single channel model
Opris and Johnson14,15 developed a 2D computational model to study the flow, heat transfer, and regeneration behaviors of DPF. By neglecting nonlinear terms in Navier–Stokes (NS) equations, an analytical solution for flow field was derived. This model described the steady-state trap loading, as well as the transient behavior of the flow and filtration processes. Zhang et al. 16 also presented a 2D single channel model to simulate the filter performance during loading and regeneration. An analytical approximation for the flow field was developed by simplifying the NS equations through an order of magnitude analysis.
Models provided in Opris and Johnson14,15 and Zhang et al. 16 are computationally efficient. However, 2D model applying commercial software is more easy to program and has less assumptions. Piscaglia et al. 17 developed a 2D model by modifying the KIVA 3V code to study the velocity field and the deposition of soot in particulate filters. The particle is simulated by Lagrangian transport. Deuschle et al. 18 studied the filtration, regeneration, and deposit rearrangement effects in the 2D context with Fluent. Sarli and Benedetto 19 investigated the effect of the catalyst activity on the regeneration dynamics of DPF. The temperature profile when the maximum temperature is reached is shown in Figure 3. The front of the filter ignites first, and when a combustion front moving downstream, maximum temperature is reached in the outlet section.

Channel temperature distribution at peak during regeneration. 19
3D single channel model
The 3D single channel model usually applies commercial CFD software. It is used to calibrate the 1D single channel model. Konstandopoulos et al. 20 found that 1D single channel model matches well with 3D model, as shown in Figure 4, hence now researchers are interested to use 3D model to study the particle dynamics in channels.
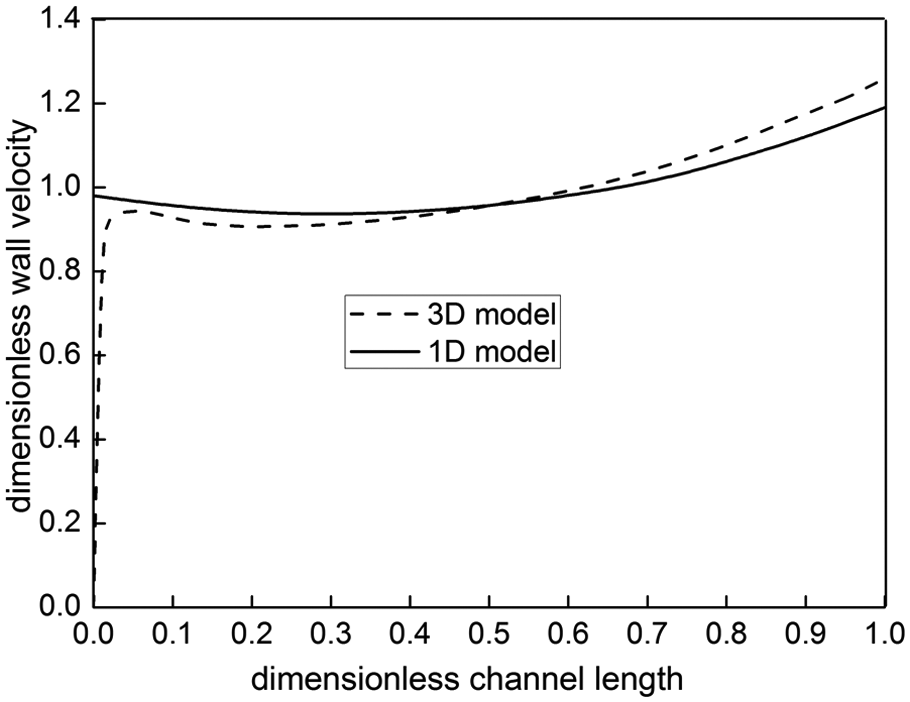
Wall velocity in a filter by 1D and 3D single channel model. 20
Sbrizzai et al. 21 used a Lagrangian approach to model the particles as non-interacting, non-deformable solid spheres, considering one-way coupling momentum transfer between particles and fluid. The force on the particle was drag force taking into consideration slip correction and Brownian force. They found that larger particles show a larger tendency to deposit at the end of the filter. In addition, due to the flow contraction at the inlet, virtually there is no particle deposit in the inlet section of the filter.
Bensaid et al.22,23 developed a 3D model to study the soot deposition process and regeneration of the filter. They used Eulerian–Eulerian approach to simulate the gas and particles. The filtration model is based on unit collector model from Konstandopoulos et al. 24 They also predicted an uneven soot deposition profiles in the first steps of the filtration process as Guo and Zhang. 11 However, the very high resistance to the gas flow of the readily formed cake layer determined the evolution into an almost constant layer of soot particles. Compared with the Eulerian–Lagrangian method in Sbrizzai et al., 21 this method is much more computation efficient. However, the particle depositing process is not directly modeled, but with empirical model.
Lee and Lee 25 also applied Eulerian–Eulerian approach to model the two-phase flow in a DPF. The basic method was similar to Bensaid et al.22,23 They found that more particulates were deposited near the inlet and outlet areas than in the middle of the channel; profiles of the soot cake layer formed inside the channel were found to be shaped in a parabolic curve along both the length and the width of the channel.
Multi-channel model
A full-scale DPF is usually modeled by multi-channel ways scaled up from a 1D channel model, because direct simulating every channel with standard CFD tools is very time-consuming. Multi-channel models are divided into 2D or 3D model. A 2D model scaling up from a single channel to the entire filter scale is in two ways. One line of approach is to discretize the cylindrical DPF in the radial direction with axisymmetric radial sectors. Assuming that all channels in the same radial sector behaved the same, a representative channel for each sector is solved. A 1D model is usually employed to depict a representative channel in each sector. An alternative way to deal with the scale-up problem is to employ a continuum model of the honeycomb structure. 26 For 3D model, a popular solution to perform full-scale DPF simulations is to embed an external 1D single channel model within a 3D multi-channel model with an additional solid region to account for the heat transfer between channels.
Konstandopoulos et al. 27 developed a continuum model of the honeycomb structure. They used this model to study the influence of catalyst, loading and inlet non-uniformities on regeneration. They found that insulation of the inlet cones can lead to a gain of 30% in regeneration efficiency by eliminating radial temperature gradients at the inlet filter face. 26
Haralampous et al. 28 assumed all filter channels in the same radial sector behaved the same, and a representative channel for each radial sector was solved. Loading non-uniformity and partial regeneration phenomena were studied with this model. They found that filter thermal loading can be significantly higher in case of initially non-uniform soot distribution. They suggested that the design of durable filters and efficient regeneration systems should not only be based on a maximum allowable soot loading but also take into account the additional risk of “unexpected” thermal stress resulting from non-uniformly distributed soot.
Galindo et al. 29 used a 2D model to calculate the temperature distribution of a DPF. The monolith was discretized in the radial direction by means of concentric channel beams where all the pairs of inlet and outlet channels were assumed to behave the same. The radial heat flues were modeled by means of equivalent thermal resistance linking adjacent channel beams. The temperature of the periphery of the filter is much lower than that in the center (shown in Figure 5), highlighting the necessity of insulation of the filter.
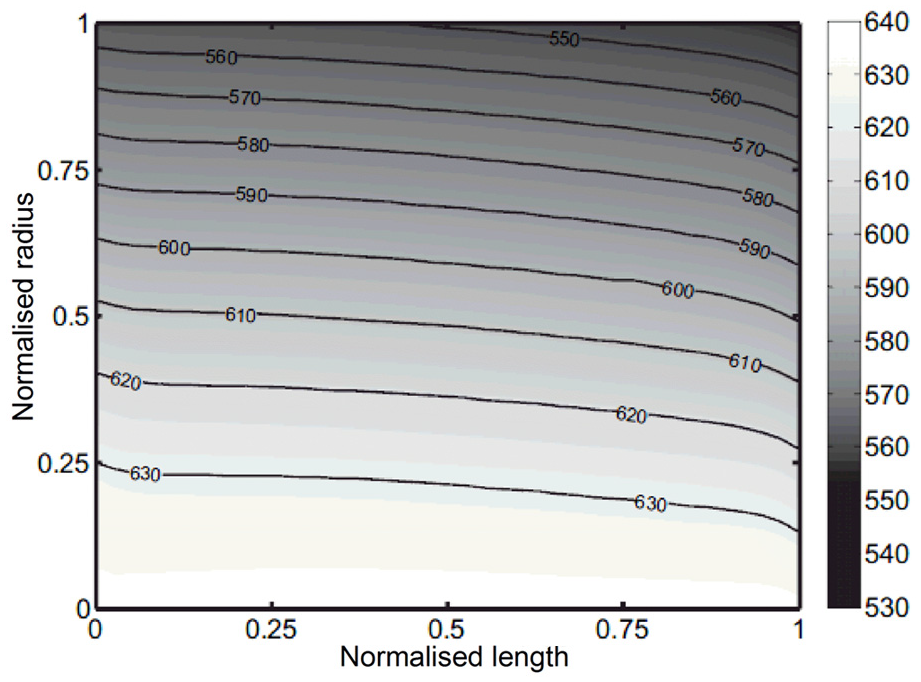
Temperature distribution in a filter by 2D model. 29
Yi 30 simulated the soot loading in a DPF using a 3D macroscopic model. The 3D filter was partitioned into sectors, and each sector represented a group of single DPF channels. One sector was modeled with a 1D single channel model. Hinterberger et al. 31 used a 3D macroscopic continuum model to study the regeneration of DPF, and Piscaglia et al. 32 adopted the same idea to model the flow in a DPF without implementation of the heat transfer between channels. Using this method, the permeability of the medium must be tuned to achieve a good agreement with experimental results.
Pore-scale simulation
Pore-scale simulation is a powerful tool to analyze the flow and particle deposition in porous wall. Simulating the flow in porous material is very challenging and computation intensive due to complex geometry of the material and very fine scale of particle.
There are many works on pore-scale simulation studying the flow and deposit process in filters. Tosco et al. 33 used Fluent to study the Darcy–Forchheimer law for shear-thinning fluids through porous media. Narsilio et al. 34 applied a finite element method solver COMSOL to calculate the soil hydraulic conductivity. Long and colleagues35,36 studied the collection efficiency in clean-bed filtration in sphere collectors by lattice Boltzmann method (LBM). Boccardo et al. 37 also studied the collection efficiency of various geometries, in which fluid flow was solved by finite volume method and the particle was simulated in a Eulerian way. Figure 6 shows the particle concentration distribution in the porous media by Boccardo et al. 37 The smaller particle is prone to be deposited in the upper side of the wall by strong Brownian force, while the larger particle tends to pass through the filter.
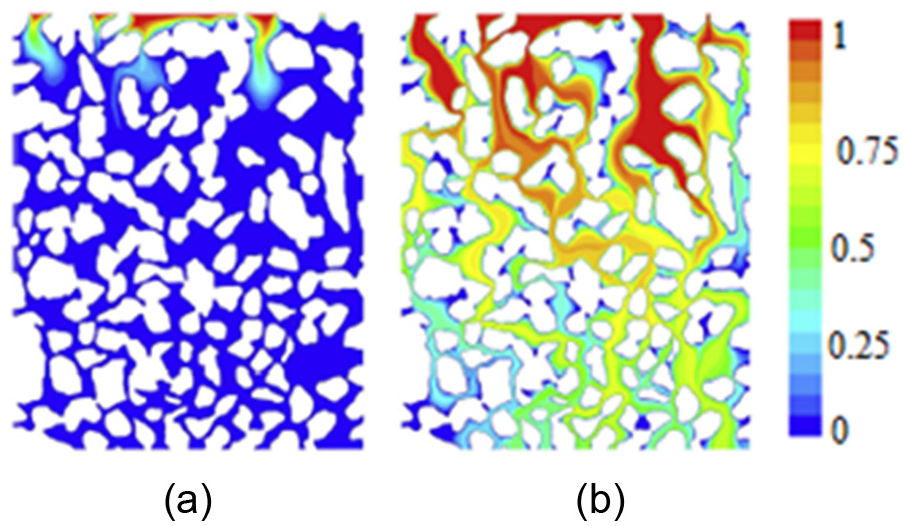
Contour plot of normalized particle concentration for different particle diameter: 37 (a) dp = 1 nm and(b) dp = 100 nm.
The above papers are all about the liquid flow in porous media. The continuum hypothesis for the fluids holds true. When simulating the gas flow in porous media such as a DPF, the transitional flow effect may need to be considered.38,39 Many works on gas–solid flow is in the context of fiber filter, focusing on the pressure drop, collection efficiency development and the particle microstructure, and the numerical methods including LBM, discrete element method, Monte Carlo method, and so on. However, pore-scale simulation in diesel particular filter is rare. Muntean et al.
40
studied the DPF regeneration with LBM, while the soot layer was unable to be resolved and particle loading was not modeled. Yamamoto et al.41–43 simulated the flow and combustion in a DPF using the LBM. Porous structure of the filter is obtained by a 3D x-ray CT technique. The simulation domain is shown in Figure 7, and the size is

Simulation domain. 42
Summary
The widely adopted 1D single channel model is a simple and computing efficient method. During early development of particulate emission control systems, it provides a fast means for basic DPF design and sizing analysis. The 2D single channel model gives little improvement compared with 1D model while losing flow detail compared with 3D model. Considering the fast increasing computation speed in the last years, 2D single channel model is giving way to 3D model. The 3D single channel model is no computation intensive and advantageous in calculating the particulate trajectory and distribution in a channel. Besides, pressure loss due to inlet contraction and outlet expansion can be well solved by this kind of model.
Despite the advantages of 3D single channel model, the 1D single channel model is preferred. Although the flow in the filter channels is actually 3D, it can be accurately approximated by a perimeter-averaged 1D configuration. 20 Therefore, 1D model becomes attractive because of its computation efficiency and easy to program. What makes it more competitive is that when the inlet non-uniform or the radical heat transfer is necessary to consider, the 1D single channel model can be developed into a multi-channel model, which provides more comprehensive analysis of the DPF. Usually the radial heat transfer, inlet non-uniformity, and thermal stress are analyzed by a multi-channel model. Complete 3D modeling of the DPF in filter scale is scarce because of the huge computation burden and little advantages compared with the multi-channel model.
The models in the channel scale or larger usually treat the wall flow very rude. Pore-scale simulation is a good tool to analyze the phenomena in the wall. This technology is widely adopted in soil filtration modeling in underwater, oil refining, and aerosol filtration simulation. Simulation the gas–solid two-phase flow in fiber filter is very popular, focusing on the pressure drop and filtration efficiency revolution and deposit structure. However, this has not been achieved in pore-scale modeling in DPF, mostly because of the complex geometry and small scale in DPF wall. The existing few researches on pore-scale modeling of DPF focus on the regeneration of the DPF. The main simulation method is LBM, since it is advantageous to deal with the porous media. However, the pore size will decrease during loading and the flow may go into transitional flow region, so the LBM based on the NS equation may be not valid. The particle should be modeled in a more direct way rather than by calibration as Yamamoto and Yamauchi. 43 The pore-scale flow simulation is computation expensive and usually for basic filters’ material development. Whether it can help to describe the pressure drop evolution during loading and study the filtration phenomena, it remains to be seen.
Submodels of DPF modeling
Although many models in difference scales have been proposed, the modeling of DPF has not been a reliable tool in design and optimization of DPF. Many works are just only based on simulation without validation. In some works,16,41–43,44 the pressure drop model is validated while some key parameters such as soot permeability and density are treated very crudely. Some researchers11,16,23,25,45 incorporate the filtration model in their studies but without rigorous calibration. The regeneration process is widely studied,6,9–12,18,23,46 but the soot oxidation model is weakly handled. To get a reliable modeling result, the submodels especially the key parameters in the submodels must be accurately defined. Therefore, three main submodels, that is, pressure drop mode in the wall, filtration model, and soot oxidation mode are reviewed in this section.
Pressure drop model
Pressure drop modeling is very important for the design and control of DPFs. On one hand, filter design should target the minimization of pressure drop in real-world conditions. On the other hand, the control of the regeneration process by the engine management should take into account the mass of accumulated soot in the filter, which is commonly assessed by interpreting the pressure drop measurement on-board. Furthermore, pressure drop measurements are expected to support the task of on-board diagnosis of a filter structural failure. 47 In this section, only the pressure drop in the wall will be discussed because it is the major source of uncertainty of the pressure drop in a filter.
Pressure drop in a clean wall
For a clean filter, the widely adopted pressure drop model in the wall is

The parameters appearing in equation (1) that needs to be specified to make estimations of the pressure drop are the Darcy permeability
It has been validated that Forchheimer inertial losses are negligible compared to the Darcy losses in the case of typical commercially available wall-flow DPFs,
49
so it can be neglected.

where

SCF in equation (3) is the Stokes–Cunningham factor to correct the slip flow effect


The unit collector diameter

where
Pressure drop in a loaded wall
The pressure drop in the wall becomes much more complex during filtration. It is widely accepted that filtration is separated into two subsequent phases: in the first phase, called deep bed filtration, the particles are collected inside the filter porosities. This phase is characterized by a nonlinear increase in the pressure drop; when the maximum particle packing density is reached inside the porous media, a soot layer on the filter channels surface is built up. This phase is called soot cake filtration: the pressure drop starts increasing linearly with time. 23
For the deep bed filtration, Konstandopoulos et al. 24 developed a model to calculate the permeability change due to particulate deposition. The permeability calculation is based on soot packing density inside the porous wall and a shape factor dependent on soot penetration and loading. This model usually combines with the filtration model and will be discussed later.
Considering that penetration of soot mass inside the porous wall is only partial in wall-flow monoliths, 51 many researchers assume that all the particulate is deposited on the wall. Therefore, the pressure drop caused by the loaded soot is calculated by

Usually the velocity in the soot layer is low, so that Forchheimer term
Study on soot layer permeability and density
The soot layer permeability and density are typically evaluated best via experiments. However, measuring the soot packing density on a DPF channel filtration wall is cumbersome since this requires destructive testing of the filter, expensive ex situ instrumentation, so lack of experiment data causes a huge deviation in these parameters. The values some researchers adopted are listed in Table 1. The layer density is usually in the range 75–200 kg/m3. The value of Bissett 6 is too high. The soot permeability is in the range of 1–6 × 10⁻¹⁴ m2, but the majority researchers don’t explain how they get the values.
Soot layer properties in simulation.

Most experimental studies so far apply indirect measurement. The general idea comes from that pressure drop can be decided by equation (8). Using the concept of effective particulate layer thickness and neglecting the Forchheimer term, equation (8) can be rewritten as following
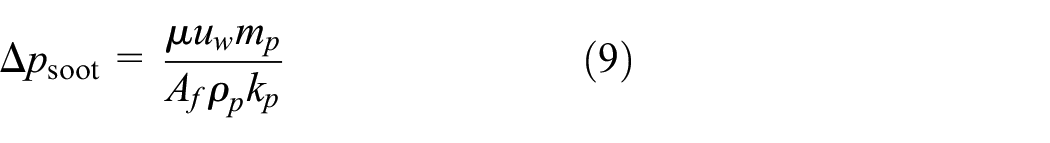
Using equation (9) can only decide the product of density and permeability. Applying multiple metering and data fitting,
The density and permeability of soot layer estimated by Opris and Johnson 15 are in the ranges 700–1800 kg/m3 and 2–4 × 10⁻¹⁵ m2, respectively. Suresh et al. 56 applied a similar method and found soot layer density was 915, 849, and 598 kg/m3 in three different filters. The values of density are very high, which indicate that applying a method through data fitting with a not well-conditioned experiment result can barely give reliable results.
Koltsakis et al. 52 got the permeability and density of soot layer through optical method. The density values obtained range from 25 to 100 kg/m3. Liu et al. 57 collected diesel particle on a polytetrafluoroethylene (PTFE) filter, and they found that the particle porosity varied from 0.93 to 0.97, which means that the particle layer density is 40–120 kg/m3.
The previous researches show large deviation in soot layer permeability and density, hindering a precise pressure drop prediction. Although some of the published works have claimed good agreement between measured and predicted results, the main difficulty in assessing model accuracy is the uncertainty in the experimental conditions themselves.
58
It can be estimated that the density of soot layer is around 100 kg/m3 from the literature, depending on many factors. There is no agreement on how these factors influence the density. Sorenson et al.
59
studied the influence of the pressure drop on
Filtration model
DPF filtration model is based on the classic colloid filtration theory. Generally, these models are developed for a single collector, while the influence of the other grains of the porous medium on the flow around this collector is accounted for through geometry-based, often empirical, corrective parameters. Moreover, these solutions are valid only for clean-bed filtration. 37
The first application of filtration theory to DPFs was introduced by Konstandopoulos and Johnson. 61 The theory describing each filtration mechanism relates to a number of characteristic numbers for the phenomenon under study. Each of the filtration mechanisms is characterized by one or more dimensionless parameters. In addition, each of the filtration mechanisms is characterized by a capture coefficient. The overall capture coefficient is composed of the relationship that governs the overall filtration mechanism. The concept comes from the theory of filtration through a bed of spherical collectors. The model mostly comes from Lee and Gieseke, 62 who proposed a Peclet number Pe to calculate the diffusion collection efficiency and interception parameter NR to calculate the interception collection efficiency. The main part of the model is listed as follows:
1. The Brownian diffusion efficiency is

The constant in equation (10) is equal to 3.5 according to Lee and Gieseke
62
and 4 according to Gutfinger and Tardos.
63
The discrepancy is due to different methods of diffusion boundary analysis.

Peclet number, Pe, is defined by

where
The diffusion coefficient,

2. The interception efficiency is

where the interception parameter,

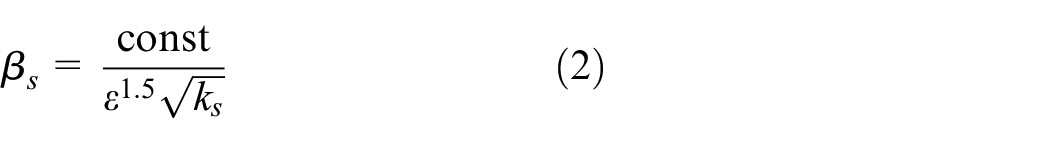
The exponent s depends on the porosity of the filter

A modified model is proposed to take into account the increase in collection efficiency due to soot loading.
24
Compared with the model in Konstandopoulos and Johnson,
61
the main change is that the filter wall is divided into slabs and calculation of the variation of the diameter of the local collector dc, and local porosity


The particles are collected initially inside the filter wall but eventually, they form a cake on its frontal area. It is therefore useful to define a partition coefficient


where
Tandon et al. 65 adopted a different correlation of diffusion collecting efficiency


They divided the deep bed filtration process into two stages. In the first stage, there is rapid increase in filtration efficiency with soot loading, without any change in number of collectors. During the second stage, no significant change is observed in porosity and mean collector diameter with further soot deposition, but the collection of soot particles results in blocking some pores and hence reduction in the number of collectors. Compared with the model in Konstandopoulos et al., 24 this model can increase the model accuracy at the cost of more calibration works.
The model in Konstandopoulos et al. 24 is widely adopted.11,16,22,25 Usually the model validation is based on pressure while the filtration efficiency is not validated. It seems that researchers are more interested in applying this simple concept to model the pressure drop during deep bed filtration. For the soot collection efficiency, on one hand, it is difficult to estimate the error that occurs when collection efficiency correlations derived from simple conceptual models are used to predict collection efficiency for filters with a more complex pore geometry; on the other hand, the particle concentration and size distribution in engine exhaust gas vary so much that it should test the filtration performance of a filter in experiment. Therefore, it is not practical to design a filter filtration performance based on simulation. It is a good tool to understand the filtration mechanism and may be improved by the pore-scale simulation.
Soot oxidation model
Efficient design and operation of DPF systems are required to achieve high regeneration performance, particularly considering the energy saving and maintenance costs associated with diesel engine systems. Therefore, finding efficient regeneration strategies is the key to developing an advanced DPF system. Development of such a system requires a detailed understanding of soot oxidation kinetics in relation to exhaust emission components and ambient conditions. 66 However, most of the published papers on simulation treat the soot oxidation rate very roughly. In many works,5,10,12,14,16 only the soot reaction equation is given, while the values of parameters in those equations are not mentioned. The reason of this is that getting the accurate value of the soot oxidation model is very difficult. Meanwhile, in the simulation of DPF, many researchers focus on revealing the phenomena in DPF, rather than the exact value. However, soot oxidation is very important to DPF design and control. Therefore, a brief review of diesel soot oxidation is given.
Diesel soot oxidation is widely investigated. The literature data regarding soot oxidation kinetics by oxygen, under conditions typical for diesel exhaust, is often contradictory. This section will briefly introduce on the O2 non-catalytic oxidation on diesel soot. For the sake of brevity, the catalytic oxidation and NO2 oxidation is also excluded. The soot oxidation rate by various researchers is presented in Table 2.
Previous researches on diesel soot oxidation.

From Table 2 it can be concluded that the reported results show a great deal of scatter in observed reaction rates, activation energies, and reaction orders with respect to oxygen. That is normal, considering that the diesel soot characteristics are influenced by engine condition, fuel type, and so on. Moreover, the result is also influenced by measurements. Diesel soot has a large part of soluble organic fraction which makes the oxidation rate depend on the heat history. 70 Activation energy in Table 2 is in the range of 130–170 kJ/mol, so some papers6,58 taking the value of 150 kJ/mol sounds reasonable. Neeft et al. 67 found the order in molecular O2 concentration was about 1 for the flame soot and slightly lower than 1 for the diesel soot. This order in O2 concentration was also found to be a function of conversion. Many researchers 72 taking the reaction order with respect to O2 was equal to 1. Yezerets et al. 68 found that at high carbon conversion rate, the reaction rate moderately increased, which was difficult to model. They suggested that while there appears to be no simple answer for the reaction order in carbon, using the first-order approximation provides a reasonable, practical solution. It is advised that the diesel soot should not be described by a single Arrhenius-type equation, so the divided zone method provided by Chong et al. 70 is provided. Due to the variety of diesel soot oxidation rate, Neeft et al. 67 suggested using the surrogate soot oxidation rate to estimate the reaction rate in DPF design studies. If more accurate data are needed, the reaction rate should be measured.
It can be concluded that there is no generally accepted expression of soot oxidation rate. A single Arrhenius-type equation may be not valid. The production and reaction mechanism of diesel particle are needed to study deeply. Moreover, a standard and more accurate measurement of the soot oxidation is necessary to diminish the huge gap found in previous studies. The simulation of diesel soot oxidation still lacks of theoretical foundation and accurate model. More researches on soot oxidation are needed in future, especially at the micro level.
Conclusion
This article gives a brief view of the various models in DPF simulation. The 1D single channel model is widely studied and many assumptions have been reassessed. The 2D model in the channel scale is transitive and gives the way to 3D model. The 3D single channel model is a good tool to study the particle motion in the channel. However, the most popular model is still the 1D model, because it loses little accuracy compared with the 3D model, and it is computation efficient. Moreover, 1D single channel model is easily scaled up to multi-channel model in the filter scale. Multi-channel model is widely used to investigate the inlet non-uniformity, radical heat transfer, and partial regeneration in filters. All these models are very weak in dealing with the phenomena in the wall, especially the wall property change due to soot loading and the soot characteristics deposited on the wall. The pore-scale simulation is developed to understand the soot depositing process and the flow in the wall. Due to the advantages of modeling porous media, LBM is widely adopted. However, fine scale of particle makes the deposition process seemingly impossible to model with grid scale adopted in the pore-scale model. Moreover, slip flow effect may be needed to consider, so the traditional LBM based on NS equation may not be valid. There still needs more effort to improve the model and develop more fine model to find the soot layer property and filtration performance of the DPF.
Many models have been proposed to reveal the phenomena in DPF and much progress has been achieved. However, some submodels in the simulation still face huge uncertainty. Therefore, it is highly demanded that accuracy of the submodels is improved. Three important submodels, that is, pressure drop model in the wall, filtration mode, and soot oxidation model, are discussed. The pressure drop of a clean wall can be well described by measured wall permeability. The porous media theory can estimate the wall permeability. However, the uncertainty lies in the choosing of characteristic pore diameter and the semi-empirical background. Predicting the wall pressure drop during loading is very challenging. This period usually is divided into two stages. In the deep bed filtration, the pressure drop is nonlinear and some researchers combine the filtration theory and porous wall permeability estimation model to predict the pressure drop. However, the most widely adopted method is neglecting this period just supposing all the soot loading on the soot layer. Using soot layer permeability and soot layer thickness, the pressure drop of a loaded wall can be well predicted by careful calibration. The soot layer density and permeability are difficult to measure, influenced by engine type, fuel, engine condition, and soot loading, which show huge deviation in the literature. The filtration model usually based on unit collector concept, applies several dimensionless numbers to consider the collection mechanism by diffusion, interception, and inertia. In addition to the uncertainty of the model, the particle concentration of engine exhaust is very difficult to get, so it is not practical to design a filter filtration performance based on simulation. It is helpful to understand the filtration mechanism and may be improved by the pore-scale simulation. The soot oxidation model is widely investigated. However, the huge uncertainty remains due to soot characteristics volatility and various measure processes. The soot oxidation mechanism is still unclear especially under exhaust gas environment. A more accurate soot oxidation model can only be obtained by deeply understanding the oxidation mechanism.
The existing problems call for further investigation contributing the DPF simulation. Some of them are briefly summarized here:
A fundamental understanding of the complex interaction of convection, diffusion, and reaction in DPF should be obtained. Intrinsic soot cake properties such as packing density and permeability should be more clearly characterized. This may be realized by identification of soot deposition mechanisms and soot cake microstructures.
The model will describe the actual physics taking place in the DPF by less number of assumptions and more accurate model parameters.
High accuracy and standard measurement are required to calibrate the model and diminish the divergence of the data.
Footnotes
Appendix 1
Academic Editor: Mustafa Canakci
Declaration of conflicting interests
The author(s) declared no potential conflicts of interest with respect to the research, authorship, and/or publication of this article.
Funding
The author(s) disclosed receipt of the following financial support for the research, authorship, and/or publication of this article: This work was supported by the Fundamental Research Funds for the Central Universities of China (grant number: YWF-15-SYS-JTXY-007), the National Natural Science Foundation of China (grant number: 51576011) and the Natural Science Foundation of Beijing Municipality (grant number: 3132021).