
Abstract
The seismic performance of ultra-high-performance concrete–high-strength steel pier was studied using fiber elements, which are capable to model accurately elastic–plastic behavior of members with fibers of different material constitutive relations. For high-strength steel–ultra-high-performance concrete piers, the modified Kent–Park model was utilized to describe the compressive stress–strain relations of ultra-high-performance concrete and high-strength steel-confined ultra-high-performance concrete, respectively, by determining four key parameters. A finite element model was established to simulate the hysteretic response; conduct parameter analysis including axial load ratio, longitudinal reinforcement ratio, and transverse reinforcement ratio; and assess the maximum ground acceleration capacity based on inelastic response spectra for high-strength steel–ultra-high-performance concrete piers. The conclusions are summarized that modified Kent–Park model is proved to be effective due to experimental data. The calculated hysteretic curves of high-strength steel–ultra-high-performance concrete piers show good agreement with the experimental results. Three parameters have evident effects on seismic performance of high-strength steel–ultra-high-performance concrete piers, which indicates that various seismic demands can be achieved by reasonable parameter settings. Compared to nonlinear dynamic analysis based on finite element model, the results provided by inelastic response spectra are less conservative for short high-strength steel–ultra-high-performance concrete piers under high axial load ratio.
Keywords
Introduction
For bridge engineering in seismic region, reinforced concrete (RC) piers are usually designed to be ductile components to absorb earthquake energy using lateral reinforcement. With development of society, exterior loading including traffic loading becomes heavier, resulting in huger piers and larger lateral reinforcement, which is very uneconomical choice. With higher compressive strength, improved toughness, and increased damage tolerance, ultra-high-performance concrete (UHPC) is more suitable for heavily loaded structural components than traditional concrete in seismic region.1–3
Over the last two decades, a number of studies focused on the material properties of UHPC such as ductility, toughness, fracture energy, strain hardening, and deformation capacity under both tension and compression loading, which proves UHPC a promising material for structural application.4,5 To take full advantage of UHPC, high-strength steel (HSS) is a good choice to work together. A series of pseudo-static tests on HSS–UHPC piers under axial load were conducted to study the seismic performances including energy dissipating capacity and deformation capacity.6–10 But all researches aforementioned were based on the experimental results and the number of specimens is very limited. To accelerate the application of HSS–UHPC piers in seismic zones, further researches including finite element model (FEM) are necessary.
For FEM, compared to resultant section model, fiber elements can represent more accurately important aspects of structural response including the interaction of axial load and biaxial bending moment, confinement effect, and material softening behavior. 11 As a result, the nonlinear seismic performance of RC members is popularly researched with fiber elements derived from divided sections integrated by concrete and reinforcing steel fibers.12,13 Similar to RC members, modeling seismic behavior of HSS–UHPC piers with fiber elements requires uniaxial constitutive laws referring to skeleton curves and hysteretic laws of UHPC, and HSS-confined UHPC at first.
Some attentions have been focused on uniaxial stress–strain skeleton curves of UHPC, most of which are only used to predict bearing capacity of members and cannot reflect the entire stress–strain curve including post-peak zone.5,8,14–16 Compared to UHPC, only a few trial researches have been conducted on uniaxial stress–strain skeleton curves of HSS-confined UHPC.3,8 What is more, the uniaxial hysteretic laws of both UHPC and HSS-confined UHPC have not been reported so far.
For the monotonic envelope curves of confined or unconfined concrete in compression, the modified Kent–Park model, which was proposed by Kent and Park 17 and extended later by Scott et al., 18 is a good choice to balance between simplicity and accuracy, even though more accurate and complete models have been published. 12
In this article, the uniaxial compressive stress–strain curves of UHPC and HSS-confined UHPC are expressed in modified Kent–Park model. Other uniaxial constitutive laws of UHPC and HSS-confined UHPC are assumed to conform to the model proposed by Mohd Hisham. 19 Using fiber elements, an FEM is established for HSS–UHPC piers based on OpenSees platform. 20 8 HSS–UHPC piers tested are used to verify the FEM, which is utilized later to conduct parameter analysis on seismic behavior affected by axial force ratio, longitudinal reinforcement ratio, and transverse reinforcement ratio. Dependent on the FEM, nonlinear dynamic analysis is used to assess maximum ground acceleration capacities of HSS–UHPC piers due to inelastic response spectrum.
Material constitutive models
To establish FEM with fiber elements, reasonable uniaxial constitutive models are required to reflect actual stress–strain relations of HSS, UHPC, and HSS-confined UHPC. For HSS, OpenSees platform provides reinforcing steel material, which is based on the uniaxial steel model proposed by Chang and Mander 21 and can consider the effect of plastic strain amplitude and buckling. Moreover, reinforcing steel material gives three parameters to reflect hysteretic laws incorporating degradation behavior with strain range and the number of cycles. In this article, the three parameters were equal to the values suggested by Mazzoni et al. 22 More information can be seen in Figure 1. 22

Parameters of reinforcing steel material.
Concrete 02 given by OpenSees platform is used commonly to simulate unconfined or confined concrete. For skeleton curves, the modified Kent–Park model was used to describe compressive behavior of unconfined or confined concrete.11,18 The model proposed by Mohd Hisham 19 was used to express tensile behavior and reflect tensile damage. The parameters required are shown in Figure 2.
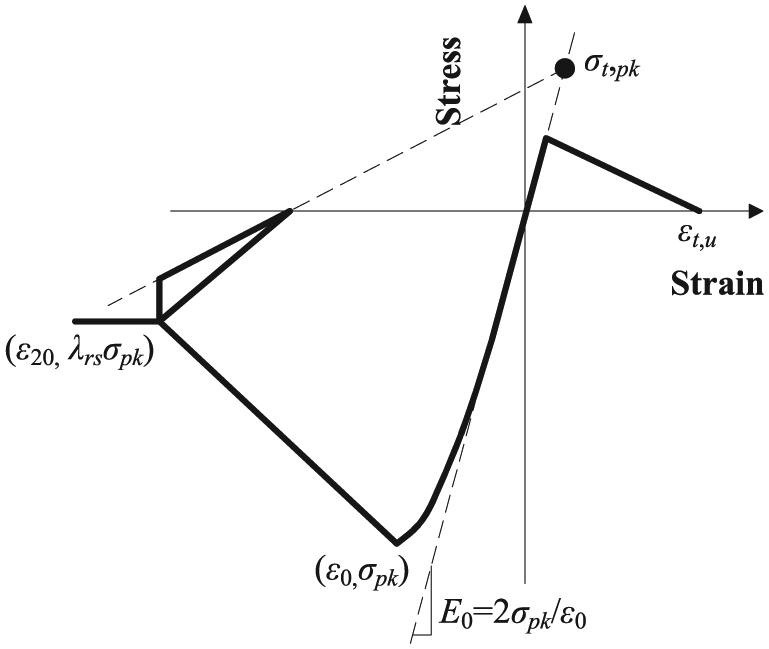
Parameters of Concrete 02.
As seen in Figure 2, the tensile behavior of Concrete 02 is simplified to a piecewise expression including two linear functions. 19 Due to the slope of the first linear function equal to initial elastic modulus of the compressive behavior, only two independent parameters are required to define the tensile behavior.
From the research provided by Sugano et al., 8 the uniaxial tensile stress–strain relation of UHPC is related to the amount of steel fiber. Based on the tests, the peak stress σt,pk and the ultimate strain εt,u(µ) are calculated as follows


where ρsf,V is the amount of steel fiber (vol%) and σB is the cylinder compressive strength of UHPC.
In general, the confinement effect of stirrups can be ignored when core concrete is in the tensile status. So the uniaxial tensile stress–strain relation of HSS-confined UHPC is deemed to be the same as UHPC. 8
In Figure 2, the compressive behavior based on the modified Kent–Park model is obtained as follows 18
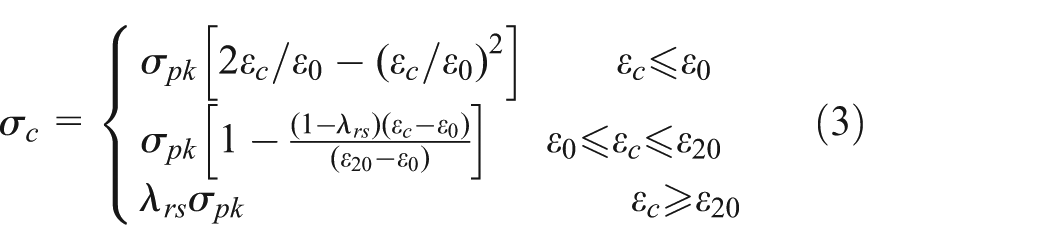
where σc and εc are the stress and the strain of concrete, respectively; σpk and ε0 are the peak stress and the strain, respectively, λrs is the ratio of resident strength to peak stress; and ε20 is the begin strain of resident strength.
For a specified concrete, when four parameters including σpk, ε0, λrs, and ε20 are known, its compressive behavior can be determined from equation (3). Now their owner parameters required are given for UHPC and HSS-confined UHPC in the following section.
Uniaxial compressive stress–strain relation of UHPC
For UHPC, due to the available researches, 8 the peak stress σpk can be given as follows

where λsh is the shape factor, the ratio of the strength of concrete in the pier to the standard cylinder strength. In general, λsh is suggested to be 0.85. 8
From Fafits and Shah’s equation, ε0 can be given as follows

And from Popovics’ equation, ε0 can be given as follows

According to known researches, 8 the actual ε0 ranges between the above two estimations, so the following equation is suggested in this article

The equivalent elastic modulus of UHPC at loading zone Ec is calculated from equation (3) as follows

To remove the error between the elastic modulus measured and that due to modified Kent–Park model, modified factor kE is considered as follows

When modified factor kE is equal to 1.0, 0.85, and 0.70, the respective Ec is compared to the experimental value 8 in Figure 3.

Comparison of elastic modulus Ec tested to the results of the modified Kent–Park model for UHPC.
As seen in Figure 3, when kE is equal to 0.85 or 0.7, the equivalent elastic modulus obtained by the modified Kent–Park model agrees well with the experimental value. From equation (9), kE is closer to 1.0, σpk is closer to the accurate peak stress of UHPC, so kE = 0.85 in this article is suggested to reflect the reasonable peak stress and elastic modulus of UHPC in the meantime. For general concrete, λrsσpk is proposed to be 0.2σB. 23 To consider the effect of λsh and kE, λrs is suggested to be 0.30 conservatively.
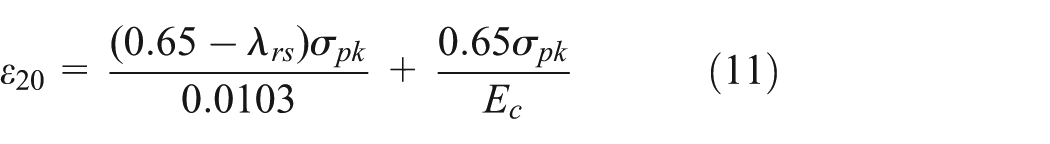
From the stress–strain curve obtained by Sugano et al., 8 λrsσpk and ε20 can be calculated as follows

So ε20 can be predicted as follows
Now, the results of the proposed model are compared to the experimental curves of four specimens in Figure 4. Because the modified Kent–Park model leads to a little larger elastic modulus of UHPC than the experimental results, good agreements can be obtained on the whole. Detailed information of four specimens can be provided by Sugano et al. 8

Comparison of uniaxial compressive stress–strain curves of UHPC to experimental data.
Uniaxial compressive stress–strain relation of HSS-confined UHPC
Similar to UHPC, HSS-confined UHPC based on the modified Kent–Park model is determined by four parameters including σpk, ε0, λrs, and ε20. To make a distinction between UHPC and HSS-confined UHPC, σpk, ε0, λrs, and ε20 are marked as σcon,pk, εcon,0, λcon,rs, and εcon,20, respectively.
From former researches, 8 the peak stress σcon,pk and respective strain εcon,0 of HSS-confined UHPC can be calculated as follows


where ρw is the area ratio of transverse reinforcement to core UHPC and fyv is the yield strength of transverse reinforcement.
Referring to general concrete, λcon,rs is suggested to be 0.2. 18 From the stress–strain curve obtained by Sugano et al., 8 λcon,rsσcon,pk and εcon,20 can be calculated as follows
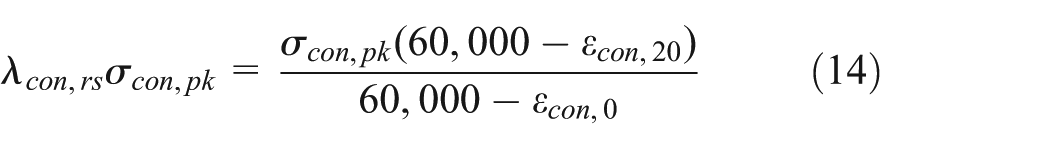
So εcon,20 can be predicted as follows

To verify the model of HSS-confined UHPC, trial values of three specimens are used to compare with the results of the model in Figure 5. As seen in Figure 5, the theoretical results are in good agreement with test. Sugano et al. offered detailed information of the above three specimens. 8
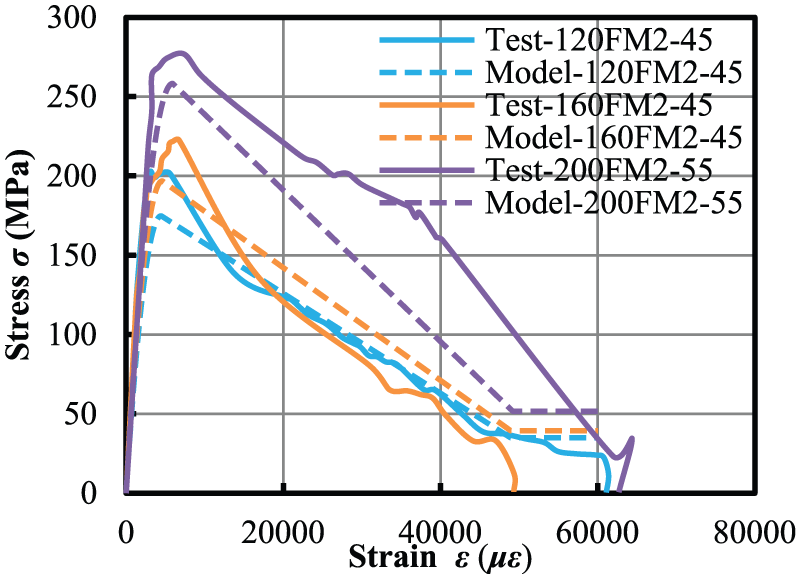
Comparison of uniaxial compressive stress–strain curves of HSS-confined UHPC to experimental data.
It is noted that the uniaxial hysteretic laws of both UHPC and HSS-confined UHPC have not been reported so far. In this research, the above two types of materials are assumed to conform to the hysteretic laws proposed by Mohd Hisham, 19 which include the gradual degradation of stiffness under unloading and reloading in compressive and tensile behavior. 22 More details can be given by Mohd Hisham. 19
FEM of HSS–UHPC piers using fiber elements
Principle of fiber element model
In fiber element model, an element is divided into several sections at integration points along the axial direction. The sections are composed of many fibers which have their own strain–stress relations. Those fibers are assumed to comply with plane section assumption and in uniaxial stress state. If selected material models can reflect objective fact, fiber section would provide accurate load–deformation relations of section, which results in that fiber elements can simulate the total nonlinear response of members excited by ground motions.12,13 The principle of fiber element model can be seen in Figure 6.

Transitive relation between different levels of fiber element model.
Nonlinear beam–column elements
To study seismic behavior of HSS–UHPC pier, nonlinear beam–column elements were the most suitable choice because they not only result in smaller amount of calculation but also reflect more precise nonlinear behavior of components than other elements.12,13 OpenSees platform gives three types of nonlinear beam–column elements including nonlinear beam–column element, beam with hinges’ element, and displacement-based beam–column element. 22
Compared with several displacement-based elements for a single member, force-based elements have the most notable ability to use one element to simulate the material nonlinear behavior of a RC member. 23 Both nonlinear beam–column element and beam with hinges’ element belong to force-based elements. The latter can overcome the problems with nonobjective response caused by strain-softening behavior, but the former cannot. 24 So the FEM of HSS–UHPC pier was established with beam with hinges’ element, which considers entire plasticity to be concentrated over specified hinges’ lengths at the element ends, 25 as seen in Figure 7. The section of the plastic hinge end can be defined by containing three types of fibers reflecting UHPC, HSS-confined UHPC, and HSS, respectively.

Diagram of beam with hinges’ element.
Key parameters
In Figure 8, FEM of a HSS–UHPC pier is established with one beam with hinges’ element, which has only a plastic hinge end used to consider nonlinear effect including reinforcement slide effect and the linear elastic region employed to simulate the linear elastic response. The bottom of FEM is fixed and the top is a mass point, of which the mass results from axial load. At the top of FEM, the mass point is affected by whether it is lateral force or ground motion. In plastic hinge, the section is divided into many fibers representing cover UHPC, confined UHPC, and HSS, respectively. Suitable number of fibers should be selected to balance between accuracy and efficiency. Here, the cover UHPC part is divided into 176 fibers. At the same time, the confined UHPC part is divided into 400 fibers. A steel bar is expressed by a fiber alone.

FEM for HSS–UHPC pier based on OpenSees.
Notably, two key parameters are necessary but have not been reported for HSS–UHPC piers, which are the length of plastic hinge region Lp and equivalent stiffness of linear elastic region EIeff. So they have no choice but to be determined referring to RC piers.
Paulay and Priestley 26 conducted a series of tests on RC piers and gave the computational formula of Lp

where L is the shear span length of the pier and fy and ds are the yield strength and diameter of the longitudinal reinforcement, respectively.
From pseudo-static tests of RC piers, Berry et al. 27 gave the expression of EIeff by regression analysis
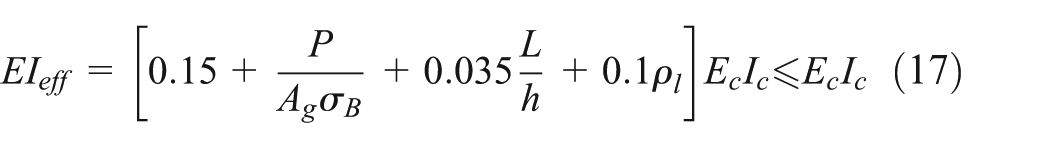
where P is the axial force, Ag is the area of cross section, h is the height of pier cross section, ρl is the longitudinal reinforcement ratio, and Ic is the inertia moment of pier cross section provided by concrete.
Experimental verification
FEM was verified by eight specimens tested,8–10 of which the test parameters are shown in Table 1. As shown in Figure 9, the hysteretic curves measured were compared to the results from FEM. The conclusions can be obtained that two curves of each specimen are in good agreement, except for 03NF16. It may be because 03NF16 does not contain steel fiber and the above two material models of UHPC and HSS-confined UHPC cannot consider the effect of steel fiber on compressive behavior. But for HSS–UHPC piers with steel fiber, the FEM can be still reckoned to be effective.
Characteristics of specimens for experimental verification.

b: width of cross section; η = σo/cσB, σo: axial stress; η: axial load ratio.

Comparisons of the experimental with simulated hysteretic curves.
Parameter analysis based on FEM
Parameter analysis was conducted to study the influence of three parameters including η, ρl, and transverse reinforcement ratio ρw on seismic behavior which refers to damping ratio ξ, residual drift ratio, and ductility factor µ of HSS–UHPC piers subjected to cyclic lateral loading and constant axial load. Cyclic loading with a loading history was applied as specified in ACI 374.1-05, 28 as shown in Figure 10.

Loading history.
From the hysteretic responses, ξ in each cycle is calculated as 29

where Eh is the dissipated energy calculated from the enclosed area within the hysteretic loops, and Ee is the elastic energy calculated from the maximum displacement and peak load in each cycle, in Figure 11, Ee = 0.5x1y1. 29

Proposed hysteresis loop.
From Figure 12, ductility factor µ is calculated as
where um and uy are the maximum displacement and the yield displacement of each specimen tested, respectively. 29

Idealized elastoplastic system for load–deflection curves of piers tested.
The detailed configuration of standard specimen includes that L = 2000 mm, b = h = 500 mm, cover thickness c = 30 mm, σB = 150 MPa, η = 0.15, fyv = 600 MPa, layout of transverse reinforcement is 4ϕ10 mm at 80 mm, fy = 600 MPa, layout of longitudinal reinforcement is 12ϕ10 mm, and ρsf, V = 2%.
Effects of axial load ratio
The effects of axial load ration were studied by six specimens, of which the axial load ratios were η = 0.1, η = 0.15, η = 0.25, η = 0.3, η = 0.4, and η = 0.55, respectively, corresponding to N-1, N-2, N-3, N-4, N-5, and N-6. Other parameters were the same as the above standard specimen.
In Figure 13, ξ of all specimens at the ultimate drift ratio are over 15%. At the same drift ratio, when drift ratio is less than 5%, ξ becomes smaller with η up to 0.25 and then rises. When drift ratio is over 5%, ξ increases with η larger than 0.15.
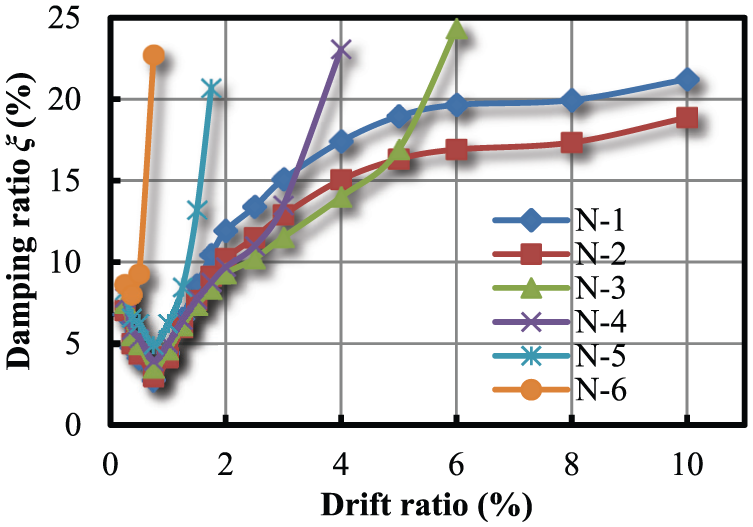
Variation in damping ratio ξ relative to drift ratio for different axial load ratios.
As seen in Figure 14, at the same drift ratio, the residual drift ratio decreases with η up to 0.15 and then gets larger. Among all specimens, the residual drift ratio of N-3 is the largest up to 3% that is over the limit 1% proposed by Japanese Road Association. 30

Variation in residual drift ratio relative to drift ratio for different axial load ratios.
Figure 15 shows that µ declines very rapidly in the form of exponential function with η up. When η is over 0.4, µ is less than 4.0, meaning the pier cannot satisfy general ductility seismic requirement.

Variation in ductility factor relative to axial load ratios.
In conclusion, for HSS–UHPC piers with less transverse reinforcement, η should not be too large so that the piers have good ductility, excellent energy dissipating capacity, and less residual deformation.
Effects of longitudinal reinforcement ratio
L-1, L-2, L-3, L-4, and L-5 were configured by 12 longitudinal reinforcements with different diameters which were 18, 22, 25, 28, and 32 mm, respectively. Other parameters were the same as the above standard specimen.
As seen in Figure 16, ξ obviously rises from 15% to 25% with ρl varying from 1.22% to 3.86%. But residual drift ratio still increases stupendously from 0.5% to 5.7% as seen in Figure 17, meaning that the amplification is over 10 times. Figure 18 shows that µ linearly declines a little. So HSS–UHPC piers should adopt less longitudinal reinforcement which requires good ductility and minor residential deformation. Despite the lower energy dissipating capacity, HSS–UHPC piers are better than that of general concrete members.
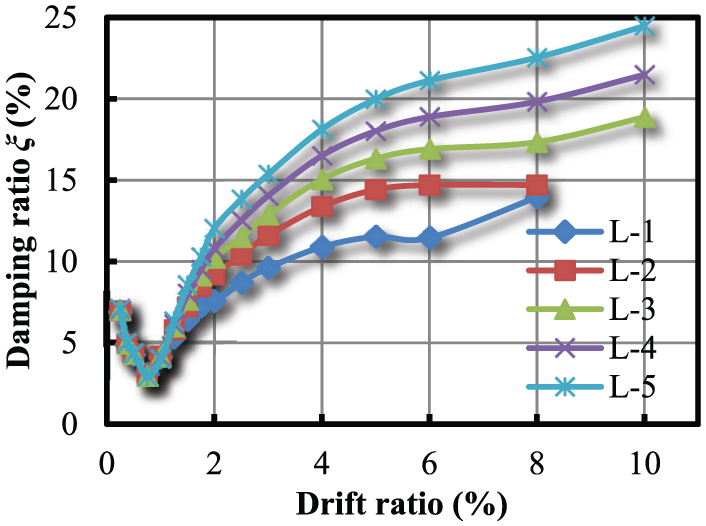
Variation in damping ratio ξ relative to drift ratio for different longitudinal reinforcement ratios.
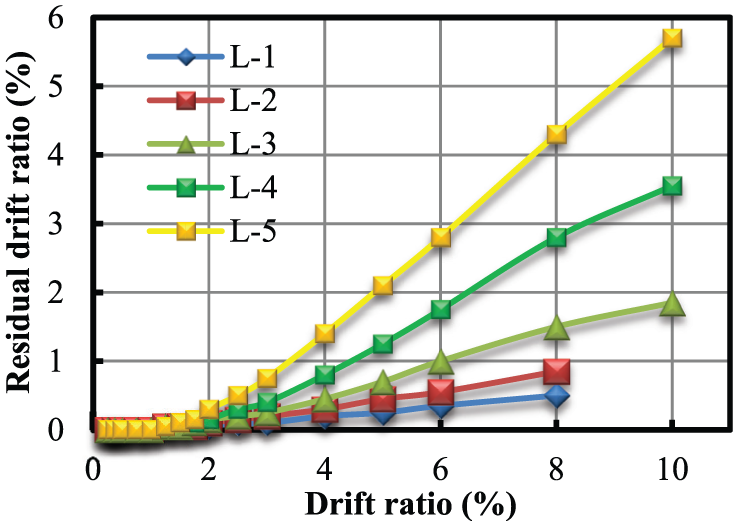
Variation in residual drift ratio relative to drift ratio for different longitudinal reinforcement ratios.
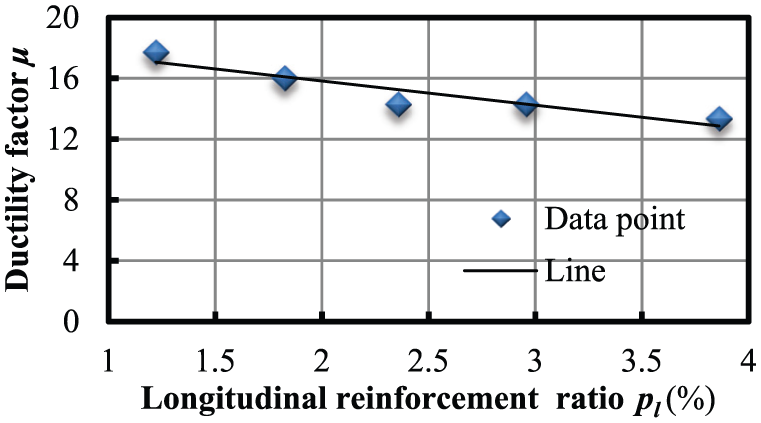
Variation in ductility factor relative to longitudinal reinforcement ratios.
Effects of transverse reinforcement ratio
Five specimens were called T-1, T-2, T-3, T-4, and T-5 of which spaces of transverse reinforcement were 40, 50, 60, 80, and 100 mm, respectively. Other parameters were the same as the above standard specimen.
As can been seen from Figures 19 and 20, ξ and µ are affected less obviously by ρw, but residual drift ratio can be diminished by increasing the amount of transverse reinforcement due to Figure 21.

Variation in damping ratio ξ relative to drift ratio for different transverse reinforcement ratios.

Variation in ductility factor relative to transverse reinforcement ratios.

Variation in residual drift ratio relative to drift ratio for different transverse reinforcement ratios.
Application of FEM to assess the seismic capacity of HSS–UHPC piers due to inelastic response spectra
Inelastic response spectra can be utilized to predict the maximum ground acceleration of a pier based on the results of its pseudo-static test. 31 The method is very convenient, but more researches are required to verify the accuracy of the method. In general, the results of nonlinear dynamic analysis are deemed to be enough precise. So in this section, inelastic response spectra were utilized to calculate the maximum ground acceleration capacity Acal which is verified by the result of nonlinear dynamic analysis AOS based on FEM.
Cyclic performance characters based on tests
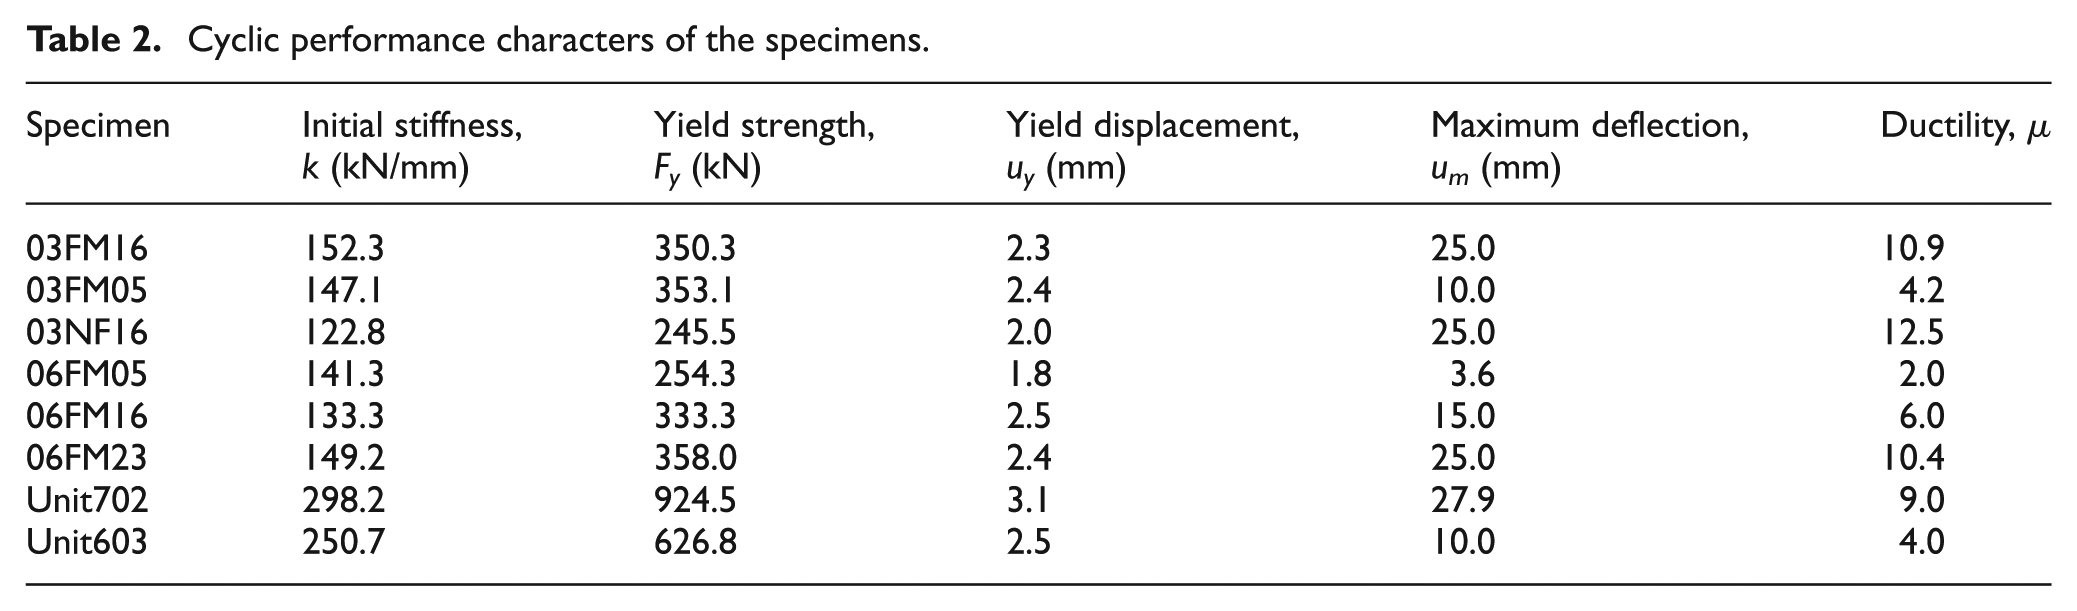
Figure 12 shows how each envelope tested was idealized by a bilinear elastic–perfectly plastic curve with the same initial stiffness (k), maximum deflection (um), and area under the response curve. Using the method, the yield strength (Fy), uy, and µ were calculated for each specimen, 32 of which the details are shown in Table 1, as listed in Table 2.
Cyclic performance characters of the specimens.
From equation (18), ξ of eight specimens are calculated in Figure 22, in which all the maximum damping ratios of specimens exceeded 10%. So HSS–UHPC piers can be deemed to have good energy dissipating capacity.

Variation in damping ratio ξ relative to drift ratio for the specimens.
Prediction of maximum ground acceleration capacity due to inelastic response spectrum
When the results of the pseudo-static tests are known, due to inelastic response spectrum, the maximum ground motion capacity of each HSS–UHPC pier can be estimated by the following procedure:
From researches given by Newmark and Hall,
33
the peak ground acceleration (PGA)
Idealized elastoplastic system for load–deflection curves of UHPC piers is established to determinate k, Fy, and µ.
Each pier is equal to be a single-degree-of freedom (SDOF) system with a lumped mass m which is focused on the top and the results from the simulated dead load applied as axial compressive force during the cyclic tests.
Based on the hysteretic response of each pier, ξ is calculated by equation (18) as shown in Figure 11.
The natural period Tn of each pier is evaluated according to k and m of the equal SDOF system.
The amplification factors αA, αV, and αD are computed as follows


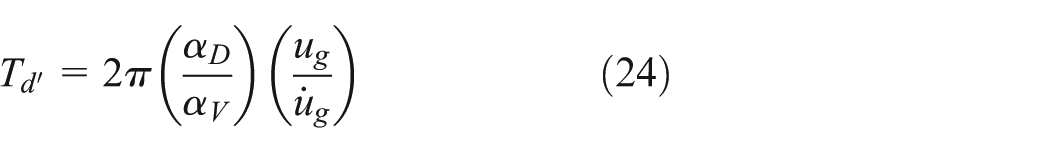
7. The period values of Ta′ = 1/33 s, Tb′ = 1/3 s, Te′ = 10 s, and Tf′ = 33 s are known, whereas Tc′ and Td′ can be calculated as follows

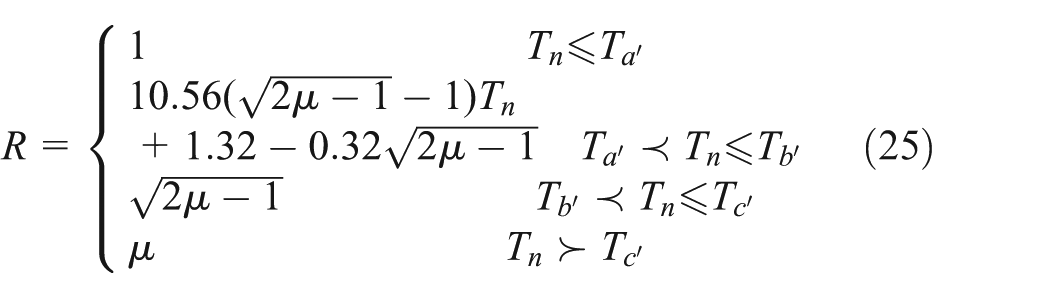
8. The strength reduction factor Ry is calculated as follows
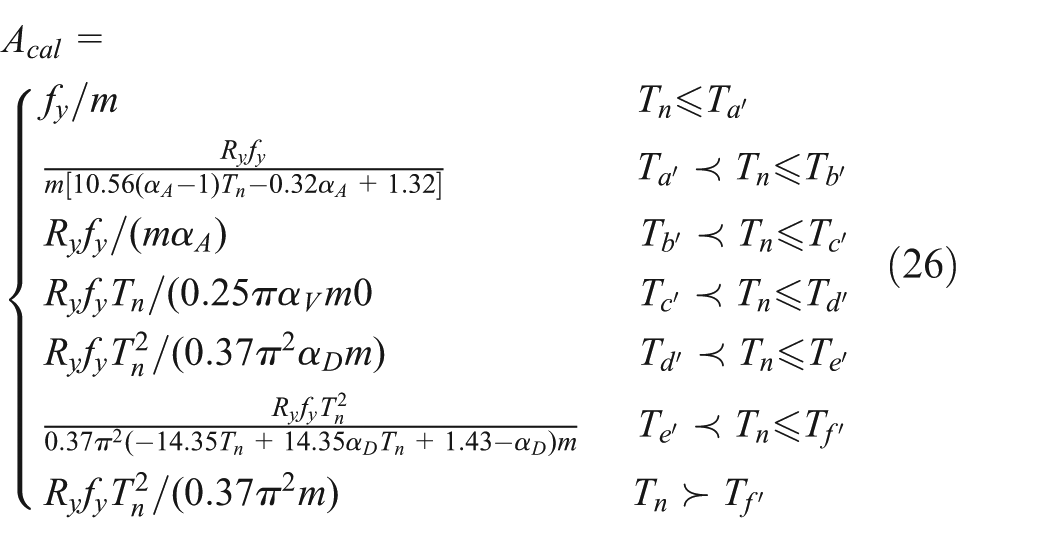
9. From Ryfy = Acalm, 32 Acal of HSS–UHPC pier can be predicted as follows
In the following calculation, ξ is assumed to be 5% conservatively. Table 3 lists Acal of each pier.
Estimation of the maximum ground acceleration capacity due to inelastic response spectrum.

Prediction of maximum ground acceleration capacity due to nonlinear dynamic analysis
Three groups of ground motions including far-field ground motions, near-fault ground motions with fling step, and near-fault ground motions with forward directivity were selected to excite each piers in Table 4. PGA of each ground motion was adjusted to 1.0 at first, and FEM of each HSS–UHPC pier was subjected to a series of excitations with gradually increasing amplitudes starting from 0.05Acal by an increment of 0.05Acal until failure of the pier. For example, 03FM16 could sustain the EL-Centro ground motion up to 0.80Acal (PGA = 0.190g), but failed in 0.85Acal. So AOS was deemed to be 0.190g. Other results are listed in Table 4.
Estimation of the maximum ground acceleration capacity due to nonlinear dynamic analysis.

Acal and AOS obtained are compared in Figures 23 and 24. As seen in Figure 23, AOS/Acal can be regarded to be equal to 1 on the whole. But Acal becomes a little larger than AOS with Acal up in Figure 24, meaning the results of inelastic response spectra are not always conservative for short HSS–UHPC pier under heavy axial load.

Histogram of ratios of maximum ground acceleration capacities resulting from two methods’ capacities resulting from two methods.

Comparison of maximum ground acceleration capacities resulting from two methods.
Moreover, for all specimens, maximum ground acceleration capacities excited by near-fault ground motions with forward directivity are less than those excited by other two types of ground motion; in other words, near-fault ground motions with forward directivity are more subversive for HSS–UHPC piers which have small shear length and are subjected to large axial load. This is probably because near-fault ground motions with forward directivity contain rich high-frequency components.
Conclusion
This article utilized FEM based on OpenSees platform to research seismic performance of HSS–UHPC piers. The following conclusions can be drawn:
Two stress–strain models were proposed to reflect well uniaxial compressive relations of UHPC and HSS-confined UHPC based on modified Kent–Park model, compared with trial data.
An FEM of HSS–UHPC pier using fiber elements was established based on OpenSees platform, which can provide the hysteretic response consistent with experimental data.
For HSS–UHPC piers with medium amount of transverse reinforcement, the increase in axial load ratio can weaken ductility seriously. To keep good seismic ductility, axial load ratio was suggested to be less than 0.4, based on the results of parameter analysis.
Due to parameter analysis of FEM, with medium amount of transverse reinforcement, a HSS–UHPC pier under minor axial load ratio was suggested to use less longitudinal reinforcement than 2% for less residual drift ratio than 1%.
Subjected to smaller axial ratio, the increase in transverse reinforcement has no effect on ductility and energy dissipation of HSS–UHPC pier basically, but can reduce residual drift ratio obviously, according to the results of parameter analysis.
Compared with the results calculated by nonlinear dynamic time history analysis of FEM, maximum ground acceleration capacity of short HSS–UHPC pier subjected to heavy axial load was a little insecure due to inelastic response spectra.
Footnotes
Appendix 1
Acknowledgements
The authors would like to thank their research group members for their help to finish this article. Meantime, the authors appreciate the University of California for developing the free OpenSees platform.
Academic Editor: Magd Abdel Wahab
Declaration of conflicting interests
The author(s) declared no potential conflicts of interest with respect to the research, authorship, and/or publication of this article.
Funding
The author(s) disclosed receipt of the following financial support for the research, authorship, and/or publication of this article: The work described in this article was financially supported by the National Natural Science Foundation of China (Grant Nos 51378110 and 51438003), Six Talent Peaks Project in Jiangsu Province (Grant No. JZ-007), and a Project Funded by the Priority Academic Program Development of Jiangsu Higher Education Institutions (Grant No. CE02-1-4).