
Abstract
With the rapid changes in manufacturing technology of bicycle, the safety and performance of a bicycle are important and remarkable research subjects. In this study, an innovative and integrated optimization procedure for multi-objective optimization of an on-road bicycle frame is presented. The multiple objectives are to reduce the bicycle frame’s permanent deformations and to decrease the bicycle frame’s mass. First, uniform design of experiments is applied to create a set of sampling points in the design space of control factors. Second, three-dimensional solid models of bicycle frames are constructed and permanent deformations of bicycle frames under dropping-mass and dropping-frame impact test simulations are measured by ANSYS and ANSYS/LS-DYNA. Third, Kriging interpolation is used to transform the discrete relations between input control factors and output measures to continuous surrogate models. Fourth, compromise programming and mixture uniform design of experiments are used to integrate the multiple-objective functions into one compromise objective function. Finally, generalized reduced gradient algorithm is employed to solve the optimization problem. After executing the innovative optimization procedure, an optimized on-road bicycle frame is obtained. Comparing with the original design, the frame’s permanent deformations and mass are reduced. Therefore, both consolidation and lightweight of on-road bicycle frame are achieved.
Keywords
Introduction
In both 20th and 21st centuries, biking has become a fresh relaxation activity. Many advantage designs about the bicycle frame system are investigated to upgrade both ride safety and performance. However, in order to decrease production cost, many testing procedures for a bicycle safety are ignored. For that reason, it is very important and helpful for the bicycle manufacturing companies to develop the valuable analysis procedures for some safety tests.
Several studies have investigated the dynamics and stability analysis of bicycle model.1–3 Jones 1 presented the dynamic stability analysis for various types of bicycle such as normal bicycle, URB III type of bicycle in which the front fork has a negative front projection, and URB IV type of bicycle in which the front fork has an extended front projection. Nakagawa et al. 2 studied the stabilization of the bicycle using driving forces and designed a controller using linear-quadratic control theory. Schwab et al. 3 introduced the dynamics of the bicycle model which consists of four rigid bodies. The linearized equations of motion of the 3 degrees of freedom bicycle model, considering the roll angle of the rear frame, the steering angle, and the rotation angle of rear wheel with respect to the rear frame, are derived, and the dynamic stability analysis of the bicycle model is also investigated.
Some topics focused on the finite element analysis and the simulation for a bicycle frame model had been presented in the literatures.4–6 The deformations and stresses of a bicycle model have also been studied by the more complete bicycle frame model.7–11 Using two monologue frame designs and tubular metal frames, Larry et al. 7 investigated and compared the stiffness of in-plane and out-of-plane frames by both the experiments and finite element analysis. Alex and Thomas 8 introduced bicycle stress level as a tool for providing the full range of criteria needed to determine the bicycle compatibility of roadways. According to fracture mechanics, and using an estimate of the bending stress from a 1-m drop, Shelton et al. 9 presented an analysis of a mountain bike front shock failure. Redfield 10 developed baseline predictions for the performance of mountain bikes during extreme maneuvers using the bond graph model. The static analysis results by ANSYS Workbench software for a sport bicycle are investigated by Wang et al. 11 By means of the genetic algorithm, Huang and Wang 12 studied the optimal designs of the two-dimensional model of the bicycle frame under the lightest weight considerations.
Although the optimization designs for the bicycle frame have been illustrated from Huang and Wang, 12 the optimal design for the three-dimensional (3D) models of the bicycle frame has never been investigated. In addition, the drop-frame impact testing simulation about the on-road bicycle frame is never presented by the explicit dynamics finite element method. The optimization design for testing a bicycle frame model by uniform design and Kriging interpolation has never been presented.
In this study, an innovative and integrated optimization procedure is presented to reduce the weight of bicycle frame as well as the permanent deformations of frame. The procedure has five steps. First, a set of experiments are created in the design space based on the uniform design method. Second, explicit dynamic finite element analysis packages, ANSYS and ANSYS/LS-DYNA, are applied to analyze permanent deformations of the bicycle frames in all experiments under two dropping impact test simulations. Masses of bicycle frames in all experiments are measured by SolidWorks system. Third, Kriging interpolation method is used to create surrogate models of permanent deformations and mass. Fourth, compromise programming and mixture uniform design of experiments are applied to integrate multiple-objective functions into one compromise objective function. Fifth, generalized reduced gradient (GRG) algorithm is employed to optimize the dimensions of bicycle frame. From the results shown in this article, the innovative and integrated optimization procedure is very useful for simultaneously reducing the permanent deformations and the mass of on-road bicycle frame.
Dynamic finite element analysis
Components of bicycle frame model and two dropping impact tests
The on-road bicycle frame system, including the head tube, top tube, down tube, seat tube, seat stays, chain stays, and front fork, is given as shown in Figure 1. Some basic dimensions of the bicycle frame model are given in Figure 2. Considering the riding safety of a bicycle, the qualified bicycle frames have to pass the drop-mass and drop-frame impact tests under EN 14781 bicycle testing standard. 13 The drop-mass impact test method is shown in Figure 3. A solid-steel bar fitted in place of a fork is assembled into the head tube. A striker is put vertically above the solid-steel bar with the distance of 212 mm. This heavy striker freely falls downhill and then impacts the solid-steel bar. The permanent deformation of the fork along the longitudinal direction of the frame can be measured and obtained as the striker comes to rest on the solid-steel bar.

Structures of bicycle frame.

Basic dimensions of on-road bicycle frame model.

Schematic diagram of drop-mass impact test of bicycle frame model. 13
Figure 4 shows schematically the drop-frame impact test. A mass of 70 kg is placed and fixed on the top of seat tube. Then, the bicycle frame system and mass are placed vertically above the rear axle. Next, the bicycle frame system is rotated about the rear axle, freely dropping downhill and impacts the steel anvil. Finally, the permanent deformation along the longitudinal direction of the frame can be measured and obtained as the front fork comes to rest on the steel anvil.

Schematic diagram of drop-frame impact test of bicycle frame model. 13
In this study, the solid-steel bar is selected to fit instead of a fork. On the basis of the EN 14781 bicycle testing standard, 13 it is necessary for an eligible and safety bicycle frame to decrease a permanent deformation lesser than 15 mm under the drop-mass and drop-frame impact tests.
Explicit dynamics finite element analysis for the dropping impact test simulation
Because of the short time impact behavior between the striker and the roller, or bicycle frame and steel anvil, the explicit dynamic finite element software can be applied to simulate the drop-mass and drop-frame impact test simulations. First, in the preprocessing, suitable element size, material properties, and contact surface settings are finished using ANSYS software. The material of the bicycle frame for each tube is set to be aluminum alloy T6066 while the materials of the front fork, striker, the mass, and the steel anvil are set to be stainless steel.
For the drop-mass impact test simulation, the striker and the bicycle frame are meshed with qualified finite elements as shown in Figure 5(a). To reduce unnecessary waste of simulation time, the striker is placed in front of the end of front fork with an initial speed. According to the kinematics formula,

Finite element models of bicycle frame and striker and setting of boundary conditions for (a) drop-mass impact test and (b) drop-frame impact test.
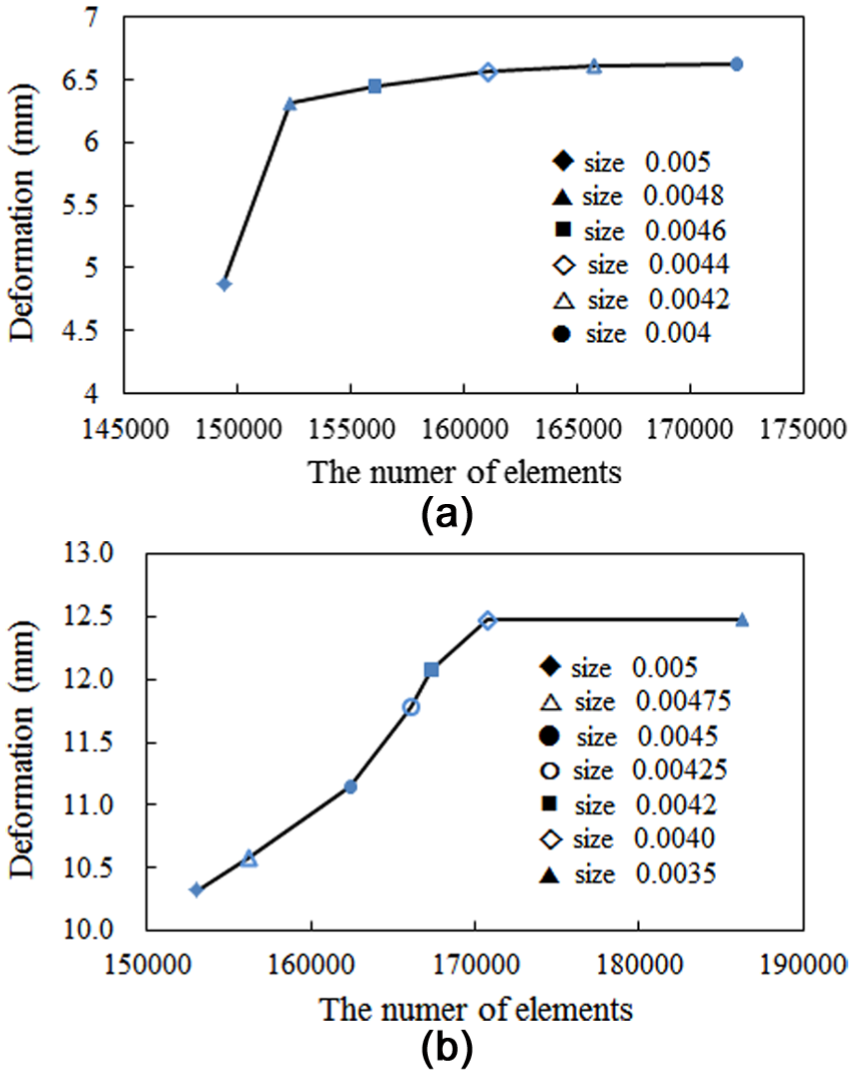
Mesh convergence analysis of deformation with various element sizes for (a) drop-mass impact test and (b) drop-frame impact test simulations.

Distribution of deformation of bicycle frame along the longitudinal direction of frame for (a) drop-mass and (b) drop-frame impact test simulations.
For the drop-frame impact test simulation, the bicycle frame, mass, and the steel anvil are meshed with qualified finite elements as shown in Figure 5(b). The boundary conditions at the rear dropouts are set to be free to rotate about the rear axle in a vertical plane. The final permanent deformation is found by taking the maximum value of deformations from 0.0 to 1.0 s. Besides that, the mesh convergence analysis for the permanent deformation is also given as shown in Figure 6(b). Because of the convergence of permanent deformation with the smaller element size of 0.004 mm, the qualified and suitable element size can be set and located to be 0.004 mm. Therefore, the distribution of permanent deformation along the longitudinal direction is presented and given as shown in Figure 7(b) by ANSYS/LS-DYNA software. The maximum permanent deformation of the bicycle frame is 12.47 mm.
Factor analysis for two drop impact tests
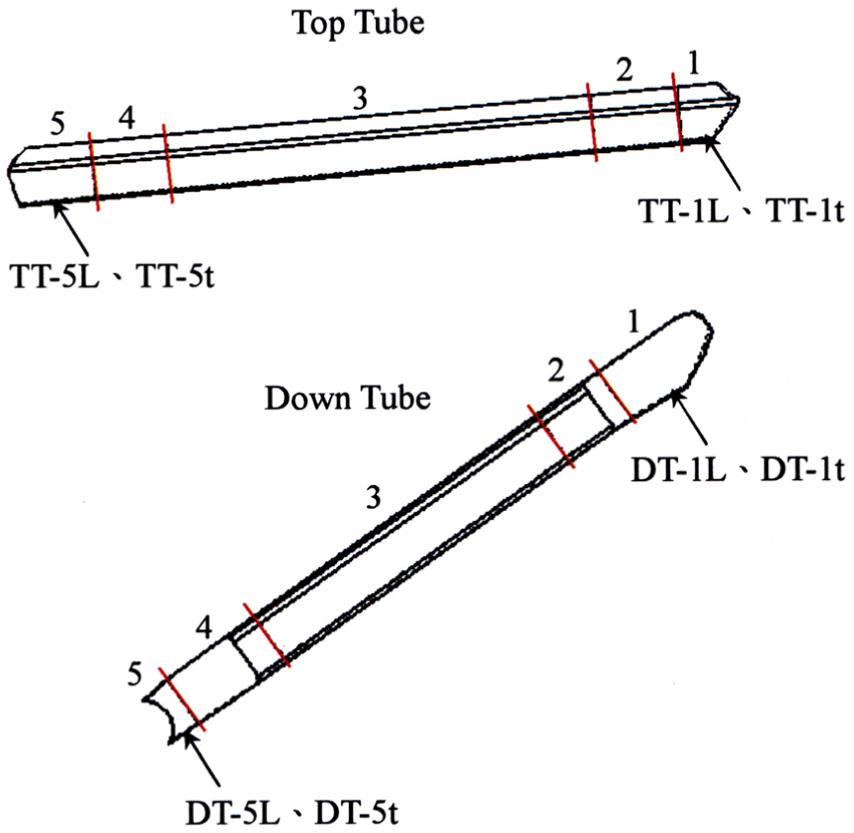
Prior to optimization, factor characteristic analysis can present the effects of control factors on the objective function, permanent deformation of the front fork. Before the factor characteristic analysis, eight design parameters of the bicycle model are assumed. The design parameters, including the length of the first section of top tube (TT-1L), thickness of the first section of top tube (TT-1t), length of the fifth section of top tube (TT-5L), thickness of the fifth section of top tube (TT-5t), length of the first section of down tube (DT-1L), thickness of the first section of down tube (DT-1t), length of the fifth section of down tube (DT-5L), and thickness of the fifth section of down tube (DT-5t), are presented as shown in Figure 8.
Control factors of design of experiments.
Figure 9 shows the effects of the length (TT-1L) and thickness (TT-1t) of the first section of top tube on deformations of the front fork for the drop-mass and drop-frame impact tests. The deformations of front fork evaluated via the drop-mass impact test are always higher than those obtained from the drop-frame impact test. In Figure 9(a), for drop-mass impact test simulation, the deformation of the front fork increases with increasing the length of the first section of top tube. In Figure 9(b), the deformation of the front fork under the drop-frame impact test slightly increases as the thickness of the first section of top tube increases. However, for the drop-frame impact test, the deformation of the front fork tardily increases with increasing the thickness of the first section of top tube.
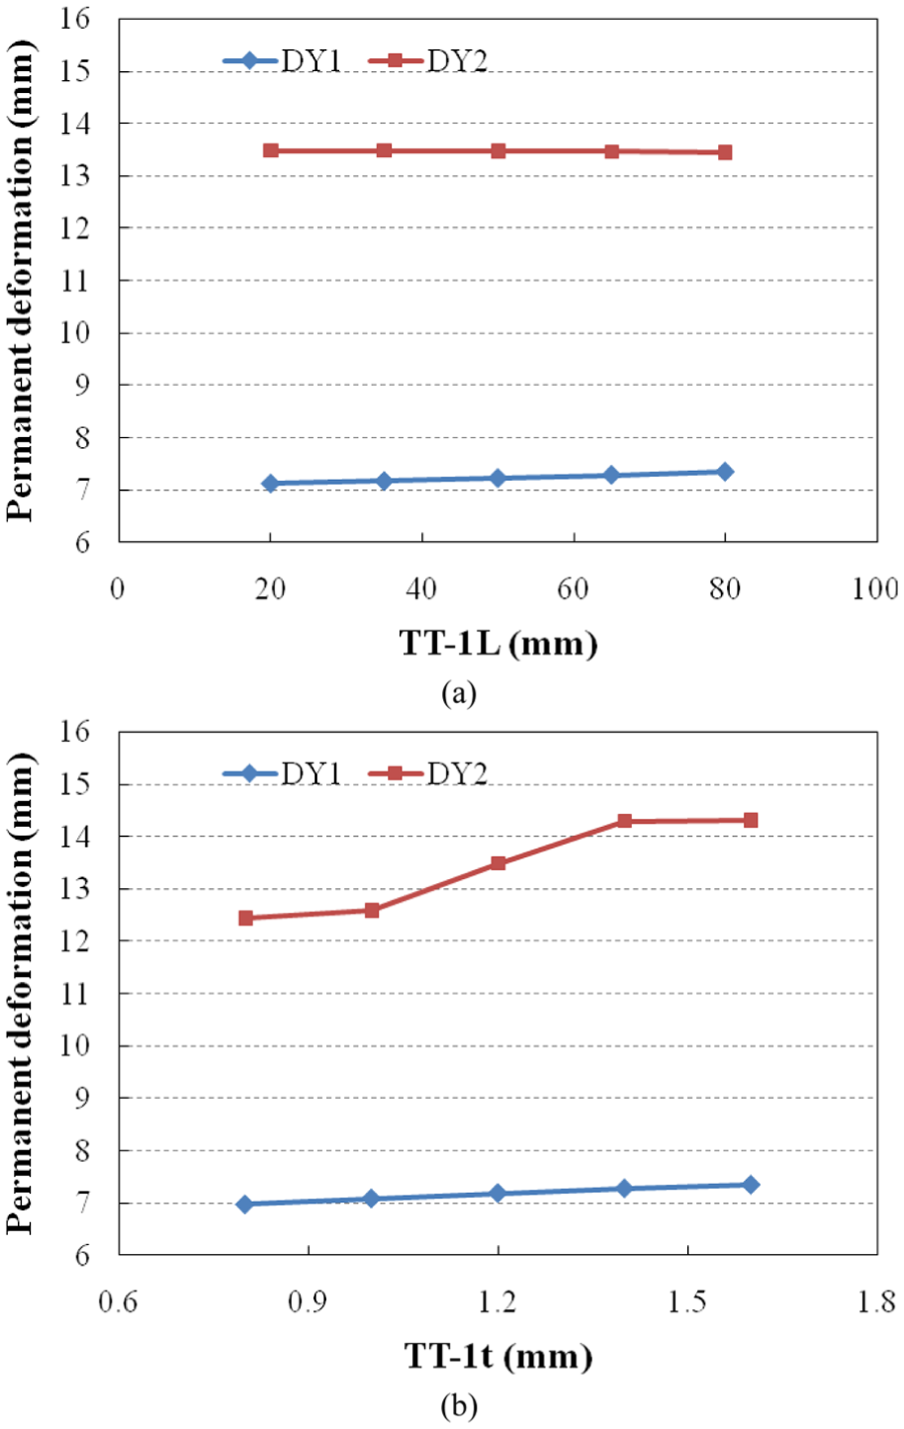
Effects of (a) length and (b) thickness of first section of top tube on deformation of front fork for drop-mass and drop-frame impact tests.
Figure 10 shows the effects of the length (TT-5L) and thickness (TT-5t) of the fifth section of top tube on the deformation of the front fork for the drop-mass and drop-frame impact tests. As can be seen, the deformation of the front fork evaluated using the drop-mass impact test always exceeds those obtained from the drop-frame impact test simulation. In Figure 10(a), the deformation of the front fork under the drop-mass impact test simulation increases as TT-5L increases. For the drop-frame impact test simulation, the deformations of the front fork increase first and then decrease as TT-5t increases in Figure 10(b). However, the deformations of the front fork under the drop-mass impact test decrease with increasing the thickness of the fifth section of top tube.

Effects of (a) length and (b) thickness of fifth section of top tube on deformation of front fork for drop-mass and drop-frame impact tests.
Figure 11 shows the effects of the length (DT-1L) and thickness (DT-1t) of the first section of down tube on deformation of the front fork for the drop-mass and drop-frame impact tests. In Figure 11(a) and (b), the deformations of front fork under two drop impact tests decrease as the length and thickness of the first section of down tube increase. Furthermore, in Figure 11(b), the effect of the thickness of the first section of down tube on the deformations of front fork under the two impact test is very significant. The deformations of front fork under the drop-frame impact test obviously decrease as the thickness of the first section of down tube increases.

Effects of (a) length and (b) thickness of first section of down tube on deformation of front fork for drop-mass and drop-frame impact tests.
Figure 12 shows the effects of the length (DT-5L) and thickness (DT-5t) of the fifth section of down tube on deformation of the front fork for the drop-mass and drop-frame impact tests. In Figure 12(a), the deformations of the front fork under the drop-mass impact test increase as DT-5L increases. However, for the drop-frame impact test, the deformations of the front fork decrease with increasing the length of the fifth section of down tube. Therefore, the effects of the length of the fifth section of down tube on the deformations of front fork under two drop impact tests are very obvious. From Figure 12(b), the effect of the thickness of the fifth section of down tube on the deformations of the front fork under two drop impact tests seems not significant.

Effects of (a) length and (b) thickness of fifth section of down tube on deformation of front fork for drop-mass and drop-frame impact tests.
According to the discussions in the above, the permanent deformations of the front fork effectively decrease as the thickness of the fifth section of the top tube and the length and thickness of the first section of the down tube increase. However, it makes the mass of the bicycle frame increased. Therefore, the small permanent deformations and lightly bicycle frame are investigated by the integrated optimization procedure in the next section.
Improvement of permanent deformation and lightweight design
Uniform design of experiments
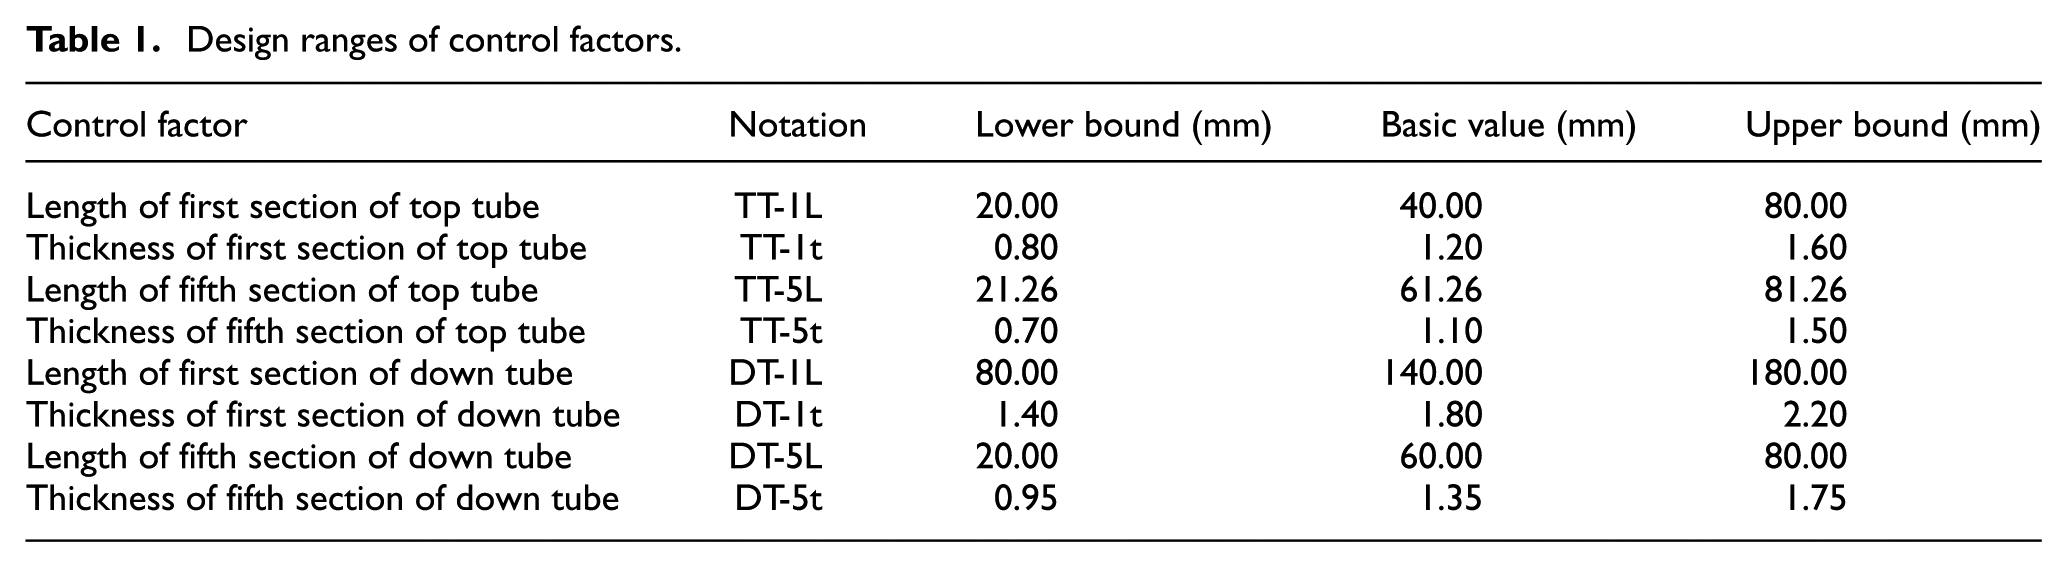
In Figure 8, eight-dimensional control factors are considered as follows: length of first section of top tube (TT-1L), thickness of first section of top tube (TT-1t), length of fifth section of top tube (TT-5L), thickness of fifth section of top tube (TT-5t), length of first section of down tube (DT-1L), thickness of first section of down tube (DT-1t), length of fifth section of down tube (DT-5L), and thickness of fifth section of down tube (DT-5t). The design ranges of the eight control factors are given as shown in Table 1. Because of the continuality of all factors, the design space is also a continuous space. Consequently, in this study, uniform design of experiments, advised by Fang and Wang, 14 is applied to create a set of experimental points uniformly in the design space.
Design ranges of control factors.
Uniform design has been widely used in the optimization processes for many engineering applications.15–20 In this study, each control factor is given 18 levels in its design range and the uniform table
Uniform table

Constructed uniform experiments.

Results of the uniform experiments.

In drop-mass impact test simulation, the permanent deformation of the original designed bicycle frame is 6.61 mm. In drop-frame impact test simulation, the permanent deformation of the original designed bicycle frame is 12.47 mm. The mass of the original designed bicycle frame is 1146.49 g. By examining the improved rates in all experiments, only experiments 2, 8, and 16 have all positive improved rates. Moreover, the 16th experiment has the most improved rates. Therefore, the 3D model of the on-road bicycle frame in the 16th experiment can be regarded as the improved version of original design. After completing the uniform experiments, the permanent deformation in drop-mass impact test has an improved rate of 4.39%, the permanent deformation in drop-frame impact test has an improved rate of 4.65%, and the mass of bicycle frame has an improved rate of 1.58%. As the main objective of the design is to reduce the weight, the improved rate of mass should be increased further.
Kriging interpolation surrogate modeling method
A surrogate model is an engineering method employed as an outcome of interest cannot be easily and directly measured. It is created by some statistic methods, such as regression method, artificial neural networks, or Kriging interpolation. Compared with neural network method, Kriging interpolation does not involve training time, but the neural network model needs training time to determine weights between neurons. Moreover, Kriging interpolation has been applied to study the optimization problems in engineering.21–25 Therefore, in this study, Kriging interpolation is applied to create a continuous surrogate model from the discrete experimental points. Kriging surrogate models combine a global model and localized departures, given as 24

where
Considering a zero-order regression and Gaussian correlation function in the Kriging surrogate model, the surrogate model


where


According to the numerical relations between control factors and permanent deformations, Kriging surrogate model representing permanent deformations can be constructed using the MATLAB toolbox, DACE software.
21
The Kriging model applied herein is ordinary Kriging and the correlation function applied herein is Gaussian function. In equations (1)–(6),
Optimization of control factors
With the input data shown in Table 3, the output data shown in Table 4, and Kriging surrogate modeling method, the surrogate models of permanent deformations and mass can be obtained. These surrogate models are regarded as the objective functions. The objective function of mass of bicycle frame is denoted by

where
The coefficients
Coefficients of Kriging surrogate models for various objective functions.

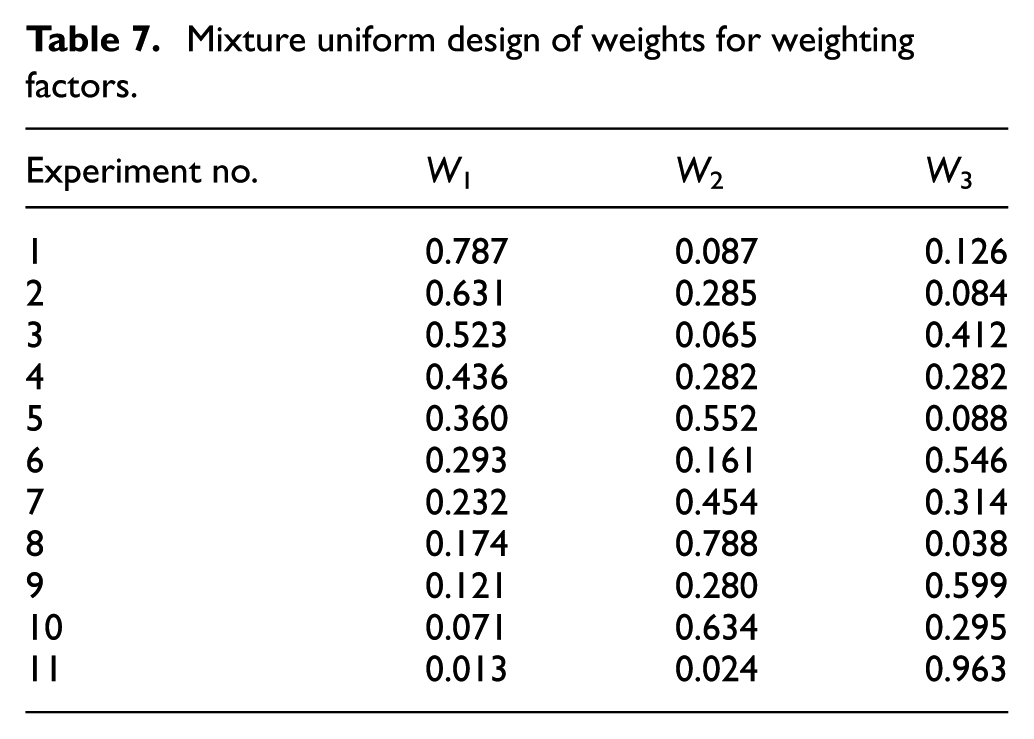
As the bicycle frame possesses three single optimization problems, multi-objective optimization method should be applied. Here, compromise programming method is used to transform three objective functions into one compromise objective function. The combinations of weights of objective functions are generated by mixture uniform design of experiments. Each experiment denotes a combination of weights of objective functions. By utilizing GRG algorithm to optimize the compromise objective function in each experiment, the improved rates of permanent deformations and mass of bicycle frame are determined. The procedure for multi-objective optimization is presented as follows.
Solve single-objective optimization problem
When applying compromise programming method, it is necessary to solve single-objective problems before solving multi-objective problem. In this study, GRG algorithm
26
is applied to solve the optimal values and solutions. GRG algorithm has been wieldy used in the engineering optimization problems.27–30 As shown in Table 6,
Corresponding values of objective functions.

Integrate multiple-objective functions into a compromise objective function
Compromise programming method31–34 is a useful and powerful tool to integrate multiple-objective functions into a compromise objective function. According to compromise programming method, the compromise objective function
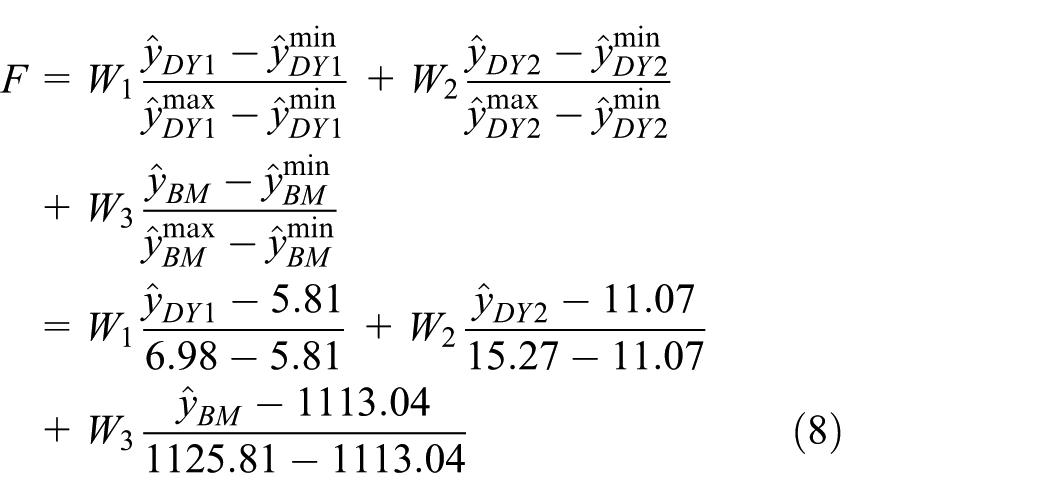
Here,
Mixture uniform design of weights for weighting factors.
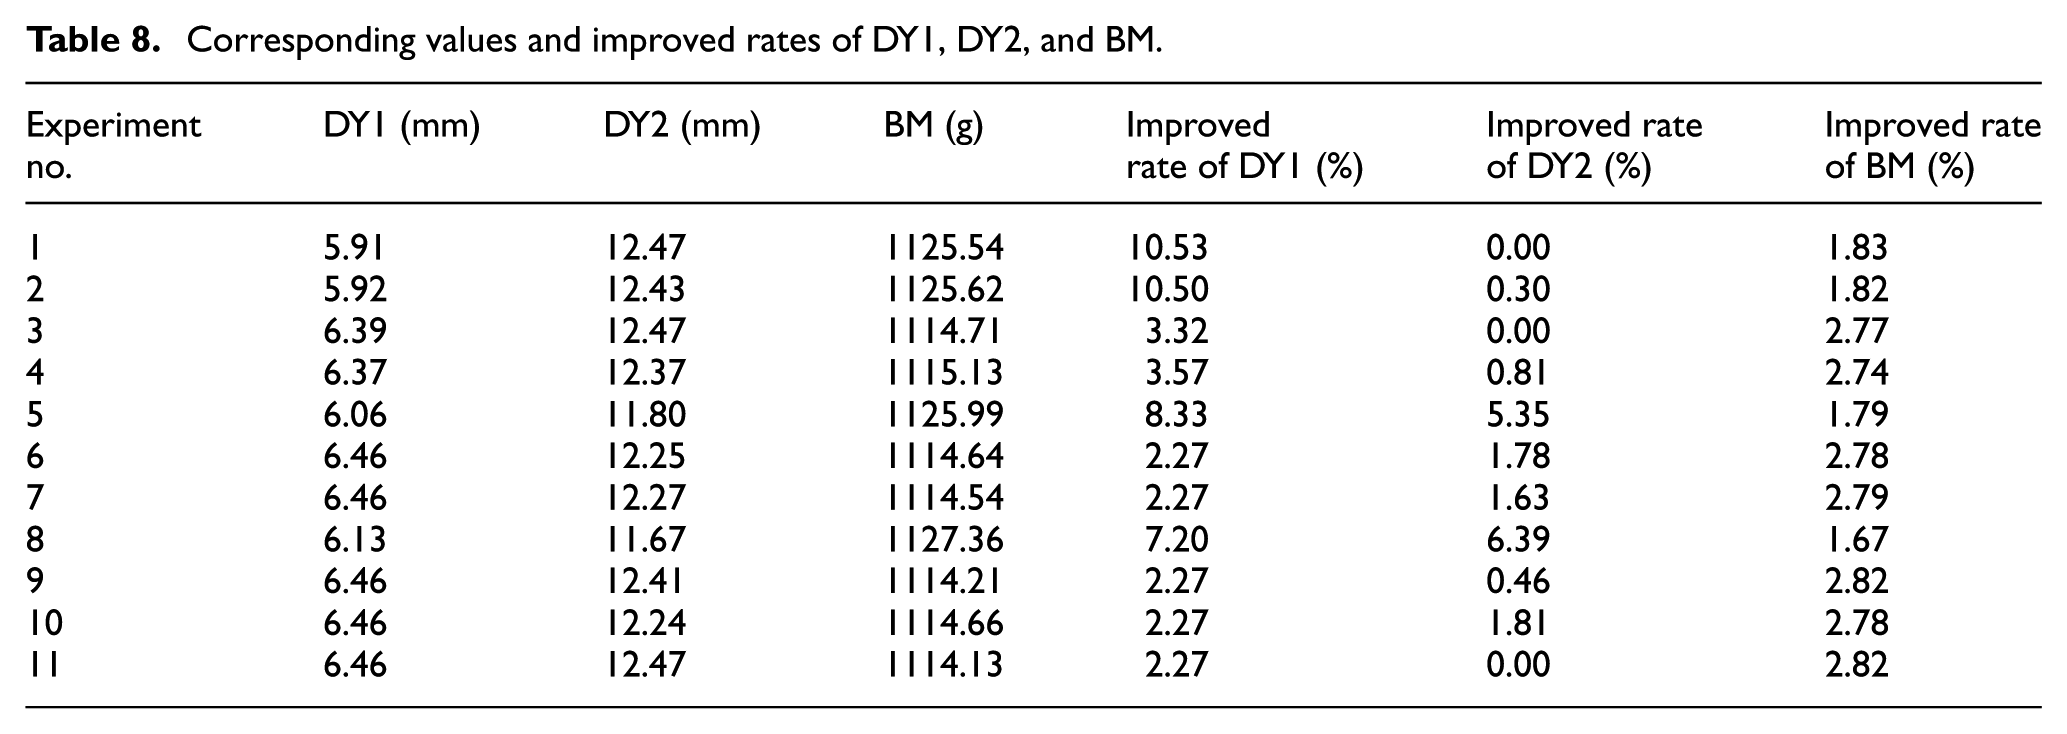
Corresponding values and improved rates of DY1, DY2, and BM.
Select an appropriate combination of weights for weighting factors
Since it is impossible to test all possible combinations of weights for weighting factors due to the limitation of time, the concession strategy applied here is to select an appropriate combination of weights from Table 7. The original designed bicycle frame has a DY1 of 6.61 mm, a DY2 of 12.47 mm, and a BM of 1146.49 g. The improved rates of DY1, DY2, and BM are determined and given as shown in Table 8. Experiments 1, 3, and 11 are deleted since the improved rate of DY2 is zero. Experiments 2, 5, and 8 are also deleted since the improved rate of BM is less than 2%. From experiments 4, 6, 7, 9, and 10, we select the combination of weights in the fourth experiment since the improved rate of DY1 is required to be higher than that of DY2 by the bicycle frame manufacturing company. After selecting the appropriate combination of weights for weight factors

Check prediction errors between surrogate models and analysis models
By solving the optimization problem in equation (9) with GRG algorithm, the optimal solutions of control factors are obtained as solution 1 shown in Table 9. Since the optimal solutions of control factors are determined by surrogate models rather than analysis models, the prediction errors of DY1, DY2, and BM at the optimal solutions of control factors must be checked. Here, the value predicted by surrogate model is called the predicted value and the value analyzed by analysis model is called the analyzed value. The bicycle frame whose control factors use the optimal solutions of control factors is called the optimized bicycle frame. To obtain the analyzed values of DY1, DY2, and BM, the analysis procedure is executed one more time. The 3D model of the optimized bicycle frame is created in SolidWorks. The mass of the optimized bicycle frame is measured using SolidWorks. The permanent deformations of the optimized bicycle frame are analyzed by ANSYS/LS-DYNA. At optimal solution 1, the predicted and analyzed values of DY1, DY2, and BM are shown in Table 10. The predicted error of DY1 is high up to 3.78%. The predicted error of DY2 is high up to 4.92%. Because the predicted errors of DY1 and DY2 are higher than 2%, the surrogate models must be updated. The optimal solutions of control factors are added into the 18 experimental points shown in Table 3; the corresponding analyzed values of DY1, DY2, and BM are added into Table 4, and the surrogate models of DY1, DY2, and BM are updated. The updated surrogate models of DY1, DY2, and BM are represented by

Optimal solutions for control factors.

Comparison of predicted and analyzed values of measures.
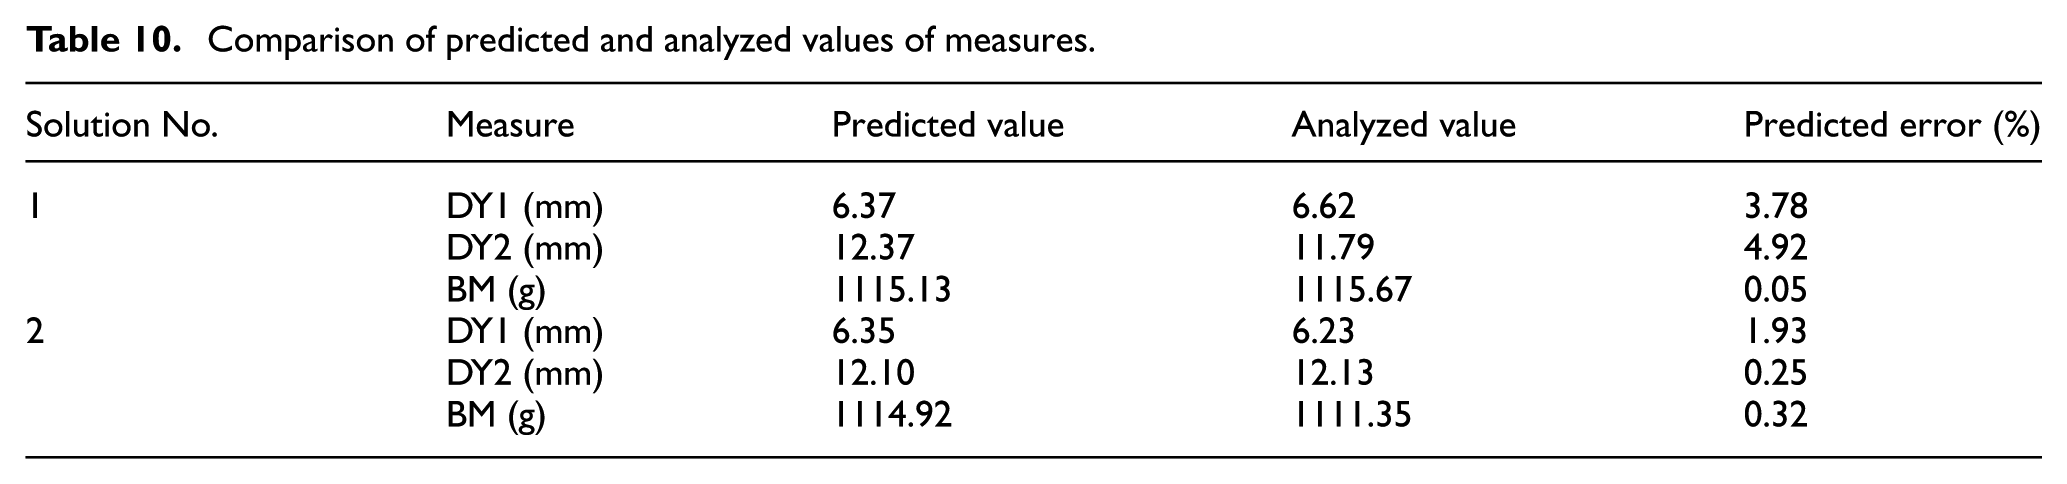
The optimization problem in equation (10) is also solved by GRG algorithm. The final optimal solution for the control factors for this optimization problem in equation (10) are as the solution 2 shown in Table 9. To obtain the analyzed values of DY1, DY2, and BM for this optimized bicycle frame, the analysis procedure is executed one more time. The 3D model of the optimized bicycle frame is created in SolidWorks. The mass of the optimized bicycle frame is measured using SolidWorks. The permanent deformations of the optimized bicycle frame are analyzed by ANSYS/LS-DYNA. At optimal solution 2, the predicted and analyzed values of DY1, DY2, and BM are also shown in Table 10. The predicted errors of DY1, DY2, and BM are 1.93%, 0.25%, and 0.32%, respectively. Since all the predicted errors are smaller than 2%, the optimization procedure is completed.
Table 11 shows the values and the improved rates of permanent deformations and mass under various phases. In the original design phase, the permanent deformation DY1 is 6.61 mm, the permanent deformation DY2 is 12.47 mm, and the mass BM is 1146.49 g. In the phase after executing uniform experiments, the permanent deformation DY1 is reduced to 6.32 mm, the permanent deformation DY2 is reduced to 11.89 mm, and the mass BM is reduced to 1128.33 g. In the phase after executing multi-objective optimization, the permanent deformation DY1 is reduced further to 6.23 mm. The permanent deformation DY2 is slightly increased to 12.13 mm. The mass BM is reduced to 1111.35 g. The improved rate of mass BM can be increased up to 3.07%. From the point view of lightweight, the design of bicycle frame after multi-objective optimization is superior to the design of bicycle frame after uniform experiments.
Values and improved rates of measures in various phases.

Conclusion
The explicit dynamics finite element simulation analysis of the on-road bicycle frame model subjected to drop-mass and drop-frame impact tests is presented in this study. The factor characteristic analysis is performed for the bicycle frame model of basic dimensions. The analysis result shows that the permanent deformations of the on-road bicycle frame model under the drop-frame impact test simulation are always smaller than those under the drop-mass impact test simulation. In the optimization strategy, the uniform design of experiments and Kriging interpolation are used to create the experimental data and three surrogate models, including the mass and permanent deformations of the on-road bicycle frame model, respectively. Minimizing the mass and permanent deformation of bicycle frame is achieved using mixture uniform design of experiment, compromise programming method, and GRG algorithm. After applying the innovative optimization procedure presented in this article, the total improved rates of the permanent deformations are 5.75% and 2.73% for the drop-mass and drop-frame impact test simulations, respectively. Furthermore, the improved rate of the mass of bicycle frame model is 3.07%. Therefore, the lightweight design of the bicycle frame is attended. This article has shown that the integration of uniform design of experiments, Kriging interpolation, compromise programming, mixture uniform design of experiments, and GRG algorithm is an innovative and useful optimization strategy for solving multi-objective optimization problems.
Footnotes
Appendix 1
Academic Editor: Filippo Berto
Declaration of conflicting interests
The author(s) declared no potential conflicts of interest with respect to the research, authorship, and/or publication of this article.
Funding
The author(s) disclosed receipt of the following financial support for the research, authorship, and/or publication of this article: The authors gratefully acknowledge the financial support provided to this study by the Ministry of Science and Technology of Taiwan under grant numbers 103-2221-E-327-018 and 104-2622-E-327-019.