
Abstract
In this article, a typical submersible well pump was investigated to study the effects of inter-stage leakage on the inner flow field and external characteristics. The whole flow field of the model pump with different seal clearances was simulated by computational fluid dynamics software. The inter-stage clearance leakage calculated by numerical simulation was compared with the values obtained by the empirical formula. The pressure values were recorded with the arrangement of monitor points in the inter-stage clearance, inlet region, and outlet region, which aimed to study the effects of the change of inter-stage clearance pressure on the pump performance. Meanwhile, a comparative analysis of numerical simulation and performance test of the pump was conducted further. The results showed that the leakage at the small clearance is close to the value calculated using empirical formula. But when the clearance is large, the discrepancy between the simulation result and empirical value inclines. Comparing the numerical results of three kinds of clearance leakage, we found that the clearance leakage could not be ignored in the simulation since it has a large effect on the prediction of pump efficiency and head.
Introduction
Submersible well pump is the main equipment to extract groundwater, and it has been widely used in various fields of industry and agriculture. The clearance of the seal ring of the submersible well pump directly affects the pump efficiency.1–4 The inter-stage clearance of the submersible well pump and the clearance between the seal ring around the level of well pump not only lead to the volume loss5,6 but also could change the pump inner flow structure, which has an important influence on the overall pump performance. However, the clearance size is relatively small, and the internal flow is complex, so it is difficult to obtain the leakage of the inter-stage clearance through experiment. In most cases, the inter-stage clearance is often ignored by computational fluid dynamic (CFD) numerical simulation or only the front sealing ring clearance is considered. Therefore, to simulate the whole flow field in the model pump with different inter-stage clearances, and analyze the volume and hydraulic loss of the pump are very important.
Currently, there are many researches on the influence of the leakage of the seal ring clearance on the pump performance. Baskharone 7 used CFD methods to simulate the leakage flow and study its influence on the internal clearance leakage flow of multistage pump. Li et al. 8 predicted the external characteristics of screw centrifugal pump with CFD and compared it with the results of performance test. A labyrinth seal ring was used in numerical simulation by Toshio et al., 9 which analyzed the influence of the seal ring clearance leakage and flow on force of impeller. Liu et al.10,11 studied the leakage of the seal ring with different diameter chamber hole floating impellers to measure the back seal ring outlet pressure and the inlet pressure of pump. Cao et al. 12 changed the direction of low-specific speed centrifugal pump impeller balance hole to radial direction and made the impeller sealed leak fluid reflux into the direction of the impeller flow to analyze the cavitation characteristics of the nonbalance hole structure. Shi et al. 2 studied the impact of different inter-stage clearances on multi-level well pump performance and flow field by simulating whole flow field of pumps with different inter-stage clearances using CFD software.
This article presents a simulation based on a computational domain including inter-stage clearance and front and back seal rings, calculates the hydraulic performance and the inter-stage clearance leakage, and compares and analyzes the numerical simulation results with the level of leakage empirical formula.
Physical model and numerical method
Physical model
The type of pump model in this article is 200QJ80-22 with two stages, in which rated flow is 80 m3/h, rated head is 22 m, rated speed is 2850 r/min, impeller diameter is 124 mm, impeller inlet diameter is 79 mm, outlet angle is 25°, the number of blades is 6, and the inter-stage clearance of the impeller diameter is 28 mm.
Empirical formula of leakage
The estimation formula of the inter-stage clearance leakage of the seal ring in the submersible well pump is 6

where
Calculation formula of flow coefficient of flat seal ring is 6

where
The multi-stage centrifugal pump with specific speed is 6

where n is the rated speed of the pump (in r/min), Q is the rated flow (in m3/s), and H is the head of the pump (in m).
For multi-stage centrifugal pump with specific speed ns = 150–250, usually guide vane is space guide vane. The pump clearance leakage flows through the impeller, which means the leakage is volume loss, and the pressure drop between inter-stage seal clearances will be used to approximate the value of single-stage head.
Numerical model
In this article, the three-dimensional (3D) modeling of the inlet section, the impeller, the space guide vane, the front and back sealing rings, the clearance, and the outlet section is carried out through the Pro/E software platform. The whole mesh generation process was carried out in the ICEM 13.0 software, and the two-stage whole flow field was meshed with structural grid. In this study, the grid sizes are less than 2.0 or the grid numbers are larger than 3.12×10⁶. Figure 1 shows a general view of the model pump two-dimensional (2D) assembly drawing and the mesh in the impeller.13,14

(a) 2D assembly drawing and (b) structural grids.
The rotating part and the stationary part with the multireference frame model in FLUENT software are based on CFD platform. The channel flow field was set as 3D incompressible steady viscous flow, using standard k–ε two-equation turbulence model. SIMPLE algorithm was used for the pressure and velocity coupling. Turbulence flow near the wall is treated as the standard wall condition. The velocity at the inlet of the first impeller is set to be irrotational, the center section of the inlet pressure is set as the reference point of pressure, and the relative pressure is 0; the outflow is set as free flow. It is assumed that the solid wall is no-slip, which means the velocity in different directions on the wall is 0. The convergence accuracy is 10−5, and the rotational speed is 2850 r/min. 14
Inter-stage clearance leakage analysis
Leakage in different inter-stage clearances
Leakage of the inter-stage clearance directly affects the pump volume losses; thus, it has a greater impact on the performance of the whole pump. The submersible well pump 6 inter-stage clearance value is generally running between 0.2 and 0.7; when the value is <0.2, the impeller is easy to rub into the sealing ring when rotating. However, when the value is >0.7, the leakage will increase and the performance will drop obviously, and it has little significance to study the large clearance. So, in this article, the value of inter-stage clearance is, respectively, 0.2, 0.35, 0.5, and 0.7 mm. Comparative analysis of the empirical formula was carried out to estimate the amount of leakage and then compare it with the numerical simulation results.
Figure 2 shows a comparison analysis between the amount of leakage from theoretical formula and leakage from CFD numerical simulation. We found that the leakage obtained by empirical formula is larger than the numerical simulation results when estimating the leakage with theoretical formula. Meanwhile, the theoretical head in the estimation equation is almost the same in different clearances. When the clearance is >0.5 mm, the performance of the whole pump shows a sharp drop. With the increasing of clearance, the head drops more sharply. Therefore, when the inter-stage clearance is larger, the estimation from theoretical formula tends to be larger.
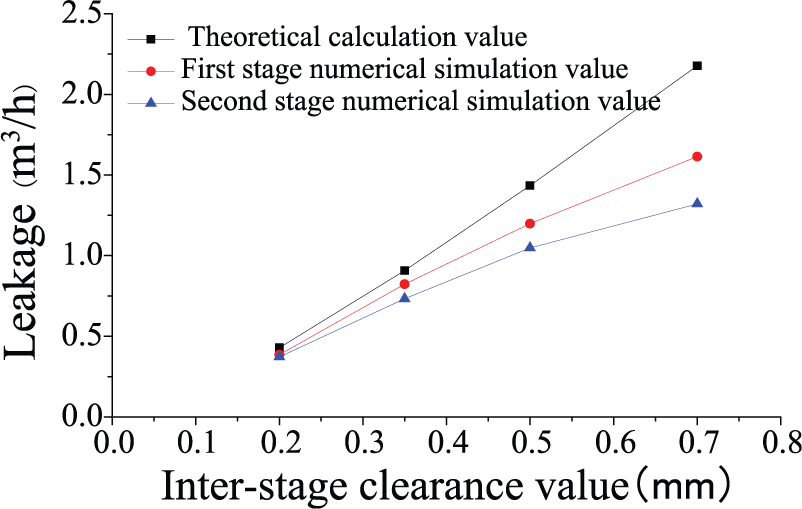
Comparison of inter-stage clearance leakage with different clearances.
Leakage flow in different conditions
To further analyze the effect of the inter-stage clearance leakage on the pump performance, the leakage calculated with the theoretical formula and simulated with the clearance in 0.5 mm were compared and analyzed. So, the effect of inter-stage clearance leakage on the performance of well-submerged pump in different conditions was discussed.
Figure 3 shows the comparison of the clearance leakage in different conditions when the clearance is 0.5. It shows that the leakage flow rate calculated from empirical formula is far larger than the numerical simulation. The reason might be that the pressure drop in clearance used in empirical formula is the single-stage head value. However, the liquid flows back to the back pump chamber through clearance from guide vane outlet and propagates to impeller inlet through the balance hole, so a part of liquid in the back pump chamber is the leakage from the back sealing ring. Also, the clearance outlet is nearer to the back sealing ring clearance outlet, far from balance hole, so a large pressure drop occurs, which indicates that the pressure drop between clearances is much less than single-stage head. Consequently, if the single-stage head obtained by test is used in place of to calculate the leakage will lead to a larger leakage flow rate.

Comparison of inter-stage clearance leakage with different flow rates.
Thus, with the continuous improvement of computer technology, the clearance leakage should be considered in the CFD of different kinds of pumps. It could give a relative precisely reference for estimating pump volume efficiency.
Internal flow field analysis
Inter-stage clearance pressure
In general, the effect of changing inter-stage clearance in submersible well pumps is reflected in pump performance. In order to have a more direct and quantitative analysis of the inter-stage clearance pressure energy loss, the monitoring points are marked at the middle cut line of the inter-stage clearance. The positions of the monitoring points are shown in Figure 4.

Inter-stage clearance monitoring points’ locations.
In Figure 5, we could find that the static pressure of the inlet region of the inter-stage clearance is larger, and the static pressure drops sharply in the clearance. There is no significant change in the static pressure value in the outlet area. The trend of static pressure with the clearance of 0.2, 0.35, and 0.5 mm is consistent. When the clearance value is 0.7 mm, the static pressure drops significantly in the inlet of inter-stage clearance, and the difference in static pressure in the inter-stage clearance and outlet of the clearance is not obvious. The leakage in the inter-stage clearance is that the liquid flows through the balance hole to the back cover plate of impeller inlet. There is a relatively small pressure difference between the inlet and the outlet of the guide vane, which is the reason why the head drops significantly in the clearance of 0.7 mm. The pressure between the first and second inter-stage clearance inlet and outlet has decreased slightly and then rises again. This is mainly due to a large area in the inlet and outlet of inter-stage clearance and the liquid flows into or outflows to the smaller gap suddenly.

Static pressure changing trends along monitoring points at rated flow: (a) first stage and (b) second stage.
Flow field analysis of balancing hole area
The size of inter-stage clearance directly affects the pump performance; the lager clearance leads to lager leakage, lower efficiency, and lower head. From the inner flow field, the influence of the inter-stage clearance size on the performance is analyzed. Figure 6 presents the kinetic energy in region of balancing hole, while the front and back seal ring clearances are constant, and inter-stage clearance (b) is 0.2, 0.35, and 0.7 mm, respectively.

Comparison of balanced hole area turbulent kinetic energy under different inter-stage clearances at rated flow: (a) first stage and (b) second stage.
As can be seen from Figure 6, when the inter-stage clearance is 0.2 mm, due to the little leakage of clearance, the leakage through the balance hole has little impact on the inlet flow field of the impeller. The turbulence energy is small in this region, so there is less energy loss and higher efficiency in this case. As shown in Figure 6, with the increase in the inter-stage clearance values, the leakage through the inter-stage clearance is increasing. Especially when the value of clearance reached 0.7 mm, shock loss increased sharply, the fluid flow through the balance hole has a bigger impact on the inlet flow field of the impeller, which will have a serious disruption on the internal flow field of the impeller, and lead to hydraulic loss and volume loss serious, the efficiency and the head sudden drop as shown in Table 1. Therefore, it is very important to strictly control the value of the inter-stage clearance for hydraulic structural parameter and performance optimization design.
Numerical results with different values of inter-stage clearance at rated flow.

Numerical calculation and test results
The experimental study of the model is able to not only verify the reliability of CFD numerical calculation but also analyze the difference in the performance of different clearances. So, the 200QJ80-22 prototype model was manufactured and tested by test rig as shown in Figure 7. Experiments were done in an open-type pump system, which have the identification from Jiangsu Province of China. The test rig is composed of two parts, namely, the data acquisition system and the water circulation system. 15 The data acquisition system changes all kinds of physical quantities at different conditions, while the water circulation system supplies the necessary environment for submersible well pump. The test rig is shown in Figure 7. A turbine flowmeter was used to measure the flow Q, and the precision of turbine flowmeter is ±0.3%. Speed n is measured by a tachometer (PROVA RM-1500, Taiwan). During the experiment, only one dynamic pressure transmitters (CYG1401) was used to measure the outlet pressure. The precision of CYG1401 is ±0.2%.

Test ring of submersible well pump.
The overall measurement uncertainty is calculated by the square root of the sum of the squares of the systematic and random uncertainties, 16 and the calculated result of expanded uncertainty of efficiency is 0.5%.
In the pump performance test, pump efficiency was normally defined as follows

where

where
The test results were compared with the results of three kinds of 3D flow field model, which neglects all the seal leakage, considers front seal ring leakage only, and takes all seal ring leakage into consideration, respectively. The gap values used in simulation are in agreement with the test pump. The results are shown in Figure 8.

Comparison of the numerical and test results: (a) pump efficiency and (b) pump head.
Figure 8 shows the numerical results and test results of the efficiency and head, respectively. The efficiency of the numerical calculation which ignores the efficiency and effectiveness of all seal is different from the experimental efficiency, and the difference in the rated operating point is 24.5%. The difference between the numerical calculation of only considering the front sealing ring clearance and the test efficiency is 12.9%. When considering all the sealing gap, the efficiency between numerical simulations and test results is relatively close, which has only 6.7% discrepancy. The numerical calculation head which ignores all the sealing clearance and only considers the front sealing clearance is different from test head; the discrepancy is 25.9% and 15.9%, respectively. The difference between the head and the experimental head is 9.3%, which is considered by the numerical calculation of the sealing clearance. Numerical results are slightly higher than the experimental results; the main reason is that the numerical calculation does not take into account the mechanical loss, leakage loss, and structural components of the roughness and other factors. Therefore, in the optimal design of the pump, the clearances of inter-stage and the front and back seal ring are usually not considered. If the calculations are conducted on simplified model, a lot of work is saved, but the results obtained by this method are quite different from the real test value, which cannot reflect the pump performance.
Therefore, we use CFD to the full flow field numerical calculation of submersible pumps’ optimum design, which should consider all the leakages. Although the former process of modeling, meshing, and calculation parameters sets a large workload, it can obtain a more accurate numerical result.
Conclusion
Using empirical formula to calculate the leakage in inter-stage clearance of submersible well pump, larger clearance leads to a larger deviation at rated operating condition. There is no change in the head when the empirical formula is used. In fact, the head of the whole pump decreases with the increase in the clearance. Therefore, when we estimated the leakage or volume loss in clearance, the static pressure difference between two ends of the clearance should be calculated, which could give a better results closing to the actual situation.
When the inter-stage clearance reaches a certain value, the static pressure value in the inlet and outlet area decreased sharply, and the head decreased sharply. The static pressure value has no obvious change in the inter-stage clearance and the outlet of inter-stage clearance. The flow field becomes disordered with the increase in the inter-stage clearance in the balance hole region at front cover board and results in the increase in the whole pump hydraulic loss. Therefore, after running for a period of time, the seal ring clearance and the inter-stage clearance are subject to wear and become larger, so the leakage is increased. In this case, the flow field in the inlet of the impeller becomes disorder; the volume loss and hydraulic loss increase, leading to the decline in the performance of the whole pump.
When we use the CFD to optimize a submersible well pump, all seal ring leakages should be considered. The whole flow field numerical calculation not only leads to more accurate response on the actual situation of the project but also leads to a better comparison analysis with experimental data, which could achieve the purpose of optimizing the pump performance.
Footnotes
Academic Editor: Magd Abdel Wahab
Declaration of conflicting interests
The author(s) declared no potential conflicts of interest with respect to the research, authorship, and/or publication of this article.
Funding
The author(s) disclosed receipt of the following financial support for the research, authorship, and/or publication of this article: This project is supported by the Priority Academic Program Development of Jiangsu Higher Education Institutions (PAPD), Industry Academia Research and Prospective Joint Research Project of Jiangsu Province (by 2015064-08), and the Graduate Innovation Project of Jiangsu Province in China (CXZZ13_0677).