
Abstract
Due to the rapid development of large thermal power stations and nuclear power stations, it requires that the power grid should provide greater capability and flexibility. Security, stability, and economy in operation should also be taken into consideration. The pumped storage power station which has double peak regulating capability is a good choice to realize this goal. However, the existence of S shape characteristic of a pump turbine in generating mode at off-design condition makes it difficult to connect to the power grid. So it is necessary to analyze the reason of S shape characteristic in pump turbine by experimental investigation and numerical simulations. To achieve the above-mentioned object, numerical simulations of a pump turbine’s internal flow field were performed. The generating mode was analyzed by unsteady computational fluid dynamics simulation. The evolution of flow details in runner regions under the S shape characteristic conditions was observed by changing the guide vane opening. The unsteady flow structure and load on the blades in regions of S shape characteristic were obtained, which will contribute to the design of hydro-turbine.
Keywords
Introduction
Rapid developments of large thermal power plants—either coal or nuclear—need more powerful and feasible ability of the electrical system. It requires that the power grid should provide greater capability and flexibility. Rigorous safe, stable, and economical strategy of the electrical system is needed because of the randomness of the electricity between demand and supply. Pumped-storage power plants have strong ability of peaking and are convenient in starting, stopping, and compensating. It can decrease the cost of electrical system construction and supply the need of peaking and frequency adjustment, which increases the quality and reliability of the electrical supply and improves the operating conditions of electrical system. Pumped-storage power plants have taken the task of power-frequency control for the electrical grid. 1 Some real machine tests and experiments indicate that the unstable operation problems are possible to come into existence when the turbine subjected to S shape characteristics (Figure 1). Depending on the specific speed of the pump turbine, the discharge-speed as well as torque-speed characteristics at constant guide vane opening can be “S-Shaped.” 2 In this case, the machine operation may become strongly unstable at runaway speed and beyond, with a significant increase in structural vibrations and noise. Moreover, a stable runaway operating point is difficult to be reached and therefore the synchronization with the electrical network in safety conditions becomes impossible. 3 In this case, one rotational speed may correspond to three discharge values, which will inevitably increase mechanical vibrations and noises to a larger extent. Most of all, it is difficult for the hydraulic machine to be synchronous with the power network. The existence of S shape characteristic in low head start of a pump turbine is the restriction of the pump turbine development. This will induce large pressure pulsations and vibrations in pump turbines.4–6 And this characteristic of reversible pump turbine will lead to severe difficulties in the transition process of generators cut-in.

Complete characteristic curves of pump turbine.
The hydromechanical mode period depends on the rotating inertias, the penstock water inertia, and on the local gradient of the turbine characteristic in the S shape as it is well described by Martin.7,8 To investigate the reason of S shape characteristic, some researches were carried out. Hasmatuchi 2 found that by numerical simulations the pressure fluctuation in the stay vane zone will increase from turbine status to runaway status. Anciger et al. 9 described the rotating stall and cavitation inception phenomena, which will lead to the instability of a pump turbine, using computational fluid dynamics (CFD) simulations. Yin et al. 10 investigated the possible different flow patterns existing in pump turbine under off-design conditions in pump mode. The simulation result was compared with experimental data and they showed good agreements. Velocity field analyzing in stay vanes and guide vanes found the “jet-wake” flow pattern in the pump turbine. And the S shape characteristic of a pump turbine was predicted and the results coincided well with the experimental results. 11 The flow field in the turbine was described as well. 12 Tani and Okumura 13 improved the efficiency of the pump turbine under turbine status by applying the CFD method to the turbine design. Blanc-Coquand et al. 14 analyzed the influence of blades’ number, flow rate, and vaneless zone area on the rotor–stator interaction by introducing unsteady CFD computation of the pump turbine under both turbine status and pump status. Backman 15 simulated the three-dimensional (3D) flow field of a pump turbine and studied the rotor–stator interaction through analyzing the flow distribution, amplitude, and frequency of pressure fluctuations. Pettersen and Nielsen 16 proposed the mathematical equations of pump turbine complete character curve according to the mathematical theory of pump turbine inner flow character. And “S” character was sketched according to the equation derivation and analysis. Hasmatuchi 17 found in the experiment that the pressure fluctuation of a turbine in the guide vane region will increase, and the low frequency component in the pressure fluctuation will increase evidently when the turbine steps into the “S” region. Gentner et al.18,19 has evaluated several CFD procedures with different approaches for the calculation of the described instabilities in pump and turbine operation. Sun et al. 20 Studied the S character of a pump turbine with discrete-event simulation (DES) model. Borresen and Knutsen 21 deeply studied the flow character under turbine status; however, the flow character under runaway status and braking status are less studied. The article carefully examined the flow field of a pump turbine under turbine mode, runaway mode, and braking mode at different guide vane openings. The mechanism of S shape characteristic of the turbine was analyzed.
Case description
The parameters of pump turbine model studied in the article are shown in Table 1. Figure 2 shows the meridional sketch of the turbine runner. The scaled model parameters are provided by Harbin Institute of Large machinery. The specific speed of the scaled model is nq = 29.58 r min−1. The whole flow passage of the scaled turbine is simulated in the article. The scale turbine model includes spiral casing, stay vanes, guide vanes, runner, and draft tube (see Figure 3).
Geometrical parameters of scaled turbine.


Meridional sketch of the turbine runner.

Model of scaled turbine.
Numerical scheme
A time-dependent Reynolds-Averaged Navier–Stokes (RANS) model is chosen for the governing equations of the flow, and numerical simulations are performed in order to obtain the flow field in the turbine flow passage. Commercial CFD code CFX is used to carry out the numerical simulations. The code solves the incompressible unsteady time averaged Navier–Stokes equations in a primitive variable form. No-slip condition is assumed on all the solid walls. The effects of turbulence are modeled using the shear stress transport (SST) model. 10 The flow near the wall area will be calculated by transport equation, and automatic near-wall treatment is introduced in the model. Boundary function will shift to the low Reynolds number wall function in the near-wall region, so that the continuity equation and momentum equation can be solved in the sub-layer. The mesh for simulations is generated by ICEM grid generator (see Figures 4–7).

Mesh in spiral casing.

Mesh in stay vanes and guide vanes.

Mesh results in runner: (a) mesh in runner and (b) mesh at blade inlet.

Mesh results in draft tube: (a) mesh in draft tube and (b) mesh at the cross section of draft tube.
Three different grid densities (fine-G1 with grid number of 9.96 million, medium-G2 with grid number of 6.62 million, and coarse-G3 with grid number of 4.43 million) were used to carry out the grid sensitivity check. The type G3-type mesh was the coarsest mesh in the simulation. The subsequent mesh was updated by 1.5× in the grid number. The grid quality was taken into consideration at each step of grid creation so that the mesh nodes did not correspond exactly to a 1.5× increase. The simulations were performed at the 45.5% guide vane opening, and operating condition n11 = 35.529 r m1/2 min−1, Q11 = 0.3194 m1/2 s−1, for all grid types. The grid convergence index (GCI) method was used to evaluate the numerical uncertainties and grid convergence. The extrapolation values and uncertainty in the grid convergence were estimated using the GCI method: 22 the computed flow parameters are established in Table 2, and Figure 8 shows the grid check results. The approximate and extrapolated relative errors are estimated as


Computed flow parameters. a

Experimental head is 14.92 and experimental efficiency is 85.51 for the validated condition.

Grid sensitivity check.
The GCI from G2 to G1 was very low compared to the GCI from G3 to G2. And the turbine head and efficiency with the fine grid are closer to the experimental results. The converged solution with the fine grid (G1 with grid number of 9.96 million) was used for further simulations at different operating conditions.
The grids near the wall are specially treated. And the grid information of each part is shown in Table 3. According to the recommendations of Versteeg and Mlalasekera, 23 y+= 11.63 can be regarded as the edge of boundary layer.
Grid information.

The inlet is set as mass flow inlet, the outlet of the turbine is set as pressure outlet, and the runner speed is set as the experiments. The interface between spiral casing and stay vanes was simulated by general grid interface (GGI); the interface between guide vanes and runner was simulated by transient frozen rotor; and the interface between runner and draft tube was simulated by transient frozen rotor.
Swirling strength method is applied to analyze the flow field in the article. Swirling strength method is an analysis method based on the critical point of local velocity gradient. The swirling strength is defined as the imaginary part of complex eigenvalue of velocity gradient tensor

where x, y are x and y coordinates, respectively (m), and vx, vy are velocities in x and y directions, respectively (m s−1).
Zhou et al.24,25 proposed that the imaginary part of complex eigenvalue of velocity gradient tensor can display the vortex structure and quantize local vortex intensity, and the parameter is defined as the swirling strength. Adrian et al. 26 state that the method is a responsible method to identify and count vortexes in flow field.
Results discussion
The computations are carried out at the guide vane opening of 22.7%, 45.5%, and 145.5% (with respect to the best efficiency point guide vane opening, aBEP = 22 mm, set as 100% opening) under the condition of first quadrant in the turbine character chart. Several operating conditions are simulated under each guide vane opening. During the data process, time averaged results are used for efficiency (η), head (H), torque (T), and flux rate (q). Instantaneous results are attained for contours, streamlines, and pressure profiles.
Experiments are carried out on the hydraulic platform of Harbin Institute of Large machinery. The accuracy of the platform is designed to accord with standard of IEC 60193. Figure 9 shows the test rig in Harbin Institute of Large Electrical Machinery.

Hydraulic turbine test rig in Large Electrical Machinery.
Figure 10 shows the numerical results and experimental results under the guide vane opening of 22.7%, 45.5%, and 145.5%. From the results we know that there is no S shape characteristic at the guide vane opening of 22.7%, that S shape characteristic in the character chart of 45.5% guide vane opening is not very evident or has slight S shape characteristic, and that there is evident S shape characteristic at the guide vane opening of 145.5%.
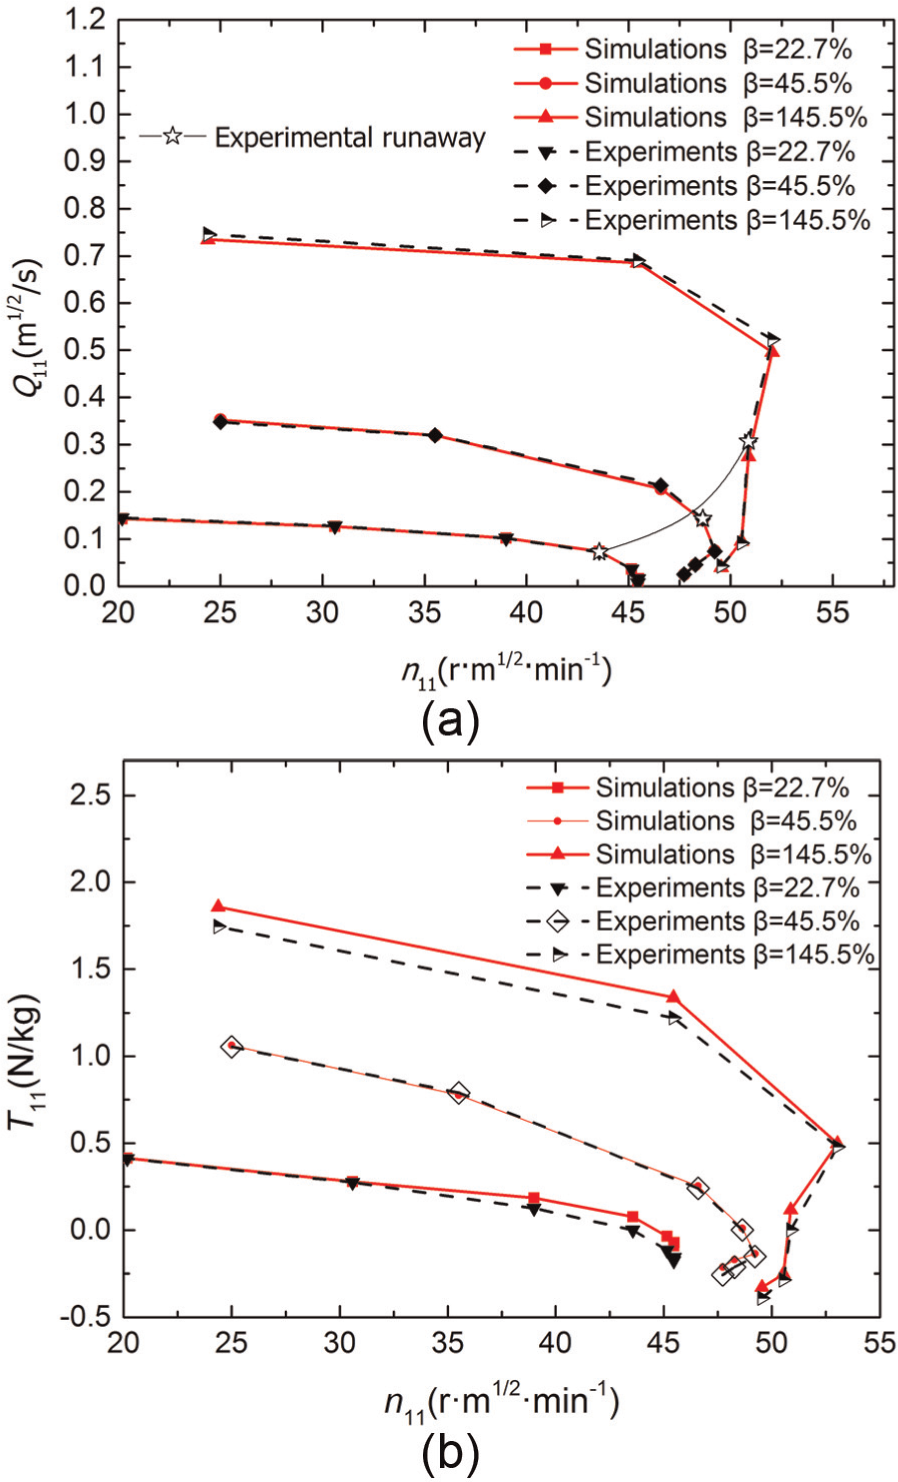
First quadrant character of pump turbine under different guide vane openings: (a) n11–Q11 profile and (b) n11–T11 profile.
The operating conditions chosen to be analyzed are listed in Table 4. They are selected to be stable state (without S shape characteristic), limit of stability state (with less S shape characteristic), and unstable state (with evident S shape characteristic). The three points are located on the different positions of “S” zone of the character curve. Runaway conditions are the operating conditions in which the torque of the runner is zero. And breaking conditions are the operating conditions in which the torque of the runner is below zero. The shown results below are instantaneous ones. States with the same runner phase are selected, for example, the runner at the same position relative to spiral casing and draft tube.
Simulation conditions.

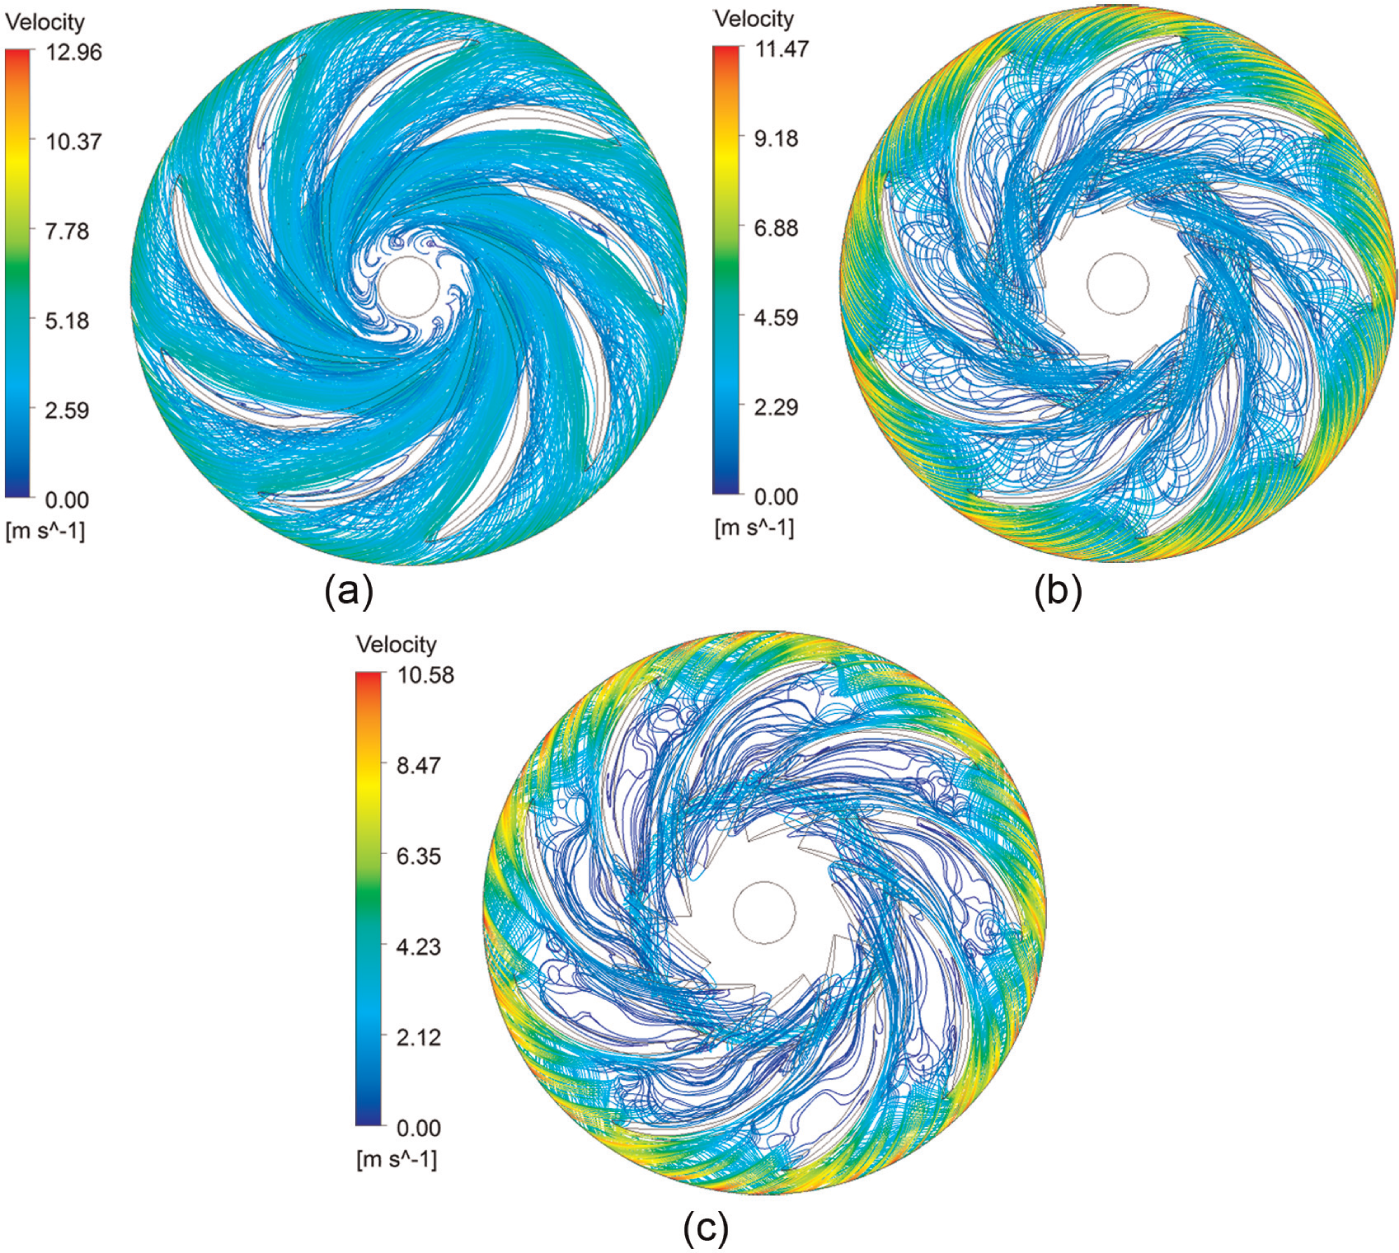
The runner is the components for a turbine to realize the energy transfer, which greatly affects the efficiency and stability of a turbine. Figures 11–13 show the streamline principle in turbine runner at the guide vane opening of 22.7%, 45.5%, and 145.5%, respectively.

Streamlines in runner at 22.7% guide vane opening: (a) turbine status (t = 0.36 s), (b) runaway status (t = .0352 s), and (c) braking status (t = 0.353 s).
Streamlines in runner at 45.5% guide vane opening: (a) turbine status (t = 0.359 s), (b) runaway status (t = 0.369 s), and (c) braking status (t = 0.36 s).
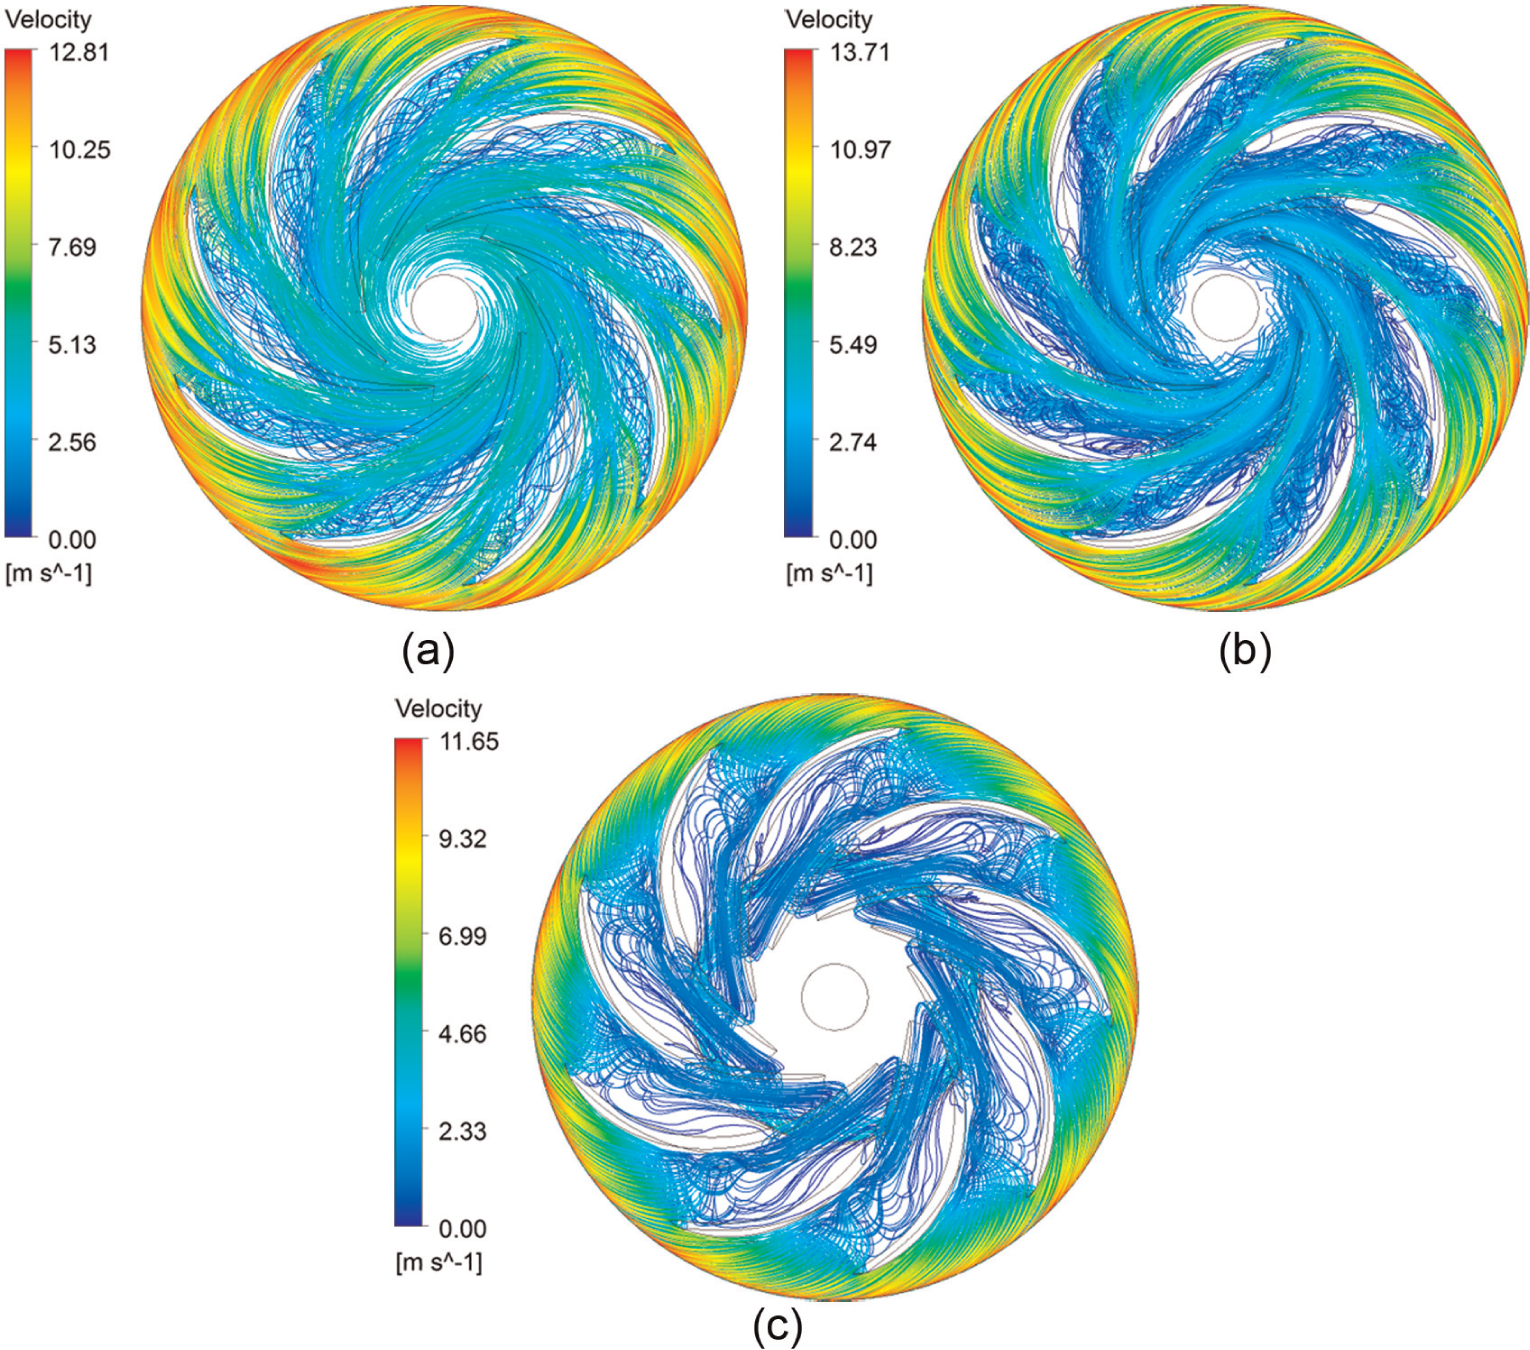
Streamlines on the runner mid-span at 145.5% guide vane opening: (a) turbine status (t = 0.379 s), (b) runaway status (t = 0.401 s), and (c) braking status (t = 0.385 s).
There is almost no vortex in the runner under turbine operating status. The vortex has emerged in the runner under runaway operating status. There are more vortexes in the runner under braking operating status than under runaway operating status, and the vortex will block up the flow passage. The larger the guide vane opening, the smoother the streamline distribution, and the later the vortex movement emerge under runaway operating status and braking operating status. The vortex intensity will be weaker and the influenced region will be smaller. The reason is that the vanes produce larger prevention to backflow of vaneless zone under smaller guide vane opening, which makes the vortex develop rapidly when the turbine step into runaway or braking operating status. While under larger guide vane opening, backflow in vaneless zone will transfer to the guide vane passage smoothly, which slows down the development of vortex at the runner inlet.
Figure 14 described the pressure surface, suction surface, leading edge, trailing edge, and rotational direction of the turbine runner blades in the form of cascade expansion which will be analyzed in Figures 15–20.

Description of turbine runner blade.

Streamline distribution in the runner at the guide vane opening of 22.7%: (a) turbine status (t = 0.36 s), (b) runaway status (t = .0352 s), and (c) braking status (t = 0.353 s).

Streamline distribution in the runner at the guide vane opening of 45.5%: (a) turbine status (t = 0.359 s), (b) runaway status (t = 0.369 s), and (c) braking status (t = 0.36 s).
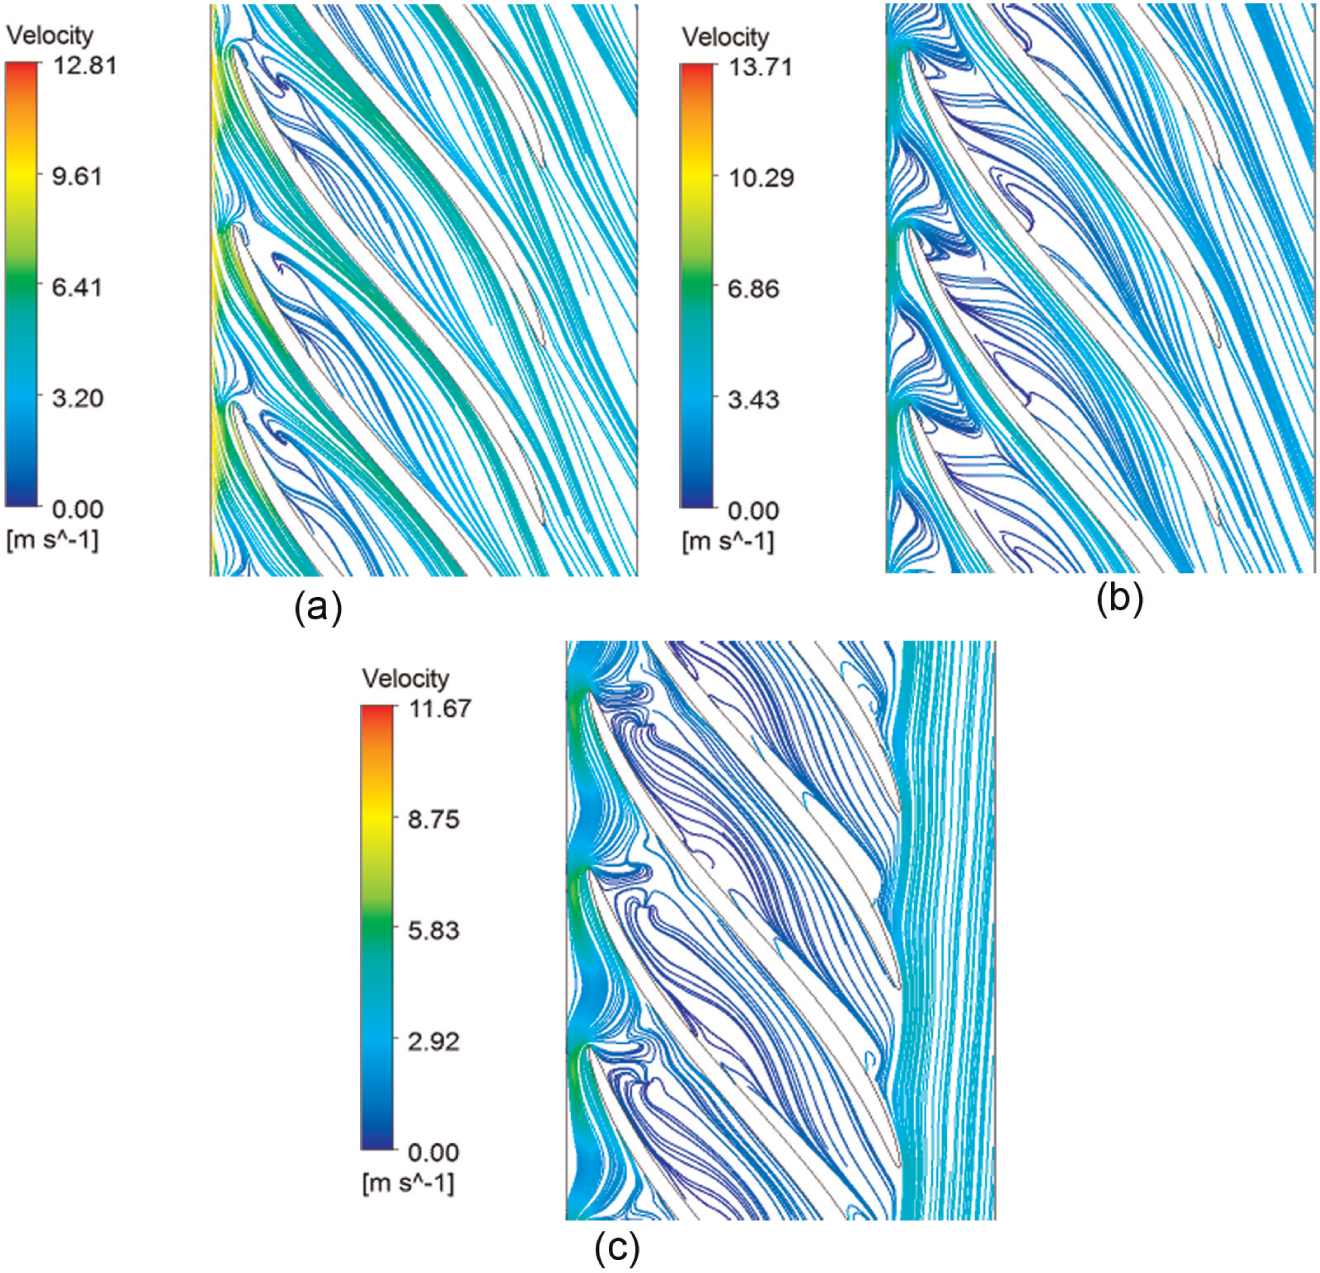
Streamline distribution in the runner at the guide vane opening of 145.5%: (a) turbine status (t = 0.379 s), (b) runaway status (t = 0.401 s), and (c) braking status (t = 0.385 s).
Vortex intensity distributions at 22.7% guide vane opening: (a) turbine status (t = 0.36 s), (b) runaway status (t = .0352 s), and (c) braking status (t = 0.353 s).

Vortex intensity distributions at 45.5% guide vane opening: (a) turbine status (t = 0.359 s), (b) runaway status (t = 0.369 s), and (c) braking status (t = 0.36 s).

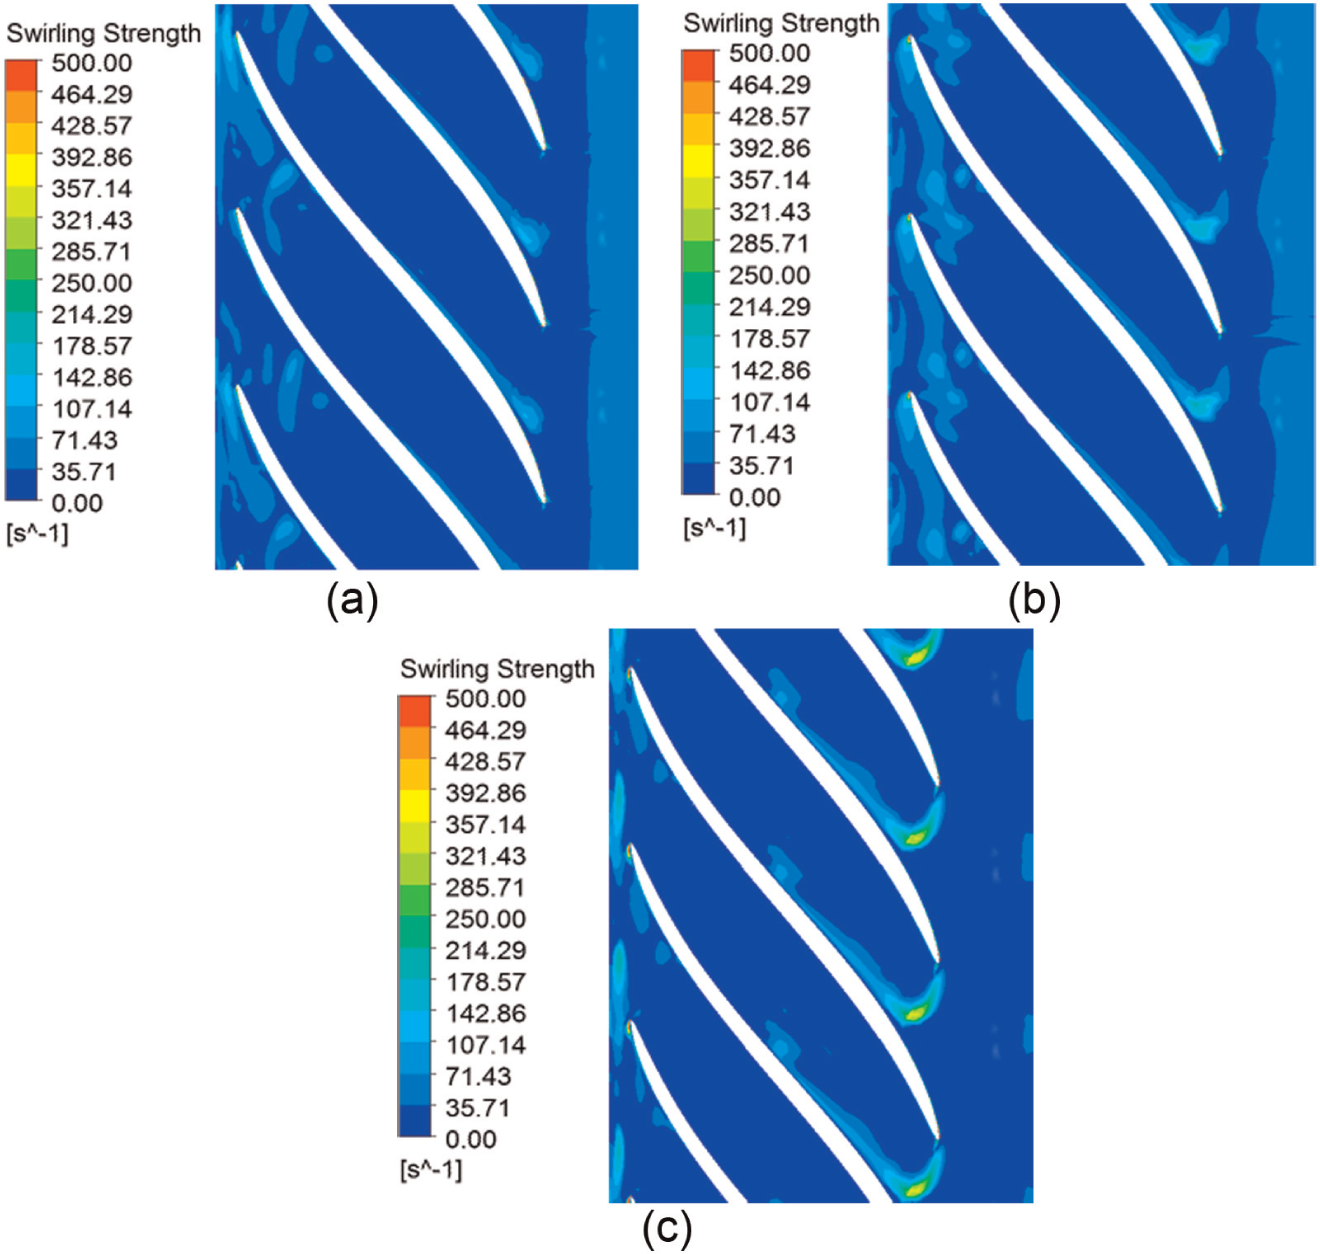
Vortex intensity distributions at 145.5% guide vane opening: (a) turbine status (t = 0.379 s), (b) runaway status (t = 0.401 s), and (c) braking status (t = 0.385 s).
Figures 15–17 show the streamlines distribution at the guide vane opening of 22.7%, 45.5%, and 145.5%, respectively. The cutting planes analyzed are the middle stream surface in each condition. At the guide vane opening of 22.7%, two vortexes will be produced at the runner inlet, and the rotational direction of two vortexes is opposite to each other. Under braking status, the two vortexes at the runner inlet will merge and almost block the flow passage. The fluid at the inlet region cannot flow into the middle and tail part of the runner because of the blockage of the two vortexes. Contrariously, the fluid will flow back to the vaneless zone. Under turbine status, the flowback area is small and the vortex is weak. The flow is relatively steady and smooth. Under runaway status, the water will flow into the cone spirally because of the influence of two vortexes in the flow passage. Under braking status, the flow passage will be blocked by a vortex at the inlet, and another new vortex at the middle region of the flow passage will emerge. At the guide vane opening of 45.5% and 145.5%, similar principle will appear. The unsteady condition comes later or the turbine flow is more stable under large guide vane opening than that under small guide vane opening.
Figures 18–20 show the vortex intensity distributions in runner zone. Vortex with high intensity mainly distributes at the inlet and the outlet of the runner. The intensity of vortex at the outlet of the runner is larger than that of the vortex at the runner inlet. The increasing of guide vane opening will enlarge the flux difference between turbine status and braking status, which leads to a higher flow rate at which the vortexes appear under a larger guide vane opening. The vortex intensity will be larger and the vortex region will be wider. The “misplacement” and the difference of flow rate at which the vortex appear may be the reason of S-shaped character. At the guide vane opening of 145.5%, the vortex will appear at the inlet and outlet of runner from runaway status to braking status, and the vortex will be enhanced during the processing. The flow stability will become worse.
The load on the blades will be influenced a lot by flow profile in the runner. Figures 21–23 show the load on the blades under different conditions. At the inlet and outlet of the runner, the pressure on the pressure surface of a blade is lower than that on the suction surface due to the vortex at inlet and backflow at outlet under turbine status with guide vane opening of 22.7% and 45.5%. The fluid will obtain energy from the blades in this region. Some water with increasing energy will flow back to the vaneless zone, which will lead to the pressure increase. At the other location of a blade, the pressure on pressure surface of a blade is higher than that on the suction surface because the blades will obtain energy from fluid. The fluid will obtain energy from blades only at the inlet and there is no backflow at the outlet with the guide vane opening of 145.5%. Under runaway status and braking status, the region where the water receives power by runner blades develops to the downstream caused by the increase in backflow area, which will lead to the lower pressure drop between pressure surface and suction surface. The torque on the runner is “0” under runaway status, while the torque on the runner is negative under braking status.

Pressure profile on the blade at 22.7% guide vane opening: (a) turbine status (t = 0.36 s), (b) runaway status (t = .0352 s), and (c) braking status (t = 0.353 s).

Pressure profile on the blade at 45.5% guide vane opening: (a) turbine status (t = 0.359 s), (b) runaway status (t = 0.369 s), and (c) braking status (t = 0.36 s).

Pressure profile on the blade at 145.5% guide vane opening: (a) turbine status (t = 0.379 s), (b) runaway status (t = 0.401 s), and (c) braking status (t = 0.385 s).
Conclusion
The article studied the flow field of a pump turbine at the guide vane opening of 22.7%, 45.5%, and 145.5% under turbine status, runaway status, and braking status. The first quadrant character of the turbine is obtained through unsteady simulations for the mentioned conditions. It is found that when water receives power from runner blades in the inlet region, braking torque will appear, which indicates that the turbine deviates from the turbine status. When the braking torque enlarged and the whole torque on the runner becomes “0,” the turbine will step into runaway status. When the pressure drop between pressure surface and suction surface becomes nearly “0,” the turbine will step into braking status. Different ranges of vortex and backflow will exist in the runner under different operating conditions at small guide vane opening, and the vortex and backflow mainly distribute at vaneless zone, runner inlet, and runner outlet. At larger guide vane openings, the vortex and backflow will appear in the runner till the turbine step into runaway status. It is to say that the development of vortex and backflow under large guide vane opening shows hysteresis quality with respect to that under small guide vane openings. The S-shaped characteristic is a natural characteristic for a certain hydro-turbine, it cannot be avoided; however, it can be reduced in the period of designing a turbine. Or we can avoid the turbine operating in the S-type section by controlling the motion principle of guide vane when the working condition of the turbine is adjusted.
Footnotes
Appendix 1
Academic Editor: Junwu Wang
Declaration of conflicting interests
The author(s) declared no potential conflicts of interest with respect to the research, authorship, and/or publication of this article.
Funding
The author(s) disclosed receipt of the following financial support for the research, authorship, and/or publication of this article: This work was supported by Foundation for Innovative Research Groups of the National Natural Science Foundation of China (Grant No. 51121004) and the National Natural Science Foundation of China (Grant No. 51176040).