
Abstract
To enlarge the green wave bandwidth between intersections of an artery and to design an effective green wave bandwidth, the conception of partitioned artery was proposed in this article. First, the artery was divided into sections systematically. After the calculation of the average volumes and intervals of the sections, two-way green wave optimization model of arteries based on division of artery was developed. Then, set constraint condition of public cycle by analyzing the relationship between cycle and delay, and the process of searching the bandwidth of partitioned green wave was proposed. Next, the bandwidth of partitioned green wave was optimized by the genetic algorithms with offset and public cycle as variables. Finally, simulation result shows the feasibility and effectiveness of proposed method based on the comparison and analysis of real data in Beijing.
Introduction
Green wave control is one of the most important way to regulate traffic signal of urban artery. The control effect is obvious, and the realization is simple. The core of control is to make vehicles successively come across intersections on the artery as many as possible, which can decrease the average number of stops and average delay time of vehicles.
At present, the commonly used green wave control algorithms are graphic method, numerical solution, MAXBAND method, and so on. Graphic method calculates the offset and public signal cycle of the coordinated intersections by mapping. Numerical solution finds the minimum split offset of the control system. The core model of MAXBAND is the mixed integer linear programming algorithm aiming at seeking the maximum green wave bandwidth. JDC Little proposed MAXBAND model in Little et al.1,2 L Shoufeng et al. improved MAXBAND model by considering the discrete condition of vehicles team and dynamic queue dissipation time in Shoufeng et al. 3 Based on MAXBAND model, NH Gartner and C Stamatiadis proposed MULTIBAND in Gartner et al., 4 which is the variable bandwidth bidirectional green wave coordinated control model. Recently, some new signal control methods have been proposed in Lämmer and Helbing 5 and Xie et al. 6 A green wave band model considering variable queue clearance time has been proposed by Wang et al. 7 The above-mentioned method is mainly optimized and designed based on target of maximum artery green wave, but we can still adjust the offset to make the bandwidth of some intersections in the artery wider while keep the public green waves in its original bandwidth at the same time. In Chen et al., 8 the authors used the traffic volume imbalance coefficients of the key intersections in some consecutive intersections to adjust the offset and make the bandwidth of these consecutive intersections wider without reducing the bandwidth of the green waves at the same time, thus the target of optimizing the offsets can be achieved. This method achieves the designation of comprehensive green wave band based on traffic flow adjustment, but some of its consecutive intersection division and comprehensive green wave band model still have some space to be optimized.
Based on all above, this article puts forward the concept of divided artery, which first systemically divides the artery, then establishes a two-way green wave band optimization model of artery based on piecewise analysis, then sets the constraint conditions of the public cycle, and gives the process of a computerized search of the piecewise green waves bandwidth; thus, the piecewise green wave band can be optimized using genetic algorithm (GA) with offsets and public cycle as optimizing variables.
Two-way green wave model of artery based on partitioned analysis
In practical applications, the links with larger traffic and better practical effect of green wave band configuration should be given the green wave band as wide as possible. Therefore, according to the forward and reverse flow distribution, the whole artery is divided into several subarteries.
Because intersection spacing and the distribution balance degree of space between intersections have effect on green wave band, the average flow rate of each phase and the space between intersections are selected as parameters to set the weight of partitioned artery green wave band
The following equation is the expression of partitioned weighted green wave bandwidth

where N is the sum of coordinated intersections and k represents the directions of traffic flows. Here, k = 1 is the positive direction of traffic flow, and k = 2 is the negative direction. j is the number of intersections of partitioned arteries. kji represents the number of partitioned arteries.
A subartery with a better effect of green wave band will have a greater weight and obtain a wider green wave bandwidth according to equation (1). After getting the green wave bandwidth of partitioned arteries, we would assure the public bandwidth of whole arteries.
To simplify, we take the artery composed by four intersections in Figure 1 as an example. Equation (1) represented the two intersection, three intersection of the positive and reverse piecewise weighted sum of bandwidth. Namely


Partitioned artery diagram.
The first term of above expression is the weighted sum of partitioned green wave bandwidth of positive direction. Its expansion is

The first term is the weighted sum of the green wave bandwidth composed by two intersections of positive direction, and expand it and we can get the weighted sum of the green wave bandwidth of positive direction between intersections 1 and 2, intersections 2 and 3, and intersections 3 and 4

In above model,
Determination of subarteries weight considering amount of traffic flow and spacing factors
Intersection spacing and traffic flow will have a great impact on the green wave. In a certain range, the larger the volume, the better the green wave band’s effect under same bandwidth; the larger space and the more nonuniform of distribution of intersections, the greater the dispersion degree of traffic. Besides, the green wave band effect will be worse under the same bandwidth. Therefore, the green wave bandwidth weight can be determined by traffic flow and space. Weights are divided into two situations that conclude two intersections and three intersections or even more intersections

Weights of two intersections partitioned artery
1. Traffic flow weight
In equation (3), n is the number of the intersection;
The meaning of traffic flow weight
2. Intersection spacing weight

In equation (4),
Weight of partitioned artery consisting of three or more intersections
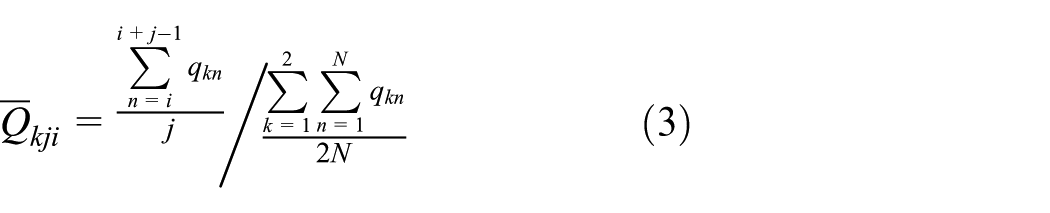
1. Traffic flow weight
The definition of traffic flow weight
2. Intersection spacing weight
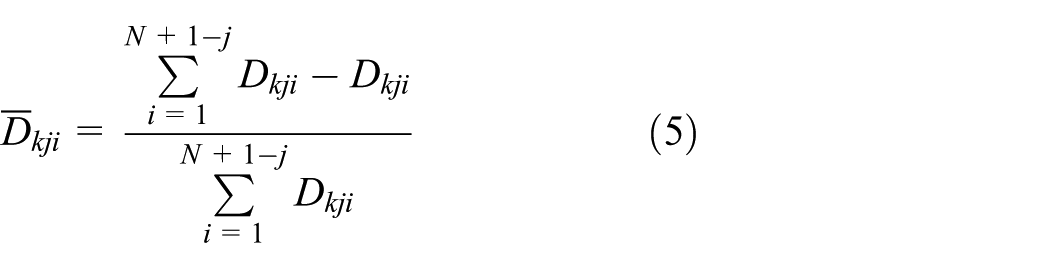
In equation (5),
For partitioned artery consisted of three or more intersections, due to the fact that the actual effect of green wave bandwidth is better when the space is more equal, that is to say if the variance of space between intersections is bigger, the actual effect of green wave bandwould be worse.
9
so the ratio of 1 minus partitioned artery variance to the sum of all partitioned artery variance can be selected as the spacing weight of partitioned artery
Partitioned green wave bandwidth optimization based on GA
Once certain initial conditions of split, average speed of green wave band, and spacing between each intersection are defined, by solving variances of Public cycle and offsets between intersections, the different green wave bandwidths can be obtained. And instead of the above method, by optimizing different combinations of public cycle and intersection phase, the green wave bandwidth could be obtained too.
The GA7,10–12 is used to solve the optimization problem. Flow chart is shown in Figure 2, specific process is shown as follows:
Step 1. Establish the optimization model.
Step 2. Optimized variables and constraints: public cycle and offsets are selected as optimized variables. The range of public cycle
Step 3. Encoding method: real number encoding.
Step 4. Fitness function: the objective function is equation (1).
Step 5. Design of genetic operators: in selection operation, choose the operator using proportional selection operator; in crossover operation, use single-point crossover operator; and in mutation operation, use the basic bit mutation operator.
Step 6. The operating parameters of GAs: population size M, ending evolution generation G, crossover probability Pc, and mutation probability Pm.

Flow chart of optimization of cycle and offsets based on genetic algorithm.
Public cycle constraints
According to the relationship between cycle and vehicle delay of intersections, set
In the process of coordinating artery, different traffic situations of intersections would lead to different adjustable ranges. For example, if assuming, in the artery, the number of intersections is N, then different ranges of


where
Calculation of partitioned green wave bandwidth
The calculation process of green wave bandwidth is actually to obtain the period of green time that vehicles run from first intersection continuously and reach the final intersection without encountering red lights. Figure 3 shows the computer’s search process of green wave bandwidth. In this figure,

Search process of green wave bandwidth.
When split
Examples
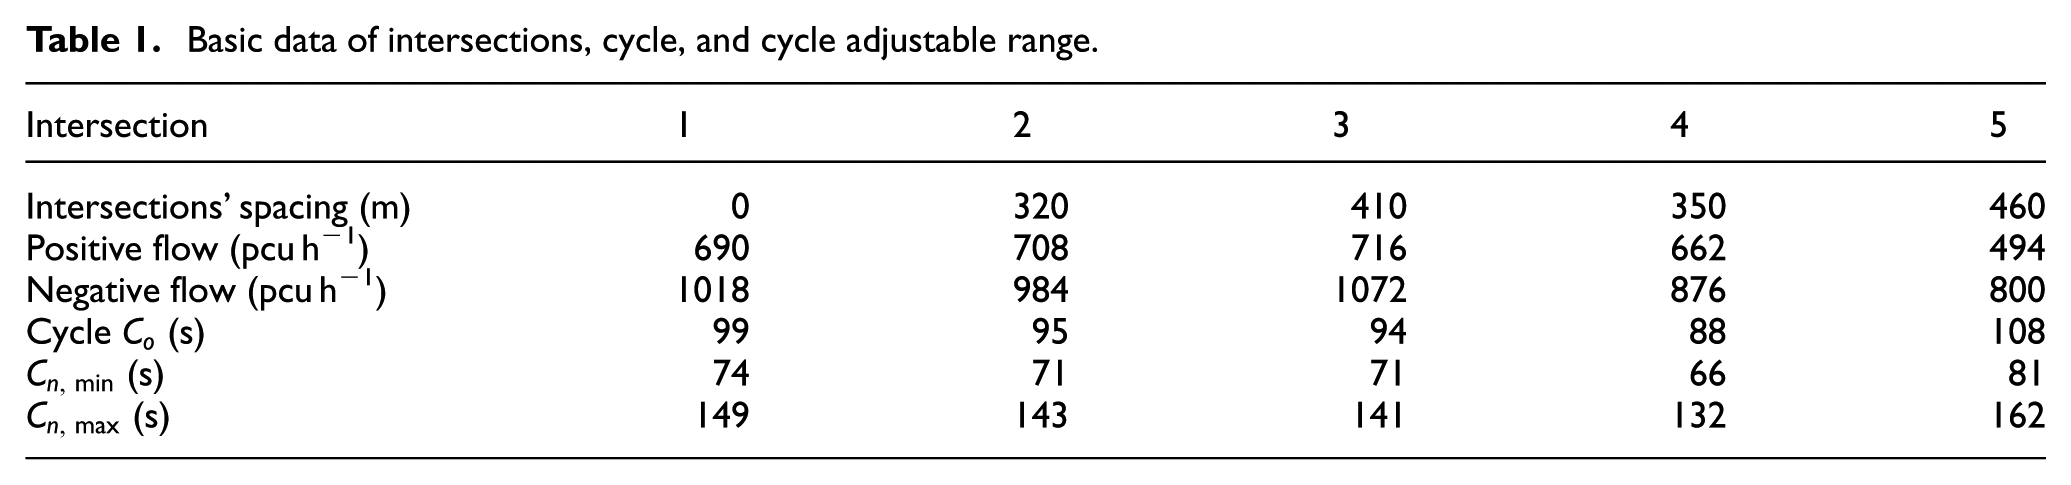
Taking five intersections of Beijing ChaoyangGuangshun North Street (Wangjing North - Lize Street - river shade road - Hu GuangBeiJie - Hongchang Road) as the research object. The basic data of evening peak hour are shown in Table 1. Its forward average speed is 32 km/h, and reverse average speed is 25 km/h.
Basic data of intersections, cycle, and cycle adjustable range.
Traffic simulation software Paramics is used to build the simulation model of artery coordinated control. Numerical method, method in Chen et al., 8 and method proposed in this article are used to solve the model.
The data in the Table 1 provides the base date of intersections. and we can get the intersections best cycle period
Weight of each partitioned green wave.

According to the intersection cycle and cycle constraints
Figures 4 and 5 show green wave space–time diagrams and partitioned artery green wave bandwidth scatter diagram, respectively. Because the purpose of designing a green wave bandwidth is to get the minimum difference between actual space and ideal space, the outcome of positive direction green wave bandwidth is as same as the negative direction green wave bandwidth’s.

Time–space diagram of green wave of three methods: (a) numerical method, (b) the method proposed in Chen et al., 8 and (c) the method proposed in this article.

Scatter diagram for bandwidth of partitioned green wave of three methods.
Applying the method that considers parts of key traffic flow of continuous intersection as the unbalanced coefficient, which is proposed in Chen et al. 8 to design green wave bandwidth. Hence, the calculated partitioned artery reverse bandwidth is larger than the positive bandwidth, corresponding to the actual intersection traffic; the method proposed in this article has the same effect as Chen et al. 8
Besides, the spacing between junctions 1, 2 and junctions 3, 4 is the minimum, so the derived bandwidth of partitioned artery is larger. The space between intersections 1, 2, 3, 4 is uniform; therefore, its partitioned artery has wider bandwidth. The above results are consistent with the design of the objective function of this article.
Figure 6 shows the statistic diagram of public green wave bandwidth of three methods. For numerical solution, positive and negative public green wave bandwidth are 9.3% and 9.3%, respectively; in Chen et al., 8 positive and negative directions of public green wave bandwidths are 7.8% and 12.9%, respectively, although the bandwidth of positive direction is smaller, the that of negative direction is larger, and the sum of the bandwidth of two directions is also increased. For method proposed in this article, the bandwidths of forward and backward public green wave are 14.3% and 27.6%, respectively, both of them are increased compared with the previous two methods.
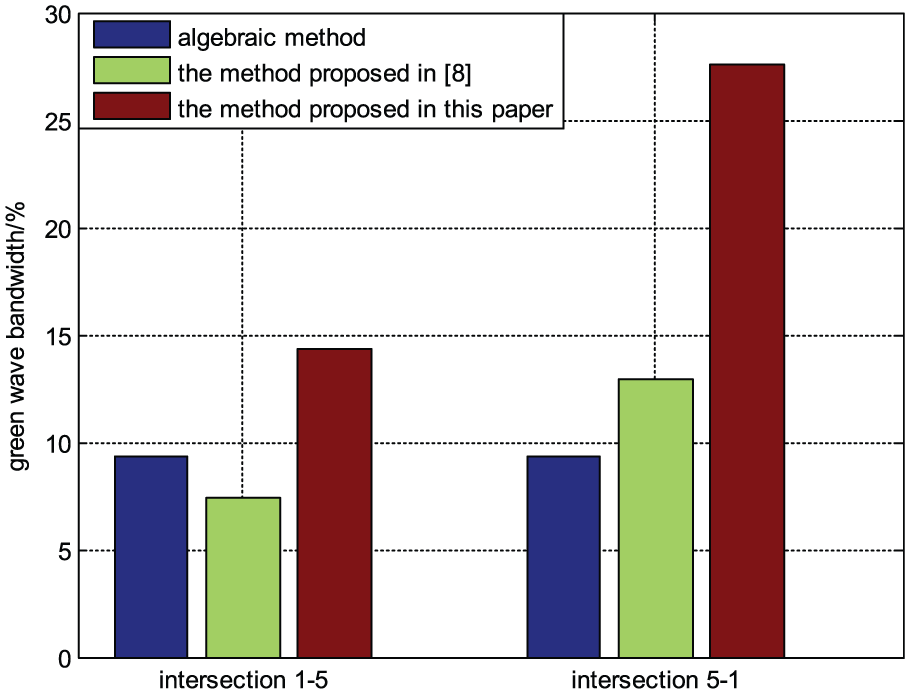
Statistical diagram of inbound (outbound) common green wave bandwidth of three methods.
Table 3 shows the three group evaluation data simulated by three methods. The green wave bandwidth designed by Chen et al. 8 is more corresponding to the actual traffic situation than number solution, as it has considered the influence of traffic flow, thus gained better control result.
Comparison of indexes utilizing different optimization methods.

The method proposed in this article divides partitioned of the artery more systematically based on the study of Chen et al. 8 Then, this article puts forward the concept of sectional artery and takes the influence of artery cycle and intersection space on actual control effect of green wave into consideration, and then gets a better control results.
Conclusion
In this article, we take the bandwidth of partitioned artery into consideration while ensures the whole green wave bandwidth. By setting the weight of flow and space for the bandwidth of partitioned artery. The constraint condition of public cycle is determined by analyzing the relationship between cycle and delay. Then, we use the GA to make the designed green belt more suitable for actual traffic situation. Finally the example calculation, analysis and simulation indicate that this method do improve the effect of green wave control.
Footnotes
Academic Editor: Geert Wets
Declaration of Conflicting Interests
The author(s) declared no potential conflicts of interest with respect to the research, authorship, and/or publication of this article.
Funding
The author(s) disclosed receipt of the following financial support for the research, authorship, and/or publication of this article: National special needs - discipline construction project: PXM2015_014212_000023 National Natural Science Foundation of China under Grant: 61374191 Postgraduate training program: PXM2015_014212_000018 Research base construction project: PXM2015_014212_000019