
Abstract
Gas-path analysis method has been widespread applied to gas turbine engine health control and has become one of the key techniques in favor of condition-oriented maintenance strategy. Theoretically, gas-path analysis method (especially nonlinear gas-path analysis) can easily quantify gas-path component degradations. However, when the number of components within engine is large which highly expands the dimension of fault coefficient matrix, maybe leading to strong smearing effect (i.e. predicted degradations are located almost in all component health parameters, although some of them are not really degraded), the degraded components may not be accurately identified. In order to improve the robustness of gas turbine gas-path fault diagnosis, a hybrid gas-path analysis approach integrating gray relation algorithm into gas-path analysis method has been proposed in this study. The gray relation algorithm and gas-path analysis method approach includes two steps. First, the faulty components are recognized and isolated by gray relation algorithm, which deeply reduces the dimension of fault coefficient matrix, and second, the magnitudes of detected component faults are quantified by the gas-path analysis. The fault classification analyses and case studies have shown that the confidence level of the fault classification can reach more than 95%, when single and multiple components are degraded, and the predicted degradations are almost same as that of implanted fault patterns.
Introduction
Gas turbine engine always runs at poor working conditions with high-temperature, high-pressure, and high mechanical and thermal stress, and thus, the performance of its gas-path components degrades gradually, easily leading to various serious faults. Therefore, the current health status of the engine gas-path components is essential information for users and operators. During gas turbine operation, if a physical degraded problem happens, component performance parameters (e.g. mass flow rate, pressure ratio, and isentropic efficiency) are changing which can be represented by the shift of the characteristic curves on the component characteristic maps and such shift can be expressed by the component health parameters (e.g. compressor and turbine flow capacity indices and efficiency indices, and combustor efficiency index1–4) and cause the deviation of gas-path measurable parameters, such as temperatures, pressures, and shaft rotational speeds. 3 Therefore, gas-path analysis is an inversely mathematical problem to obtain the deviation of component performance parameters over gas-path measurements, and further obtain component health parameters. 5 The technique of gas-path analysis helps users to make a more accurate and detailed maintenance schedule to minimize shut down time, save maintenance costs, increase reliability, and availability.
Nowadays, many gas-path analysis methods have been proposed to assess gas turbine engine health status. From the linear gas-path analysis method (GPA) method developed by Urban 6 in the late 1960s, a series of GPAs were proposed, such as weighted-least-squares–based GPA, 7 filtering approaches,8,9 nonlinear GPA method, 1 artificial neural networks, 10 Bayesian networks,11,12 rough set frameworks 13 and rule-based fuzzy expert system,14,15 and genetic algorithm.16–18 For the merit of artificial intelligence methods, such as artificial neural networks, Bayesian networks, fuzzy expert system, only the rule base between fault signature and fault pattern is needed. However, the accumulation of knowledge by experiments and experience is costly and most case studies show that artificial intelligence methods may effectively isolate the faulty components but not easily quantify the gas-path component degradations.
The reason why GPA methods have been widely applied to monitor gas turbine engine health status is that GPA can easily quantify gas-path component degradations by thermodynamic performance model which relates gas-path measurements (e.g. temperatures, pressures, fuel flow rate, and shaft rotational speeds) with the fundamental component performance parameters (e.g. mass flow rate, pressure ratio, and isentropic efficiency). 19 However, when the number of components involved in fault diagnosis is large which highly expands the dimension of fault coefficient matrix, maybe leading to strong smearing effect, the degraded components may not be accurately identified.
In this study, a new diagnostic approach has been proposed in order to effectively isolate the degraded components and accurately quantify the fault degradations with a hybrid of gray relation algorithm and gas-path analysis method (GRA-GPA). The GRA-GPA approach includes two steps. First, the faulty components are recognized and isolated by GRA which deeply reduces the dimension of fault coefficient matrix, and second, the magnitudes of detected component faults are quantified by the GPA.
Methodology
The overall health status of a gas turbine engine normally is represented by component health parameters such as compressor and turbine flow capacity indices and efficiency indices and combustor efficiency index, which virtually represent a shift of the characteristic curves on component characteristic maps due to degradations.1–5 However, these important performance and health status information cannot be directly measured and therefore do not be easily monitored. During gas turbine operations, the deviation of component performance parameters can be indicated by the deviation of gas-path measurements and such a deviation may be due to varying ambient conditions or/and operating conditions or/and engine component degradations. 5 The thermodynamic relationship between component gas-path measurements and component performance parameters can be expressed in equation (1)

where
Gas turbine gas-path fault diagnosis is an inversely mathematical problem to obtain the deviation of component performance parameters

where
And then a typical fault diagnostic procedure for nonlinear GPA method can be shown in Figure 1.

A typical diagnostic procedure of nonlinear GPA method.
Here

Simplified illustration of the typical nonlinear GPA method.
Theoretically good component degradation predictions can be easily obtained based on correct measurement information. However, when the number of components within engine is large which highly expands the dimension of fault coefficient matrix, maybe leading to strong smearing effect, the degraded components may not be accurately identified.
Proposed algorithm
Component health parameter
When the level of degradation is small, it is always assumed that the characteristic maps of degraded components (i.e. compressors, combustors, and turbines) will keep more or less the same shape as their original ones based on the fact that the geometries of gas-path components do not change significantly after degradation. And then the degradation of gas-path components can be represented by the shift of the characteristic curves on the maps and such shift can be expressed by the component health parameters, such as compressor and turbine flow capacity indices, efficiency indices, and combustor efficiency index. 1
The health parameters for gas-path components can be defined using component similar corrected parameters (e.g. corrected mass flow rate
Compressor health parameters
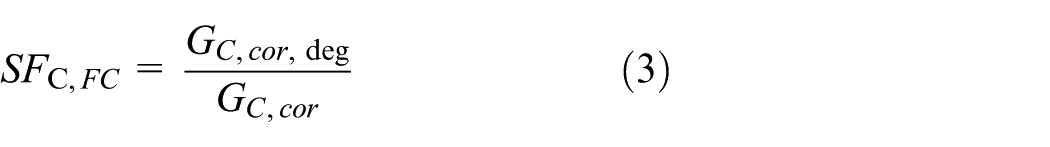


where
When a physical degraded problem of compressor happens, the compressor performance parameters are changing which can be represented by the shift of the characteristic curves on the compressor characteristic maps and such shift can be expressed by the compressor health parameters as described in equations (4) and (6). Therefore, the performance characteristics of actual compressor can be presented as follows


Combustor health parameter
Combustor degradation can be represented with the degradation of combustor combustion efficiency


where
The performance characteristics of actual combustor can be expressed as follows

where load is engine load power.
Turbine health parameters
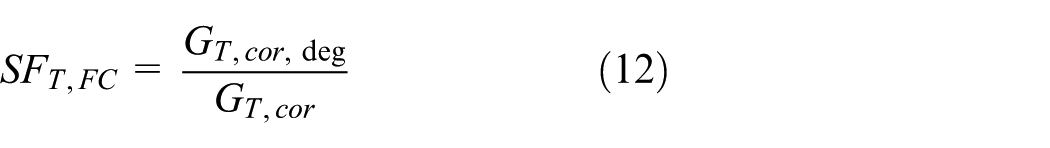
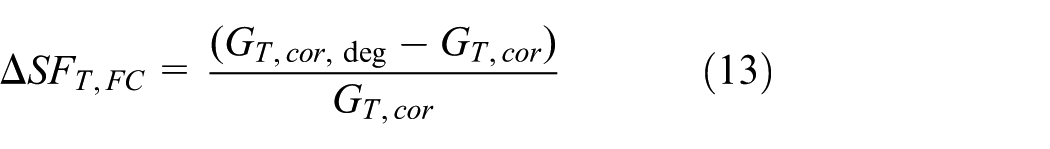


Like compressor, the performance characteristics of actual turbine can be presented as follows


where
More detailed information about gas turbine performance modeling were described in Ying et al. 20 and Larsson et al. 21
Degraded component isolation
The research of gray relation theory is the foundation of gray system theory, mainly based on the basic theory of space mathematics, to calculate relation coefficient and relation degree between reference characteristic vector and each comparative characteristic vector. Gray relation theory has a good potential to be used in gas turbine fault classification with two features. One is that it has good tolerance to measurement noise and the other is that it has the ability to assist the selection of characteristic parameters for classification.
Gray relation algorithm
Gas turbine gas-path fault diagnosis is an inversely mathematical problem to obtain the component health parameters
Suppose the sequence of gas turbine gas-path measurements to be classified is as follows

where
Suppose the knowledge base between fault signatures (i.e. gas-path measurements) and fault patterns (i.e. the classification of faulty components) is as follows
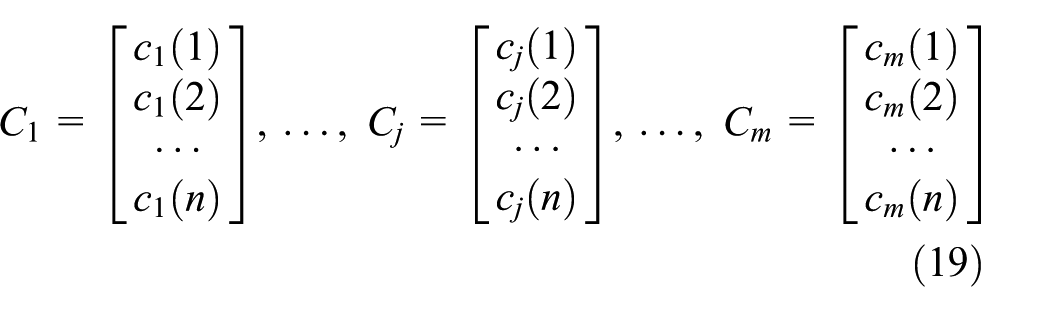
where
For


where
And then
Adaptive gray relation algorithm
In order to enhance its tolerance to measurement noise and the ability to assist the selection of characteristic values for fault classification, the information theory was introduced into the calculation of the relation degree and that is so-called adaptive gray relation algorithm. 22
First calculate the distance of characteristic parameter

where m is the total number of the known fault patterns in the rule base.
Define the entropy value as follows
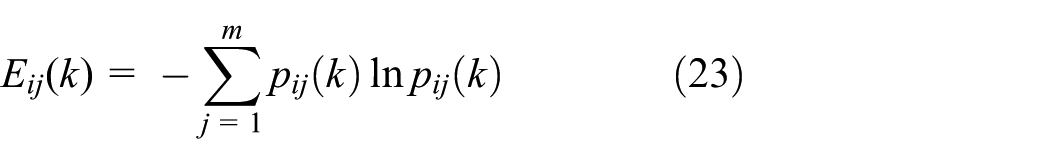
And the maximum entropy value is as follows

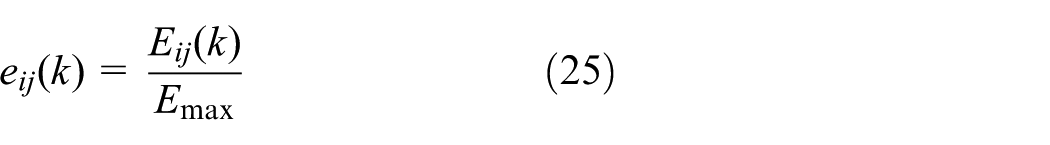
Then the relative entropy value is obtained as follows
Referred to the concept of surplus degree in information theory, the definition of surplus degree for kth characteristic parameter is as follows

The essential meaning of surplus degree is to remove the difference between the entropy value of the kth characteristic parameter and the optimal entropy value of characteristic parameter. The bigger
Finally, calculate the weight coefficient

where
Then obtain relation degree by weight coefficient multiplying with the corresponding relation coefficient as follows

And finally,
Component degradation quantification
After degraded components are isolated, a subset

A typical procedure for component degradation quantification.
Diagnostic procedure
As illustrated in sections “Degraded component isolation” and “Component degradation quantification,” The GRA-GPA approach includes two steps. First, the faulty components are recognized and isolated by GRA which deeply reduces the dimension of fault coefficient matrix, and second, the magnitudes of detected component faults are quantified by the GPA. And the diagnostic procedure of GRA-GPA approach is shown in Figure 4.

Diagnostic procedure of GRA-GPA approach.
Application and analysis
The target engine chosen for demonstration of effectiveness of the GRA-GPA approach is a three-shaft gas turbine used in marine integrated power system and its configuration is shown in Figure 5.

Illustration of the three-shaft gas turbine.
The three-shaft gas turbine contains two compressors (i.e. low-pressure compressor (LPC) and high-pressure compressor (HPC)), a combustor (B), three turbines (i.e. high-pressure turbine (HPT), low-pressure turbine (LPT), and power turbine (PT)), and the generator is connected to the power turbine (PT) by a reduction gear box. LPC consumes the power output of LPT by a low-pressure shaft to condense air from intake duct, and HPC consumes the power output by a high-pressure shaft to further condense air from LPC. Then the high-pressure air enters B together with fuel supply and the combustion product enters HPT, LPT, and PT sequently to drive turbines to produce power. Eventually, the power output of PT drives the generator to produce electric power output. The cooling air extracted from compressors flows to hot gas path to cool turbine front vanes and blades meanwhile. When the engine runs at a certain operating condition, the generator electric power output and PT rotational speed as the key control parameter are kept constant.
The engine performance model for the three-shaft gas turbine was created based on the simulation platform of MATLAB software. The engine gas-path instrumentation set for the gas-path analysis of the model engine is shown in Table 1.
Engine gas-path instrumentation set.

LPC: low-pressure compressor; HPC: high-pressure compressor; HPT: high-pressure turbine; LPT: low-pressure turbine; PT: power turbine.
The total uncertainty for each measurement has two components: systematic uncertainty and random uncertainty. Systematic uncertainty is a constant value despite repeated measurements and can be reduced by increasing the quality of instruments. Random uncertainty can be reduced by increasing the quantity of instruments used to measure a given parameter and by increasing the quantity of readings taken. Here, it is assumed that all gas-path sensors are healthy, that is, no measurement bias.
To test the effectiveness of the approach, it is assumed that the compressors (LPC and HPC), the combustor (B), and the turbines (HPT, LPT, and PT) of the model engine may be degraded, and single, dual, or triple components may be degraded meanwhile on the basis that single component fault is most common during actual engine operations. The degradation of the engine is simulated by changing the component health parameters
Implanted major gas-path component degradations (%).

LPC: low-pressure compressor; HPC: high-pressure compressor; HPT: high-pressure turbine; LPT: low-pressure turbine; PT: power turbine.
Here, cases 1–5 are used to test the effectiveness of the approach in isolating a degraded component and quantifying the degradation when only one component is degraded, and cases 6–10 are used to test the effectiveness of the approach when multiple components are degraded simultaneously.
Fault classification analysis
The capability of the approach is mainly dependent on the confidence level of degraded component isolation. In order to effectively recognize the degraded components, the measurement parameters
Sensitivity analysis (t0 = 15°C, P0 = 1.013 bar, RH = 60%, and Ne = 24265 kW).
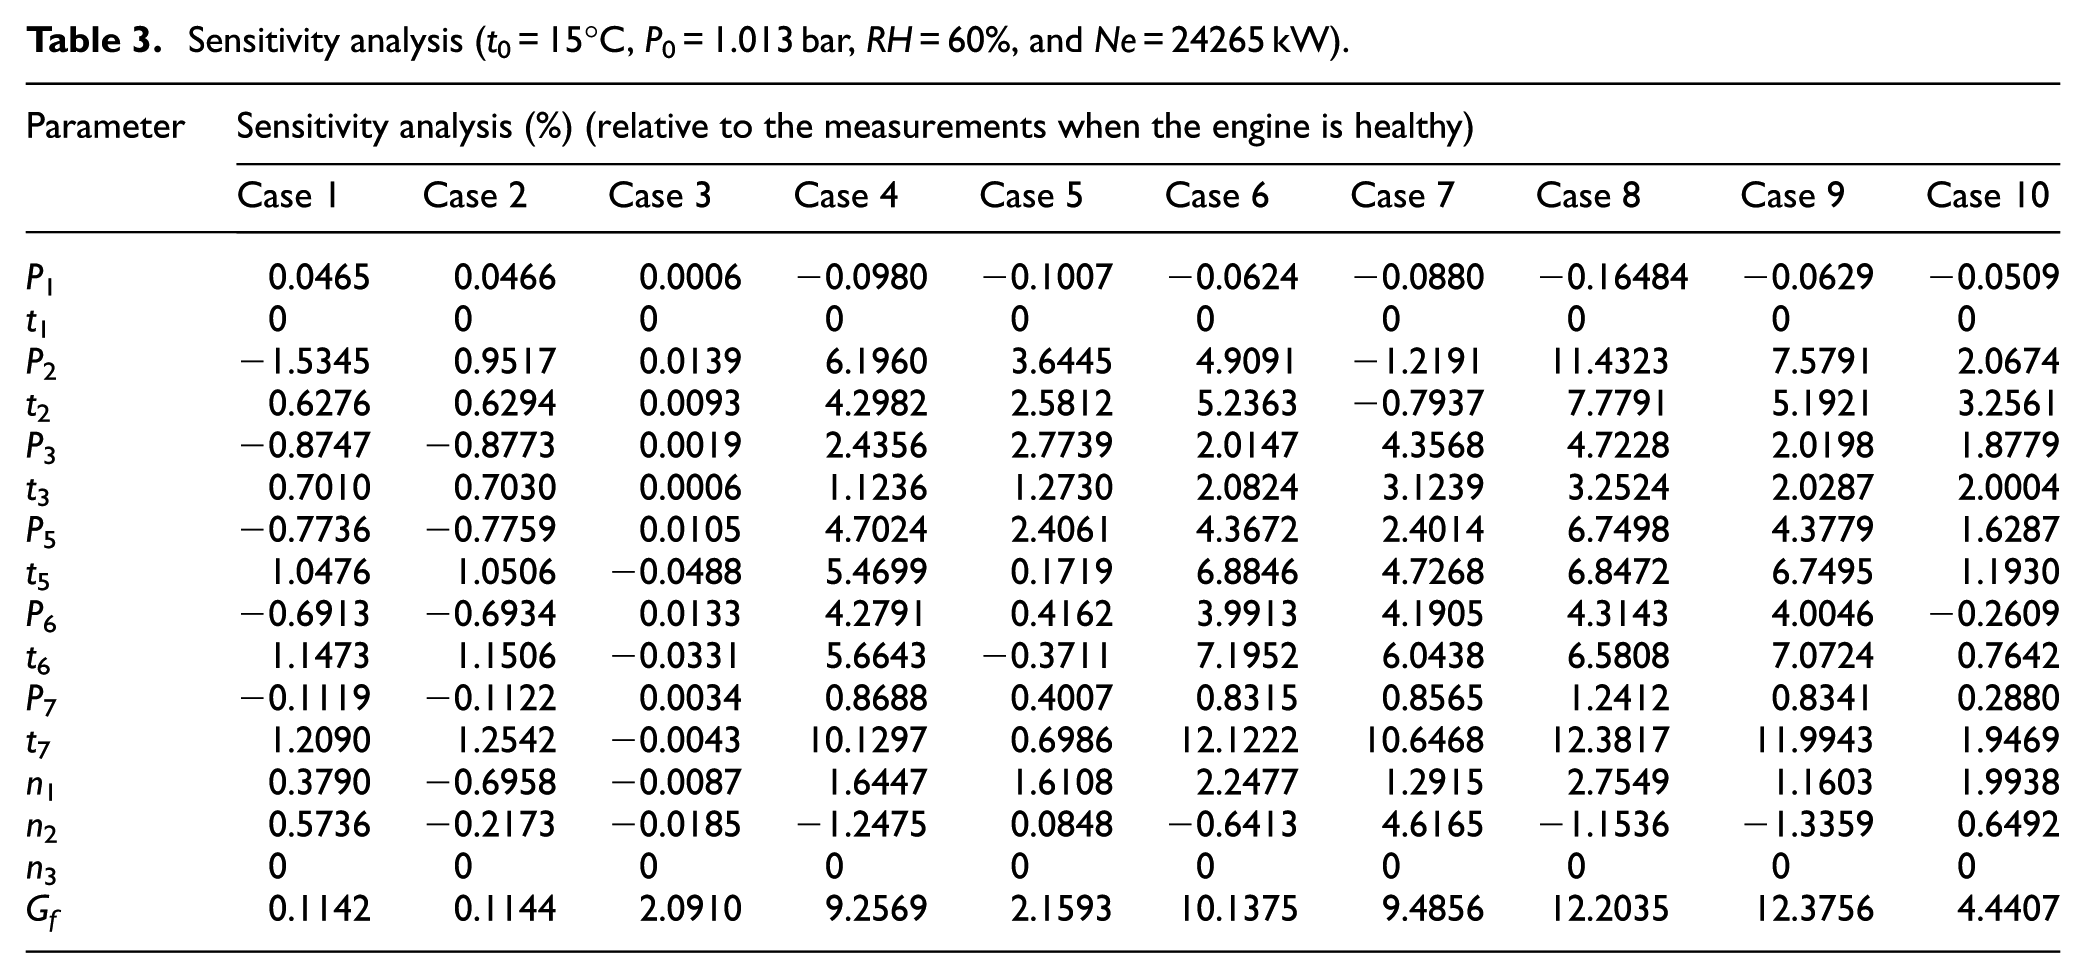
Table 3 shows that different degradation cases (i.e. different fault patterns) cause various fault signatures shown by gas-path measurements. And the characteristic vector chosen for degraded component isolation can be represented as

According to Diakunchak’s experimental results, the common degradations are shown in Table 4, and the range of component degradations considered in this study is also shown in Table 4.
Range of component degradation.
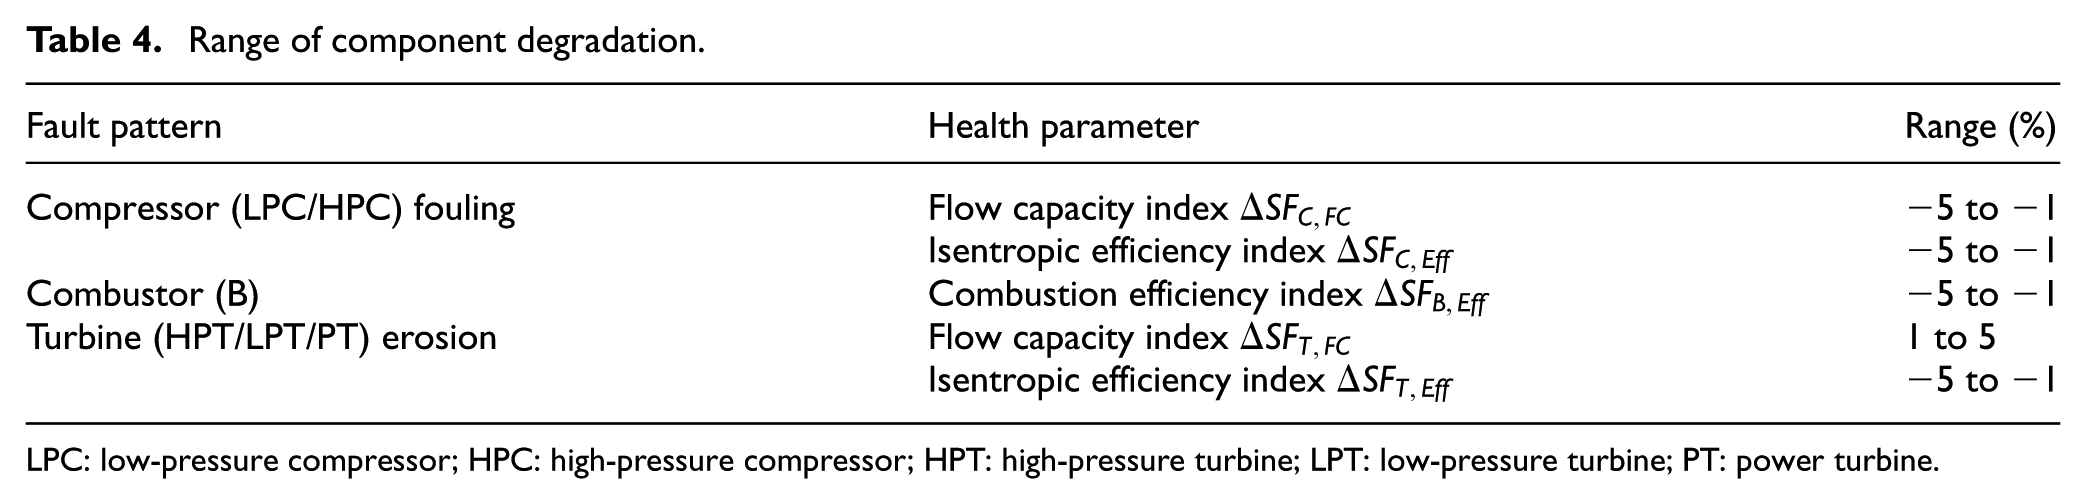
LPC: low-pressure compressor; HPC: high-pressure compressor; HPT: high-pressure turbine; LPT: low-pressure turbine; PT: power turbine.
Nowadays, thermodynamic performance models of faulty engine are widely used to explore the symptom–fault relationship.11,13 Here, the three-shaft gas turbine performance model was used to accumulate the knowledge base between fault signature (i.e. gas-path measurements) and fault patterns by implanting degradations, as shown in Table 4. Fault samples for knowledge base and for validation of each component are shown in Figures 6–8 and assume that only single, dual, or triple components may be degraded meanwhile. And thus, the total number of samples for rule generation is 3260 and 7681 for validation. The corresponding recognition result of faulty components is shown in Table 6.

Fault sample selection for compressor (LPC/HPC).

Fault sample selection for combustor.

Fault sample selection for turbine (HPT/LPT/PT).
In order to analyze the effect of the density of fault samples for rule generation on the successful recognition rate, additional fault samples for rule generation are also used, and then the total number of samples for rule generation is 9695. The corresponding recognition result of faulty components is shown in Table 7.
As measurement noise is inevitable in actual gas-path measurements and can produce a side effect on diagnosis, measurement noise is introduced in the simulated gas-path measurements to make the analysis more realistic. The maximum measurement noise for different gas-path measurements is according to the information provided by Dyson and Doel, 24 as shown in Table 5.
Maximum measurement noise.

To reduce the side effect of measurement noise on diagnostic analysis, multiple gas-path measurement samples are obtained in the simulation and a 10-point rolling average 2 was used to obtain an averaged measurement sample before the measurements are input to the GRA-GPA system. The mathematical expression for the rolling averaging is shown in equation (30)
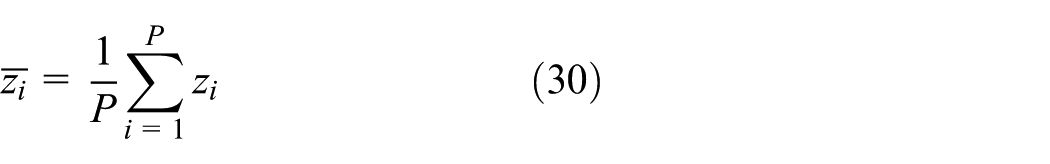
where
From Tables 6 and 7, it shows that the density of fault samples for rule generation can produce a certain influence on the success rate for recognizing and isolating degraded components, and adaptive GRA with additional samples for knowledge base is most suitable for degraded component isolation for this target engine.
Fault classification analysis.
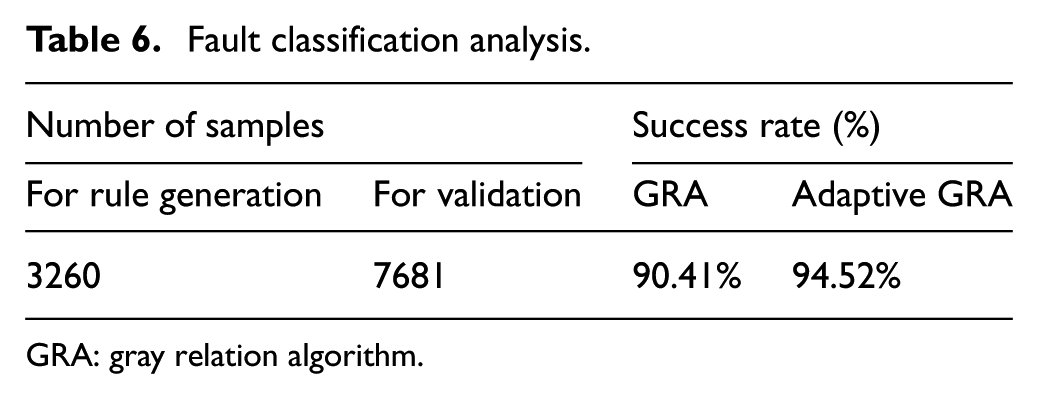
GRA: gray relation algorithm.
Fault classification analysis with additional fault samples for rule generation.

GRA: gray relation algorithm.
Case studies
To further test the effectiveness of the approach, these sets of the gas-path measurements simulated by implanting degradation cases shown in Table 2 are input to the GRA-GPA system, assuming that the degradations of the compressors, the turbines, and the combustor are unknown. In this study, the simulated engine performance by implanting various engine component degradations is called “actual performance” and the predicted engine performance by GRA-GPA approach based on gas-path measurements is called “predicted performance.”
Diagnostic results for cases 1–5
From Figures 9–13, it can be seen that due to the existence of gas-path measurement noise and a large number of components within engine, the smearing effect appears and some misleading degradations have been predicted by the typical GPA, while the degraded component is effectively isolated and the degradation is accurately quantified by GRA-GPA when only single component is really degraded.

Diagnostic results for case 1.

Diagnostic result for case 2.
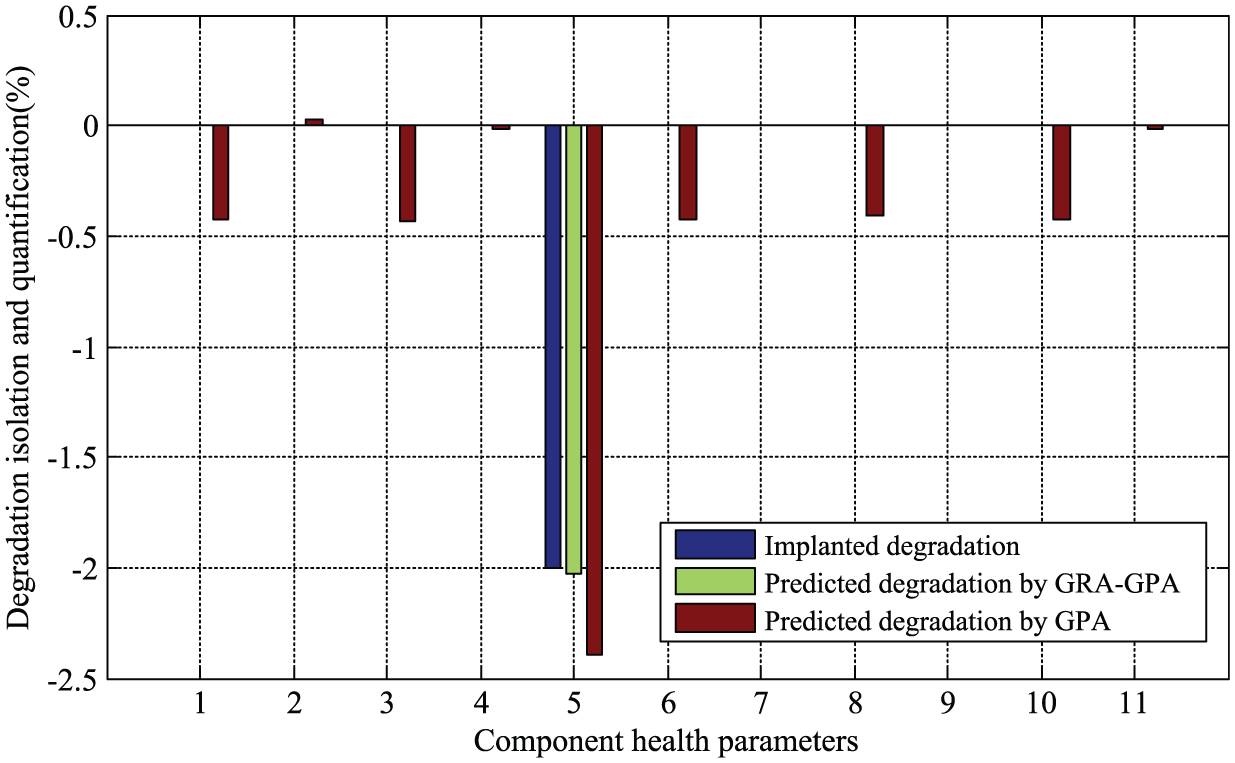
Diagnostic result for case 3.

Diagnostic result for case 4.

Diagnostic result for case 5.
Diagnostic results for cases 6–10
As there are a great deal of combining modes of dual and triple component fault patterns, here only two test cases are chosen for dual component fault patterns and three test cases are chosen for triple component fault pattern to test the effectiveness of the approach. From Figures 14–18, it can be seen that when multiple gas-path components are degraded, the real degraded components can still be effectively and accurately isolated by GRA-GPA and the predicted degradations are almost same as the implanted ones. However, the predicted degradations made by the typical GPA may not be acceptable.

Diagnostic result for case 6.
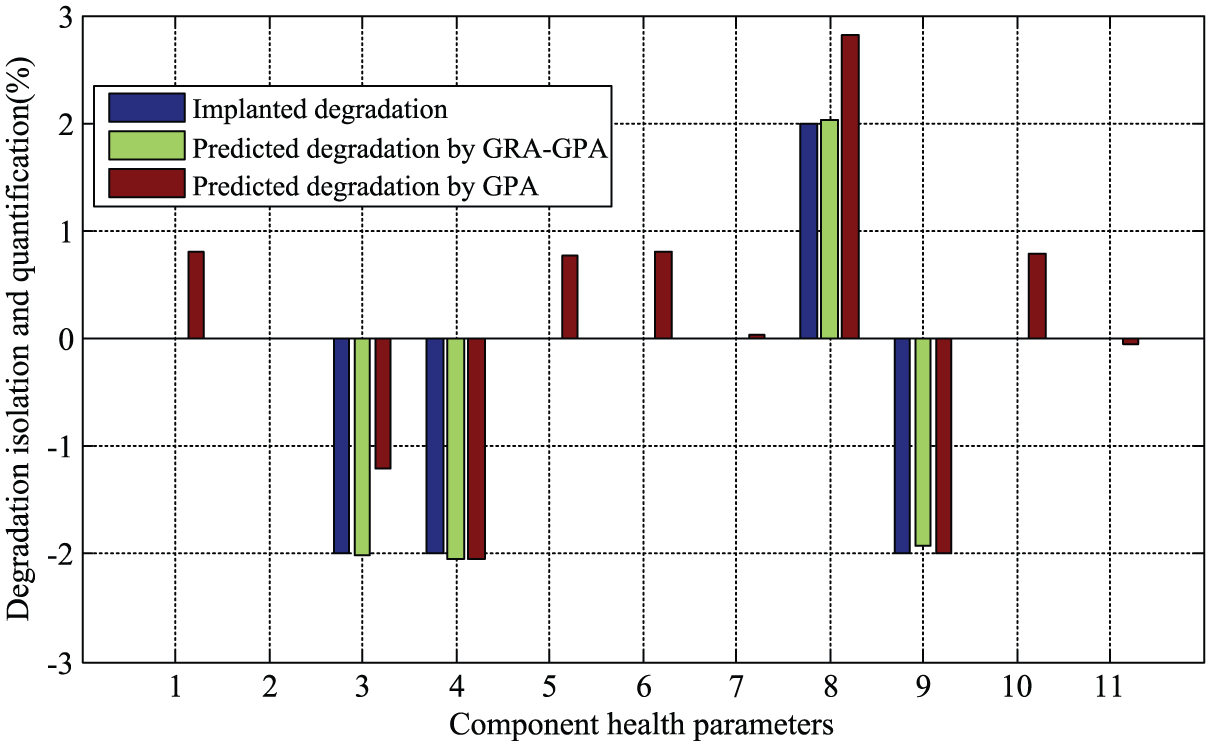
Diagnostic result for case 7.

Diagnostic results for case 8.

Diagnostic results for case 9.

Diagnostic results for case 10.
Conclusion and discussion
In this study, in order to improve the robustness of gas turbine gas-path fault diagnosis, a hybrid GPA approach (GRA-GPA) integrating gray relation algorithm (GRA) into GPA method has been proposed to isolate and quantify gas-path component degradations. The fault classification analyses and diagnostic case studies have been made, and the corresponding conclusions are as follows:
The density of fault samples for rule generation can produce a certain influence on the success rate for recognizing and isolating degraded components, and adaptive GRA with additional samples for knowledge base is most suitable for degraded component isolation for this target engine.
Due to the existence of gas-path measurement noise and a large number of components within engine, the smearing effect appears and some misleading degradations have been predicted by the typical GPA, while the degraded component is effectively isolated and the related degradation is accurately quantified by GRA-GPA when only single component is really degraded.
When multiple gas-path components are degraded, the real degraded components can still be effectively and accurately isolated by GRA-GPA and the predicted degradations are almost same as the implanted ones when multiple components are really degraded. However, the predicted degradation made by the typical GPA may not be acceptable.
Footnotes
Appendix 1
Academic Editor: Ramanarayanan Balachandran
Declaration of conflicting interests
The author(s) declared no potential conflicts of interest with respect to the research, authorship, and/or publication of this article.
Funding
The author(s) disclosed receipt of the following financial support for the research, authorship, and/or publication of this article: This research is supported by the Fundamental Research Funds for the Central Universities (HEUCFZ1005).