
Abstract
A composite ultrasonic process is used to extract five constituent components of green tea, namely caffeine, catechin, epigallocatechin gallate, epicatechin, and chlorogenic acid. The optimal parameters of the extraction process are determined using the robust Taguchi design method. The extracted products are analyzed using gas chromatography and high-performance liquid chromatography. The experimental results confirm the effectiveness of the proposed ultrasonic technique in extracting the components of interest. Moreover, it is shown that the optimal extraction parameters depend on the particular component. In general, the present findings provide a useful reference for further research on the processing of green tea.
Introduction
Ultrasonic vibration is characterized by a high frequency and power, a strong penetrating power, and good directionality. As a result, it is a highly effective medium spreading process and has extensive applications in the food processing and storage fields. 1 Natural plant constituents are mostly intracellular products. Thus, in extracting these constituents, effective methods for breaking the cell walls are required. However, obtaining an ideal breaking effect using existing mechanical or chemical processes is extremely challenging.2,3 By contrast, ultrasonic extraction techniques enhance the cell wall breakage effect and promote the uniform permeation of the solvent into the cells. 4 As a result, the extraction efficiency and extraction time are significantly better than those of traditional methods.5,6 Notably, the separation process can be strengthened without damaging the extract structure provided that the input energy is appropriately controlled. 7
In extracting the active constituents of plants using ultrasonic techniques, the frequency can be set in the operating range of 20–40 kHz. However, in their investigation into the ultrasonic treatment of marigold petals, Toma et al. 8 found that a frequency of 20 kHz resulted in a complete disruption of the secreted threads and therefore enabled a more rapid dissolution of the active constituents in the solvent. Wu et al. 9 showed that the ultrasonic extraction time of ginsenoside is around three times shorter than that of the Soxhlet extraction method. In other words, ultrasonic techniques provide a highly effective approach for purifying and recovering vegetable and plant materials.
Green tea is loaded with antioxidants and nutrients, and therefore has many important health benefits, including fat loss, an improved brain function, and a reduced cancer risk. The problem of developing effective methods for extracting the active components of green tea has therefore attracted significant interest in the health and nutrition fields in recent years.10–13 In the present study, the extraction process is performed using a composite ultrasonic system consisting of an ultrasonic extraction module and a homogenizing device for further shearing the raw materials. Notably, the proposed system improves the extraction efficiency, shortens the extraction time, and minimizes the risk of thermal damage to the active constituents. The system is used to extract five essential components of green tea, namely caffeine, catechin, epigallocatechin gallate (EGCG), epicatechin (EC), and chlorogenic acid, respectively. For each component, the optimal parameters of the extraction process are determined using the Taguchi design method. 14 In every case, the extracted product is analyzed using gas chromatography (GC) and high-performance liquid chromatography (HPLC).
Experimental method
Experimental materials and instruments
The extraction experiments were performed using unfermented green tea purchased from Mingjian Township, Nantou County in central Taiwan. The composite ultrasonic system consisted of a pulverization module for smash green tea, a sieve vibration module for filtering impurities, a homogenizing device, and an ultrasonic generating module. After extracting five essential components of green tea including caffeine, catechin, EGCG, EC, and chlorogenic acid by the composite ultrasonic system, the GC and HPLC are used to detect the concentration values for each component and the results can be analyzed for optimization design.
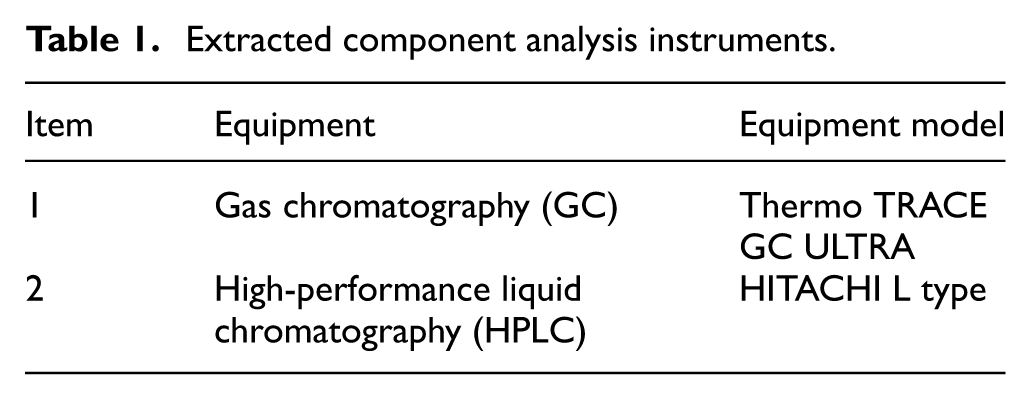
The details of the GC and HPLC apparatus used to analyze the extracted components are shown in Table 1.
Extracted component analysis instruments.
Experimental method
In this study, the optimal parameter settings for the ultrasonic extraction process were determined using the Taguchi design method.15–17 In the Taguchi approach, the control factors and level settings are arranged in the form of an orthogonal array (OA) so as to minimize the total number of experiments required to establish the optimal processing conditions (i.e. the parameter settings which maximize the robustness of the process output to variations in the external noise). In establishing the optimal extraction process, the experiments considered four different control factors, namely the green tea pulverization time, the extraction temperature, the soaking time, and the ultrasonic oscillating extraction time. As shown in Table 2, each control factor was assigned three different level settings. Thus, the Taguchi trials were configured in a three-level L9(34) OA (see Table 3).18–20
Control factors and level settings for ultrasonic extraction of green tea.

Orthogonal array L9(34).

In the Taguchi design method, the optimal control factor level settings are determined using a statistical approach based on the mean value and standard deviation of the process outcome for each run in the OA. Moreover, the quality of the outcome obtained using each control factor/level setting is evaluated using a signal-to-noise (S/N) metric. In practice, various S/N ratios are applicable, depending on the particular performance response required. The most commonly used S/N ratios include smaller-the-better (where the aim is to make the system response as small as possible), nominal-is-best (where the aim is to reduce the variability of the system response around a target), and larger-the-better (where the aim is to make the system response as large as possible).
The mean response

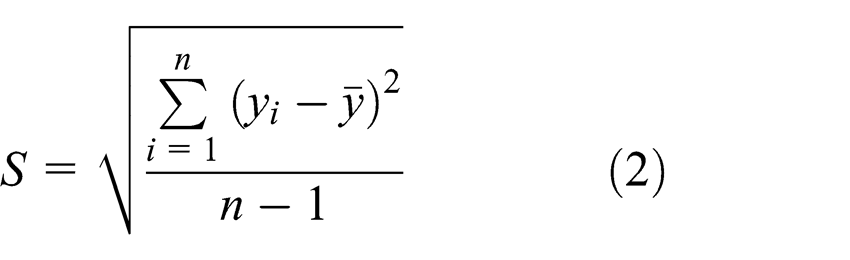
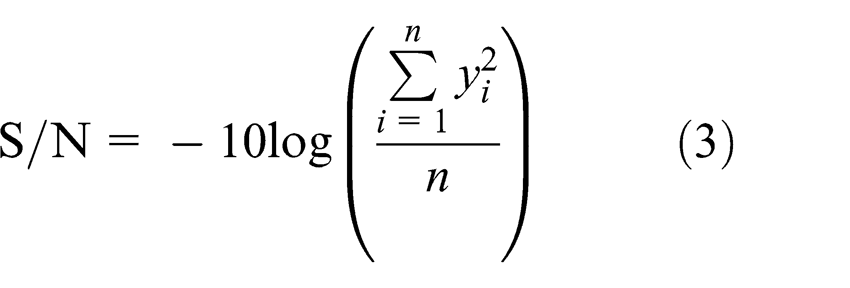
where n is the number of measured values. In this study, two S/N ratios are applicable, namely smaller-the-better (for the caffeine product) and larger-the-better (for the remaining products). The two ratios are shown mathematically in equations (3) and (4), respectively:
Smaller-the-better
Larger-the-better

In the Taguchi approach, the interaction among the control factors is regarded as part of the experimental error. Thus, the error can also be used to evaluate whether a factorial effect is meaningful or not. Let DOFT and SST denote the degree of freedom (DOF) and square sum (SS) of the total variation vector, respectively. In addition, let DOFA and SSA be the DOF and SS of the effect vector of Factor A, respectively. Finally, let DOFe and SSe be the DOF and SS of the error vector, respectively. The corresponding equations for the various DOF and SS notations are given in the following:
Total variation vector


Factorial effect vector


Error vector


Experimental process
In performing the Taguchi trials, the experimental parameters were set in accordance with the values shown in Table 2. Each test was performed using 25 g of green tea and 2600 mL of reverse osmosis (RO) water. In addition, the oscillation frequency and ultrasonic power were set as 28 kHz and 200 W in every case. The details of the experimental procedure are shown schematically in Figure 1 and are described in the following:
Step 1. The green tea was ground in the pulverization module and then filtered through a #40 mesh screen.
Step 2. The RO water was poured into a 3000-mL plastic measuring cup. The filtered tea powder was added to the cup, and the cup was then placed in the tank of the ultrasonic extraction system.
Step 3. Ultrasonic oscillation was performed to extract the effective components of the green tea sample.
Step 4. The oscillated sample (RO water plus green tea extract) was collected in a plastic bottle. The experimental number, processing conditions, and date of the extraction process were marked on the bottle. Finally, the sample was stored in a refrigerator.
Step 5. The extraction liquids obtained under the different conditions were loaded into test tubes for HPLC and GC analyses.
Step 6. The standards of caffeine and anti-oxidation substance were applied by HPLC and GC to detect the extracted product concentration and then determine the optimal processing conditions for each component.

Experimental process and procedure.
Results and discussion
Optimal extraction process for caffeine
Caffeine stimulates the central nervous system, and should therefore be consumed only in carefully controlled quantities so as to minimize potential adverse effects such as insomnia, dizziness, abnormal heart rhythms, and so on. In performing the extraction process, it is therefore desirable to minimize the amount of caffeine. Accordingly, the quality of the response given different values of the control factor level settings should be evaluated using the smaller-the-better S/N ratio given in equation (3). Table 4 shows the caffeine extraction results (P1 and P2) obtained in two repeated runs of each experiment in the OA. The mean response, standard deviation, and S/N ratio are also given for each set of processing conditions.
Experimental results for caffeine extraction.
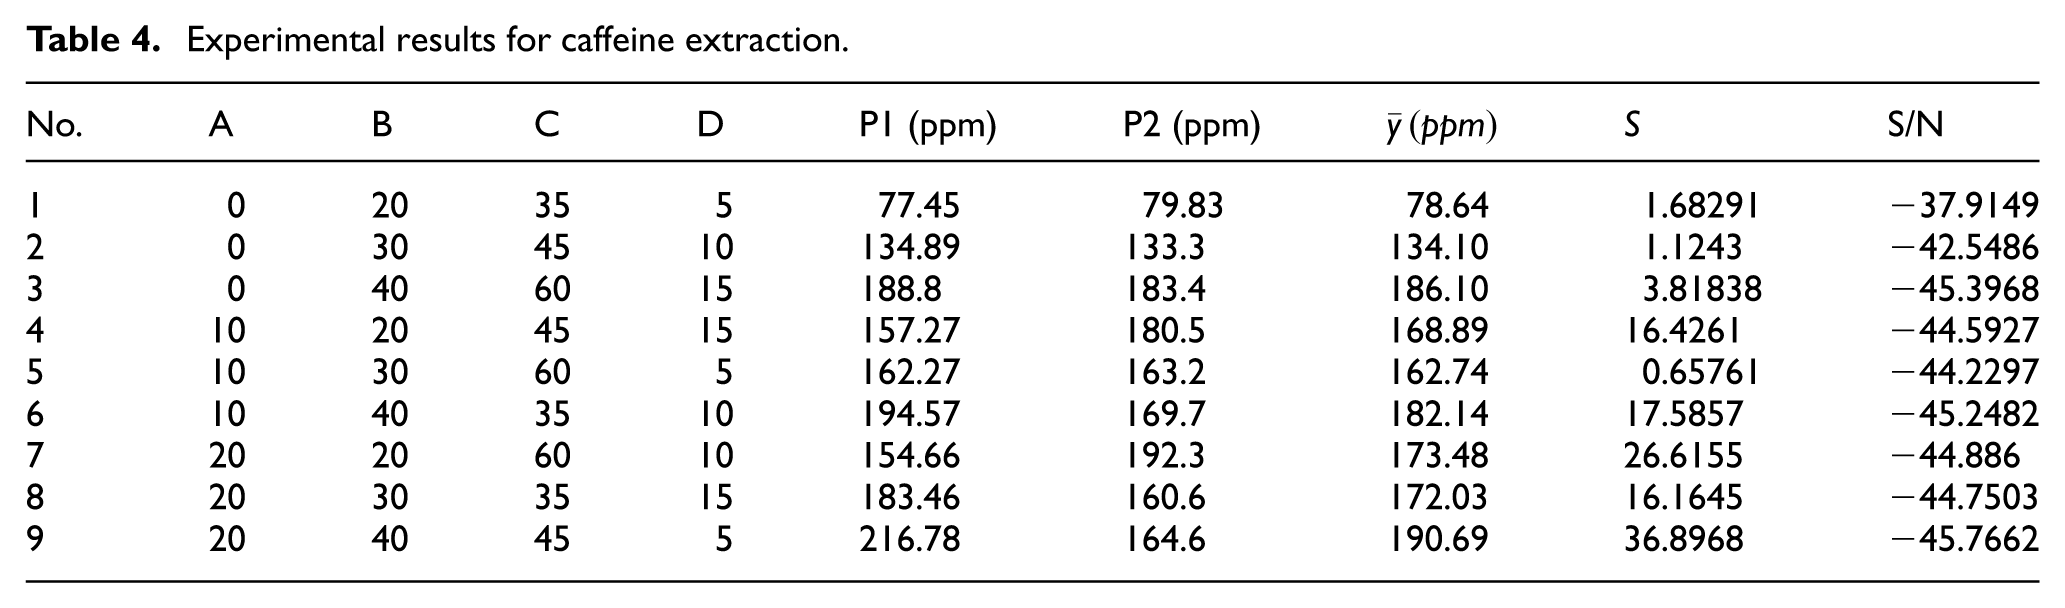
Table 5 shows the factor response table for the caffeine extraction process. Note that the values of A1, B1, C1, and D1 are the averaged sums of the mean values
Factor effects for caffeine extraction.

ANOVA results for caffeine extraction.
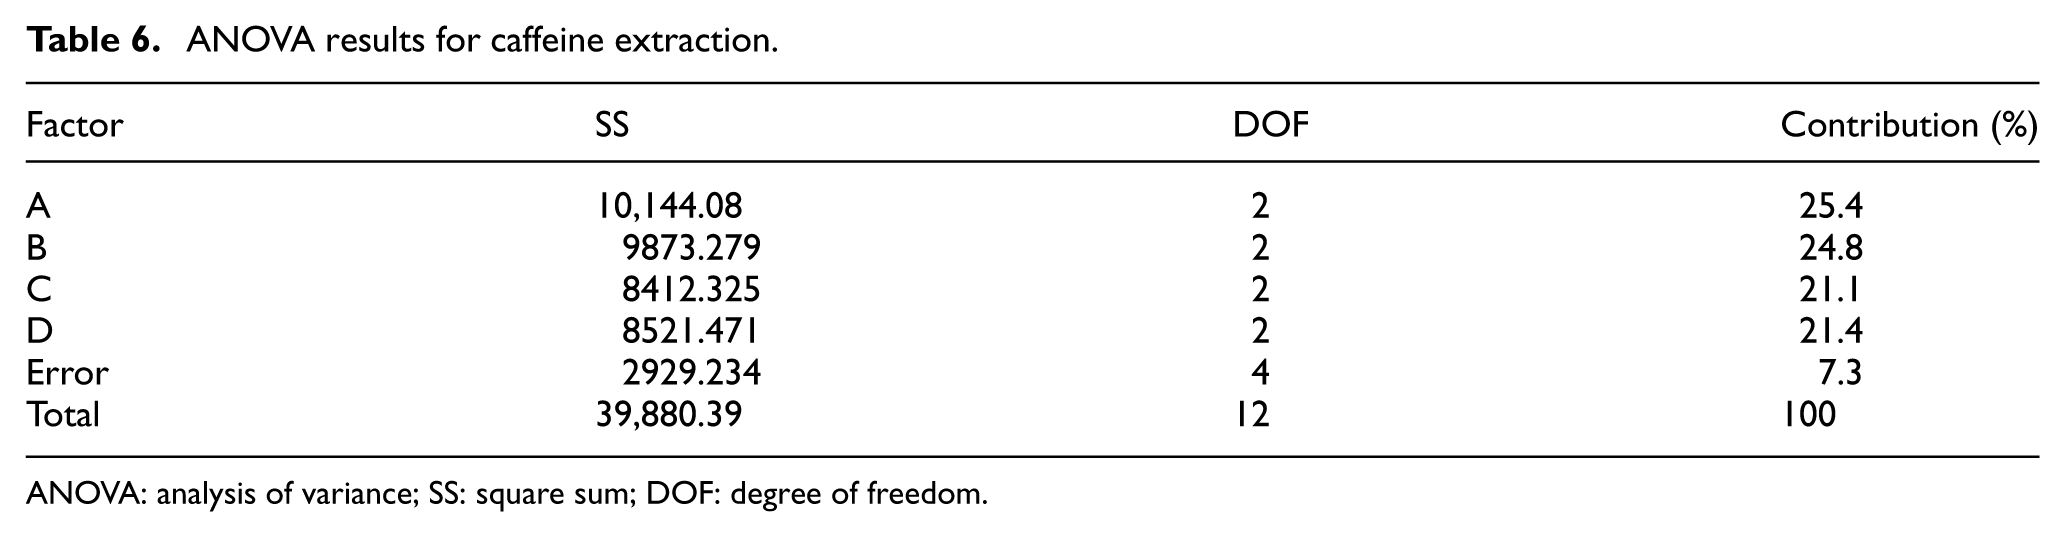
ANOVA: analysis of variance; SS: square sum; DOF: degree of freedom.
Optimal extraction process for catechin
Catechin is a powerful anti-oxidation substance. Thus, in designing the extraction process, the aim is to maximize the concentration of the extracted product. Thus, the quality characteristic is evaluated using the larger-the-better S/N ratio given in equation (4). Table 7 presents the experimental results obtained for the mean catechin concentration, standard deviation, and S/N ratio in each experimental run in the OA. Tables 8 and 9 present the corresponding factor effects and ANOVA results. Table 8 shows that the optimal parameter settings for catechin extraction are as follows: A2 Pulverization Time: 10 s; B2 Extraction Temperature: 30°C; C2 Soak Time: 45 min; and D3 Oscillating Extraction Time: 15 min. Moreover, Table 9 shows that the Pulverization Time has the greatest effect on the extracted catechin concentration, while the Oscillating Extraction Time has the least effect.
Experimental results for catechin extraction.

Factor effects for catechin extraction.

ANOVA results for catechin extraction.

ANOVA: analysis of variance; SS: square sum; DOF: degree of freedom.
Optimal extraction process for EGCG
EGCG is also a powerful anti-oxidation substance. Hence, in optimizing the extraction process, the aim is again to maximize the concentration of the extracted product. The corresponding experimental and statistical results are presented in Tables 10–12. As shown in Table 11, the optimal parameter settings for EGCG extraction are as follows: A2 Pulverization Time: 10 s; B3 Extraction Temperature: 40°C; C1 Soak Time: 35 min; and D2 Oscillating Extraction Time: 10 min. Moreover, from Table 12, the Extraction Temperature has the greatest effect on the extracted EGCG concentration, while the Pulverization Time has the least effect.
Experimental results for EGCG extraction.

EGCG: epigallocatechin gallate.
Factor effects for EGCG extraction.

EGCG: epigallocatechin gallate.
ANOVA results for EGCG extraction.
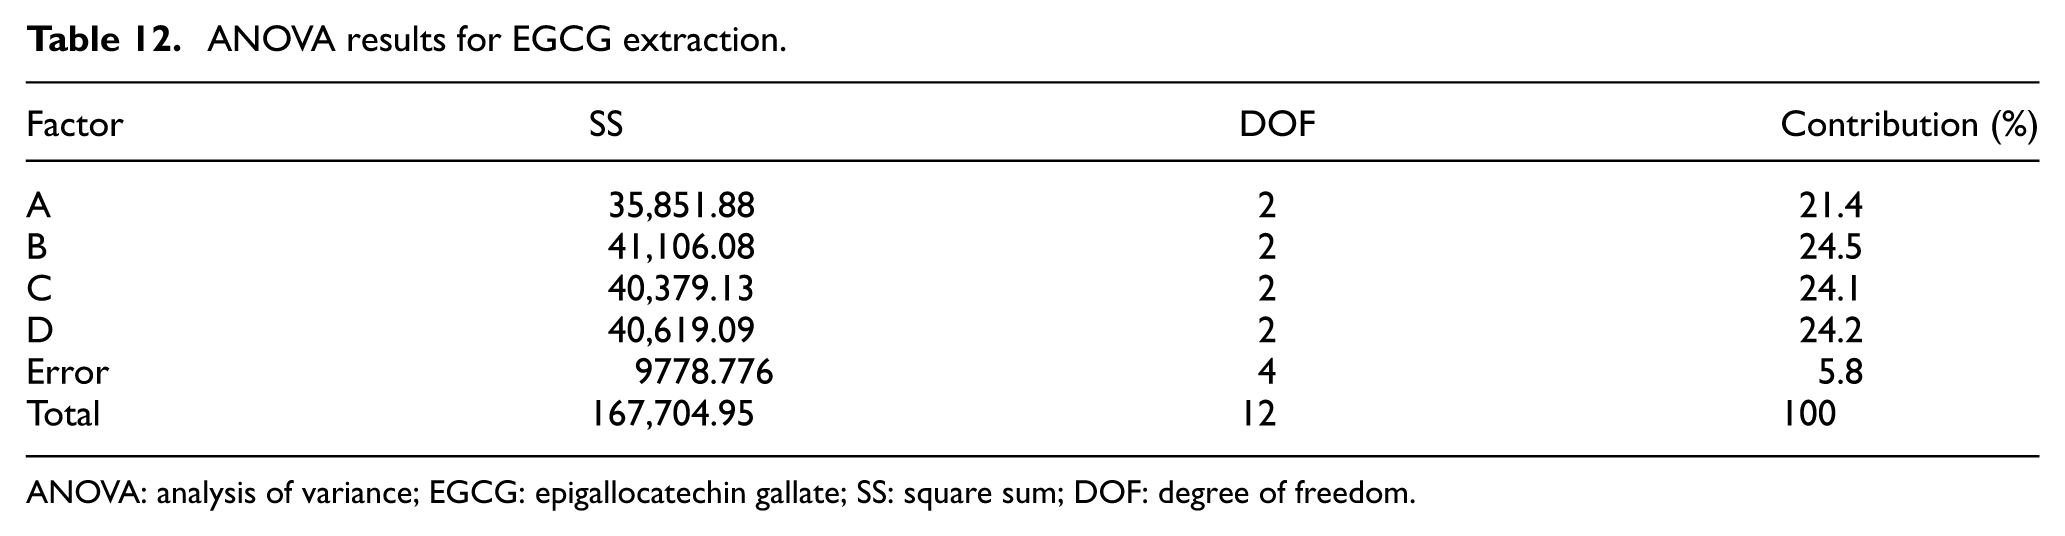
ANOVA: analysis of variance; EGCG: epigallocatechin gallate; SS: square sum; DOF: degree of freedom.
Optimal extraction process for EC
EC has many beneficial effects for the human body. Thus, the extraction parameters should be designed in such a way as to maximize the concentration of the extracted product. The Taguchi experimental results and statistical analyses are presented in Tables 13–15. The results presented in Table 14 show that the optimal parameters for EC extraction are as follows: A3 Pulverization Time: 20 s; B3 Extraction Temperature: 40°C; C3 Soak Time: 60 min; and D3 Oscillating Extraction Time: 15 min. In addition, Table 15 indicates that the extracted EC concentration depends equally on all four parameters.
Experimental results for EC extraction.

EC: epicatechin.
Factor effects for EC extraction.

EC: epicatechin.
ANOVA results for EC extraction.

ANOVA: analysis of variance; EC: epicatechin; SS: square sum; DOF: degree of freedom.
Optimal extraction process for chlorogenic acid
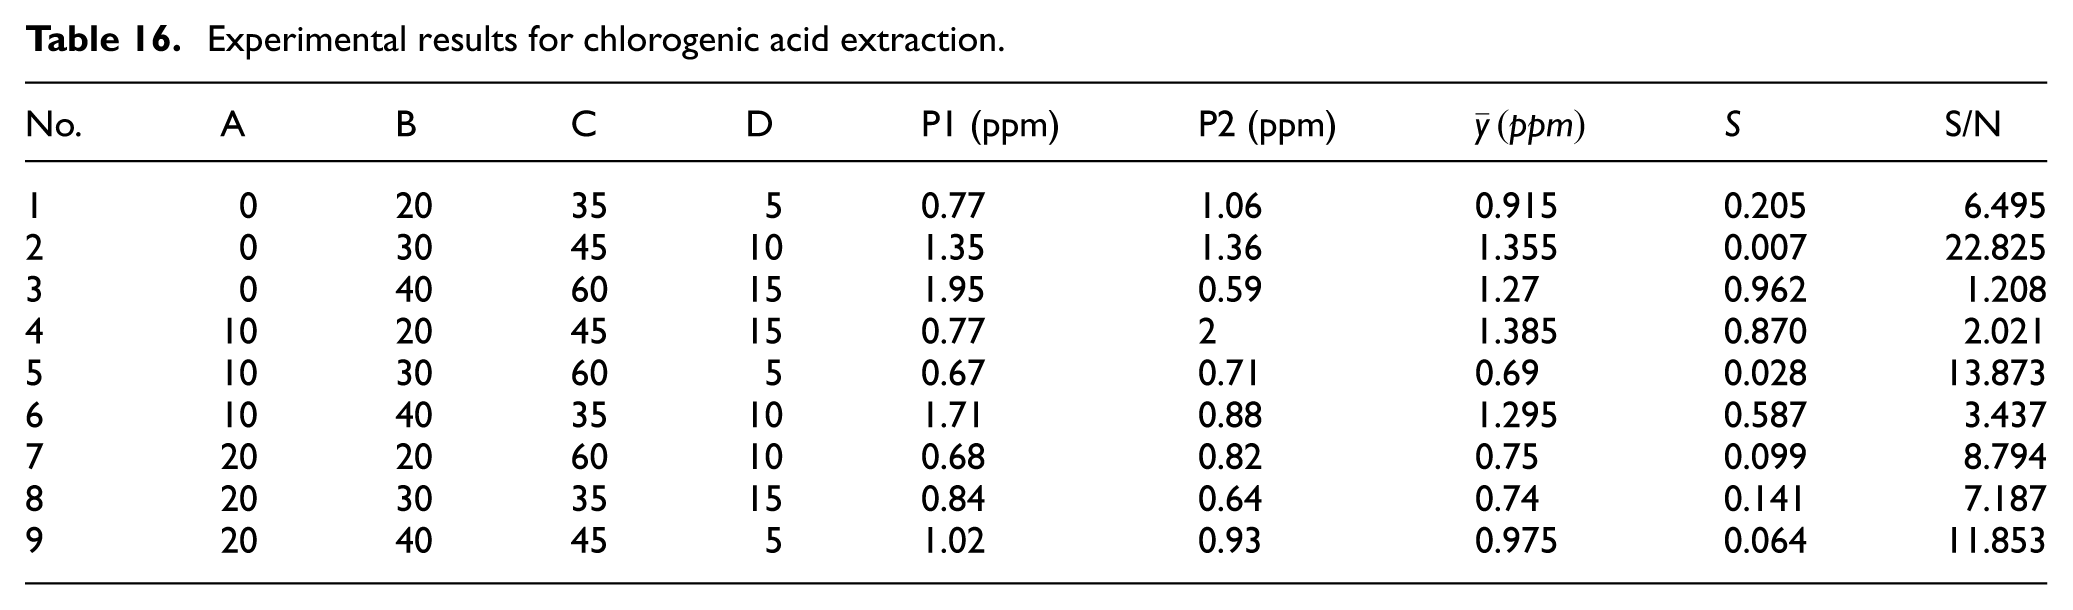
Chlorogenic acid has numerous health benefits. Thus, in designing the extraction process, the aim should be to maximize the extracted concentration (Table 16). According to Table 17, the extraction parameters should therefore be set as follows: A1 Pulverization Time: 0 s; B3 Extraction Temperature: 40°C; C2 Soak Time: 45 min; and D3 Oscillating Extraction Time: 15 min. In addition, Table 18 shows that the chlorogenic acid concentration depends equally on all four control factors.
Experimental results for chlorogenic acid extraction.
Factor effects for chlorogenic acid extraction.

ANOVA results for chlorogenic acid extraction.
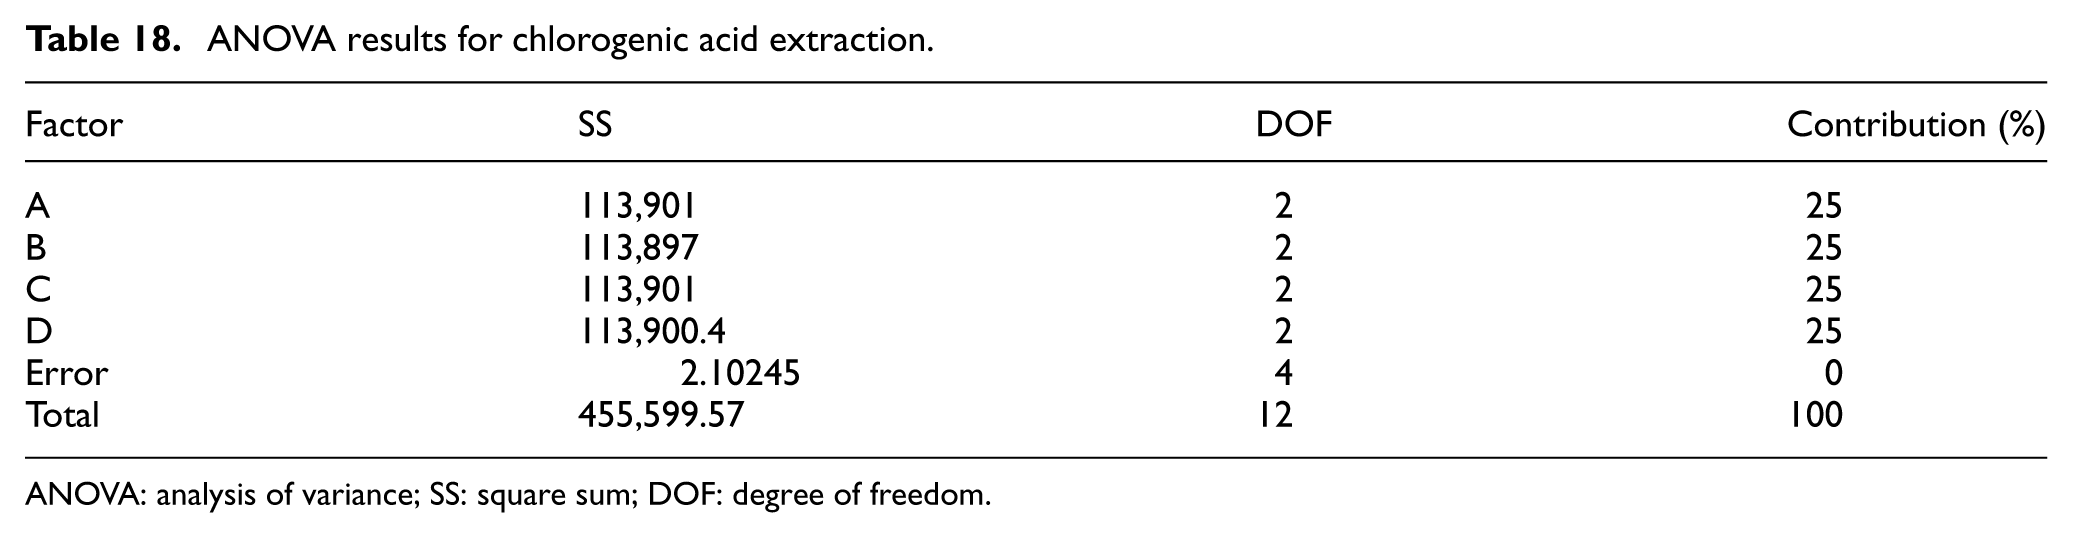
ANOVA: analysis of variance; SS: square sum; DOF: degree of freedom.
Conclusion
This study has used the Taguchi design methodology to optimize the processing conditions of a composite ultrasonic system for the extraction of five key components of green tea, namely caffeine, catechin, EGCG, EC, and chlorogenic acid. In performing the Taguchi trials, the experiments have considered four control factors, namely (A) the green tea pulverization time, (B) the extraction temperature, (C) the soaking time, and (D) the ultrasonic oscillating time. The main findings of this study can be summarized as follows:
The optimal extraction parameters for caffeine are a Pulverization Time of 0 s, an Extraction Temperature of 20°C, a Soak Time of 35 min, and an Oscillating Extraction Time of 5 min. Of the four control factors, the extracted caffeine concentration is dependent mainly on the pulverization time.
The optimal extraction parameters for catechin are a Pulverization Time of 10 s, an Extraction Temperature of 30°C, a Soak Time of 45 min, and an Oscillating Extraction Time of 15 min. The extracted catechin concentration depends mainly on the pulverization time.
The optimal extraction parameters for EGCG are a Pulverization Time of 10 s, an Extraction Temperature of 40°C, a Soak Time of 35 min, and an Oscillating Extraction Time of 10 min. The extracted EGCG concentration is dependent mainly on the extraction temperature.
The optimal extraction parameters for EC are a Pulverization Time of 20 s, an Extraction Temperature of 40°C, a Soak Time of 60 min, and an Oscillating Extraction Time of 15 min. The extracted EC concentration is dependent equally on all four control factors.
The optimal extraction parameters for chlorogenic acid are a Pulverization Time of 0 s, an Extraction Temperature of 40°C, a Soak Time of 45 min, and an Oscillating Extraction Time of 15 min. The extracted chlorogenic acid concentration depends equally on all four processing parameters.
Footnotes
Academic Editor: Stephen D Prior
Declaration of conflicting interests
The author(s) declared no potential conflicts of interest with respect to the research, authorship, and/or publication of this article.
Funding
The author(s) disclosed receipt of the following financial support for the research, authorship, and/or publication of this article: The financial support of this research by the Ministry of Science and Technology of R.O.C. under the projects nos 104-2221-E-167-014 and 104-2622-E-167-006-CC3 is greatly appreciated.