
Abstract
Hybrid-driven underwater glider is a new kind of unmanned platform for water quality monitoring. It has advantages such as high controllability and maneuverability, low cost, easy operation, and ability to carry multiple sensors. This article develops a hybrid-driven underwater glider, PETRELII, and integrates a water quality monitoring sensor. Considering stability and economy, an optimal layout scheme is selected from four candidates by simulation using computational fluid dynamics method. Trials were carried out in Danjiangkou Reservoir—important headwaters of the Middle Route of the South-to-North Water Diversion Project. In the trials, a monitoring strategy with polygonal mixed-motion was adopted to make full use of the advantages of the unmanned platform. The measuring data, including temperature, dissolved oxygen, conductivity, pH, turbidity, chlorophyll, and ammonia nitrogen, are obtained. These data validate the practicability of the theoretical layout obtained using computational fluid dynamics method and the practical performance of PETRELII with sensor.
Keywords
Introduction
The Middle Route of the South-to-North Water Diversion Project (SNWDP) is beneficial to a population of 60 million in Beijing, Tianjin, Hebei, and Henan Province. The population of indirect benefit can reach 100 million. Water source quality is linked closely with people’s livelihood. Much research about water source quality monitoring has been done by many scholars at home and abroad. Sky–earth integration method taking Danjiangkou Reservoir as the study area is proposed and well combines geographic information system (GIS) spatial analysis technique, remote sensing monitoring technique, and intelligent management of water information. It makes up for the deficiency of current water quality monitoring system and meets the requirement of warning, forecasting, and rapid reaction for abrupt and malignant water pollution accidents. 1 A bionic robot fish carrying dissolved oxygen (DO) and pH sensors was designed to increase collection points and improve accuracy of real-time data. It was used to monitor water quality dynamically in real time and continuously. 2 JR Powell et al. 3 reported results from a 6-year ocean front observation (2006–2011) along two transect lines across the Southern California Current System (SCCS) using autonomous Spray ocean gliders. They also discussed implications of their results in the context of long-term trends in ocean fronts in the SCCS. As part of the CASCADE (CAscading, Storm, Convection, Advection and Downwelling Events) experiment, F Bourrin et al. 4 deployed a glider equipped with optical sensors in the coastal area of the Gulf of Lions, NW Mediterranean in March 2011 to assess the spatio-temporal variability of hydrology and suspended particles’ properties and fluxes during energetic conditions. The current emphasis of monitoring water quality is on improving performance of sensors in China. Research on underwater gliders (UGs) carrying water quality monitoring sensors to conduct real-time monitoring tests has not been enough developed in the worldwide scope. UG was used to carry sensors to observe red tides and gather marine red tide information. 5 NURC and the Technical University of Catalonia (UPC) developed a glider acoustic payload that would provide the recording of two hydrophones and additionally report at-sea results from a deep-water WEBB glider operating in the Mediterranean Sea. Those results demonstrated the capability of the developed acoustic payload to detect and classify marine mammals in real time within the glider. 6 Analysis and study of hybrid-driven underwater glider (HUG) carrying sensor to monitor water quality of important headwaters is first proposed in this article. HUG is a new kind of underwater autonomous unmanned platform. It is a combination of the propeller-driven autonomous underwater vehicles (AUVs) and the buoyancy-driven UGs and has the advantages of high controllability and maneuverability, long endurance, and long on-site working time and efficiency. Hence, HUG has stronger environmental endurance and wider applications.
The sensor is for water quality monitoring and should be installed on the external surface of the UGs, where the sensor could work in an essentially unobstructed dank environment. For the layout changes the single-axis-rotator form of traditional UGs and hydrodynamics of HUG would be affected. Hydrodynamic properties of various traditional UGs have been analyzed and studied by many scholars. Hydrodynamics of Slocum are obtained by flume experiments. 7 Numerical simulation was used to acquire the drag, the lift, and the pitching torque with respect to the buoyancy center of the UG at different speeds and attack angles. The relationship between hydrodynamics and gliding attitudes was derived according to the flow structure of the flow field. 8 The resistance of motion and the maneuverability of HUGs in AUV mode were obtained by computational fluid dynamics (CFD) method based on structural characteristics of the underwater vehicles. 9 Energy change in the gliding motion was analyzed, and mathematical model in the rising and diving motion was set up. Hydrodynamic forces on the UG at different speeds and attack angles were calculated and studied using numerical computation method. 10 Hydrodynamics of UGs with a conductivity, temperature, and depth (CTD) sensor were analyzed using FLUENT. 11
Considering an actual monitoring task and the requirement for the overall performance of HUG with a sensor, a water quality monitoring strategy is proposed with a polygonal mixed-motion. In the mode of UG, the saw-tooth trajectory motion in the vertical plane should be taken; when UG dives, economy and stability are important parameters for evaluation of cruising ability, anti-jamming ability, and diving performance. In the mode of AUV, propulsion should be accomplished at water surface or near-surface. Maneuverability is important evaluation index of propulsion performance. Owing to the water monitoring sensor, additional pitching torque and yawing torque are caused by the nonsymmetrical configuration. To accurately accomplish water quality monitoring along the cruising trajectory, stability and economy are set as the major evaluation factors for multiple layout schemes which will be validated in reservoir trials.
It is the first case in China that HUG is used to monitor water quality. Specific testing strategy is proposed and validated in Danjiangkou Reservoir. This article also analyzes the economy, stability, and practicability of the HUG. The analytical result and the experimental trials would provide theoretical guidance and reference for practical applications.
In non-acceleration linear motion, belly-pack schemes are superior to the backpack schemes in stability and economy. HUG has better hydrodynamics when sensor is put near buoyancy center. In near-surface linear motion, the instability of HUG carrying sensor increases; from another point of view, stability will increase with the decrease in wave-making effect and increase in dive–depth ratio. As a whole, HUG carrying sensor demonstrates a good stability and controllability in full-scale water quality monitoring. Stability and reliability of the layout scheme “a” are validated by data recorded in HUG and sensor. Comparing with the HUG without sensor, hydrodynamics of HUG carrying sensor would change. Such result is in accordance with CFD simulation. When wave-making effect is taken into consideration in the near-surface motion, lift force and pitching torque are larger than those in the far-surface motion. The phenomenon of raising head is also obvious. With the increase in the dive–depth ratio and decrease in the wave-making effect, the lift force and the pitching torque gradually decrease. The pitching angle also decreases and the phenomenon of raising head weakens.
Structure and layout scheme of unmanned water quality monitoring platform
Empirical formula, constraint model, and CFD are three methods that are used to obtain hydrodynamics. Usually, empirical formula is limited by the geometry of the object, while constraint model requires much time and effort. In contrast, mesh can be generated for various geometries in the CFD method, and accurate simulation of the flow field can be conducted around underwater vehicles. 12
Similarity criteria in computational flow field, geometry model, and dynamic condition (such as Reynolds number) between computational model and real object are required for the analysis of hydrodynamic properties of unmanned water quality monitoring platform. 13 In this occasion, computational results could truly mirror impacts on hydrodynamic properties caused by different layout schemes. Four computational models for different layout schemes are set up. Layout schemes are shown in Figure 1. The total length of the platform is 2245 mm and the diameter is 220 mm. The difference in the schemes is the different locations of the sensor installed on the HUG. The schemes including rear belly, front belly, middle belly, and back are the only and the common layout in the area of the glider.

The layout schemes of unmanned water quality monitoring platform: (a) rear belly, (b) front belly, (c) middle belly, and (d) back.
Analysis flow using the CFD method for the physical model is shown in Figure 2.

Analysis flow chart adopting CFD.
Analysis on economy and stability of monitoring platform in non-acceleration linear motion
Establishment of fluid model
According to the International Flume Test Standards and practical experiences, cylindrical flow fields are adopted for gliders to avoid boundary effects.14–16 Shape of the flow field and the meshing method used in simulation of linear motion can be used for space motion simulation with changing of the position and the angle of the model. Adaptability of mesh in complex computational fields is guaranteed by unstructured mesh Auto GEM using ANSYS ICEM. The number of mesh elements is restricted to 1.1 million to guarantee computational stability and efficiency through mesh independence test. When the number exceeds 1.1 million, relevant parameters including drag, lift, torque, lift–drag ratio, and hydrodynamic coefficients would not change after lots of CFD simulations. Prismatic mesh is adopted in region near walls to obtain characteristics of the boundary layer, while tetrahedral unstructured mesh is adopted in other regions. The height of the first mesh, Δy, is obtained from the equation

The model of meshing.
In order to avoid the influence of the flow field of the geometrical boundary, models are built following the geometric similarity criterion of fluid flow in the numerical simulation. Therefore, according to the international test standard processing rules and practical experiences, the flow field shown in Figure 4 is cylindrical. The distance between the velocity inlet and the head of the HUG is 3L, which is about 7 m. The distance between the tail of the HUG and the pressure outlet is 4L, which is about 9 m. The diameter D of the flow field is about 2.2 m, which is 10 times as large as the diameter of the HUG.
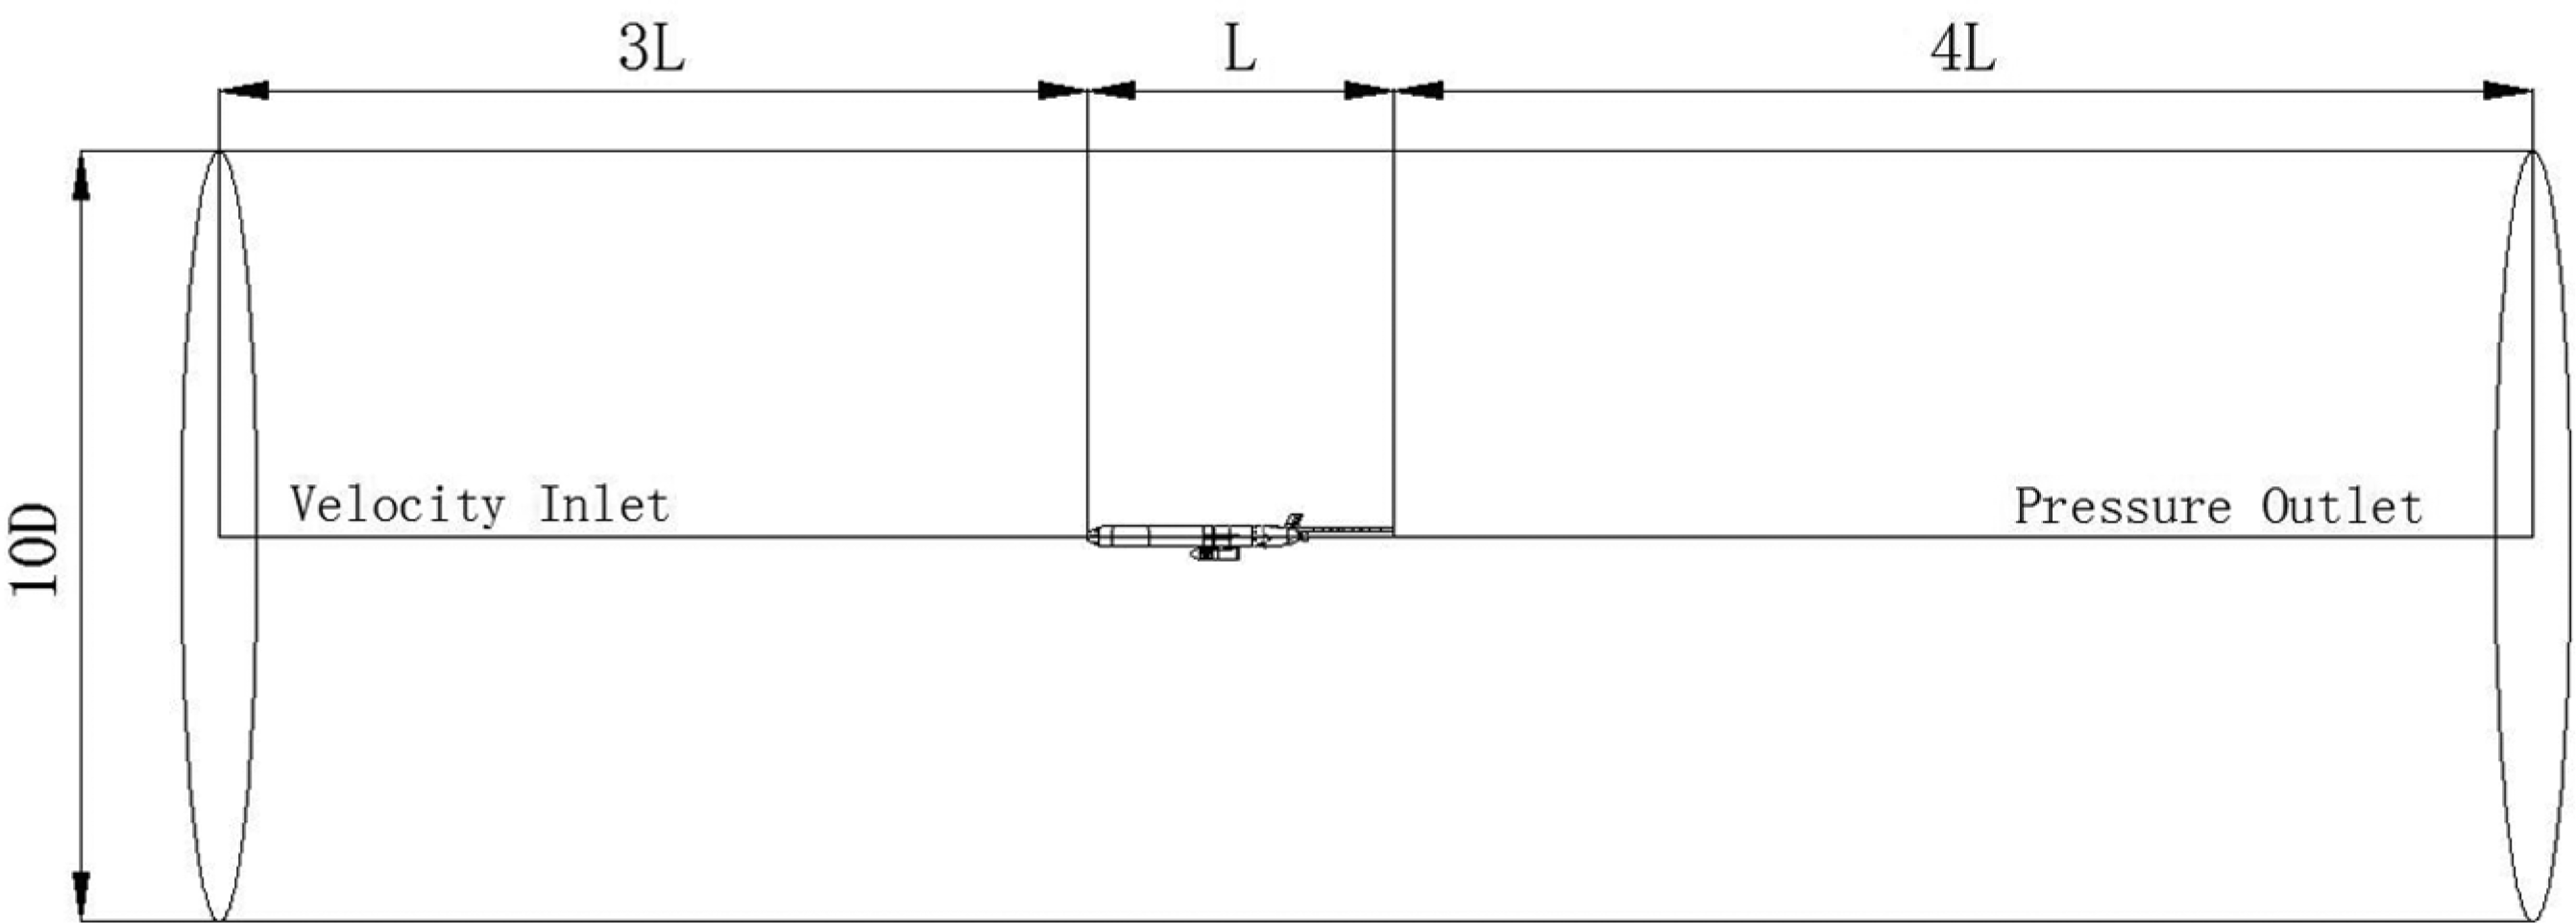
The model of flow field.
Turbulent model and description of Navier–Stokes equation and fluid–structure interaction formulas
There are several models for fluid computation of AUV hydrodynamic coefficients, such as the k−ε model, the re-normalization group (RNG) k−ω model, and the k−ω model. Different turbulence models have their own advantages and disadvantages. According to the analysis of SUBOFF and SM-x submarines, the k−ε model is good for computation of bare hull resistance; the RNG k−ω model is suitable for computation of whole hull resistance, where the relative error between prediction and the experimental result can be restricted in 2%; 17 and the k−ω model is for numerical simulation of the tail end fluid field of the whole hull, where the axial velocity fluctuations, the amplitude, and the phase position can be calculated accurately and the relative error is in 3%. The designed monitoring platform has a speed of 1 knot, and its Reynolds number is 1.514 × 10⁵. The k−ω two-equation model is adopted because the k−ω turbulence model can accurately predict vertical forces and trim torques when the inflow has an attack angle. 18
Since seawater could be reckoned as viscous incompressible fluid, the Navier–Stokes (N-S) equation is as follows:
Continuity equations

Momentum equations

where
The k−ω equation is a function of turbulence kinetic energy k and the turbulent dissipation rate ω. It could be described as


In the above equation,
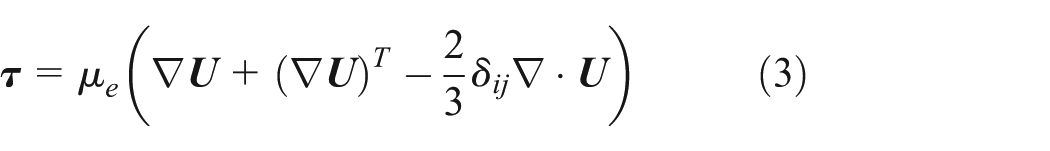
The fluid–structure interaction should follow the basic principles of conservation. Here, only stress and displacement are taken into account


Analysis of CFD numerical simulation
The lift, drag, and pitching torque on the HUG in different layout schemes at different attack angles are analyzed using CFD method in this article. 19 Factors that affect the computational accuracy include the shape of the physical geometry model, the quality of meshing, selection of simulation parameters, and setting of boundary conditions. 20 Some parameters are set as follows. Choose the first-order implicit solver and standard k–ω model. The Semi-Implicit Method for Pressure Linked Equation (SIMPLE) algorithm is used to calculate the pressure–velocity coupling. Pressure discretization is PRESTO!, momentum discretization is the second-order Upwind, and the others are also the second-order Upwind. Other options remain as the default.
The boundary conditions are set as follows: (1) the inflow (left boundary of the solution domain) is the velocity inlet, 0.514 m/s; (2) the outflow (right boundary of the solution domain) is the pressure outflow; (3) wall (surface of the vehicle): wall; and (4) the fluid domain: symmetry, FLUID.
Analysis of lift–drag performance
According to the CFD analysis, the relations between the attack angle and the drag force, the lift force, and the pitching torque in different layout schemes are shown in Figure 5. In diving and rising processes, the lift force and the pitching torque are close to each other and gradually increase as the attack angle and the drag force increase. It is shown in the figure that scheme “a” has the smallest drag force, while schemes “b” and “c” have the biggest drag force in the diving process, and scheme “b” has the biggest drag force in the rising process. It is also indicated that schemes “a” and “d” are superior to schemes “b” and “c” with regard to the lift force. As for the pitching torque, schemes “a” and “d” have a larger pitching torque than schemes “b” and “c.” In conclusion, scheme “a” has the smallest drag force and pitching torque and the biggest lift force, followed by schemes “d,”“c,” and “b.”

Simulation diagrams of different schemes: (A) curve of drag-α, (B) curve of lift-α, and (C) curve of pitching torque-α.
Figures 6–8 illustrate the simulation results of contours of press, velocity, and turbulence in different layout schemes. It can be observed that the head dome of the HUG, the head of the sensor, and the end of the tail vane are greatly affected by the disturbance of press and velocity. The further the sensor is away from the head dome of the HUG, the less turbulence the sensor is influenced. Besides, the bad streamline of HUG causes obvious velocity cyclotron at the back of sensor and rotator near the tail. In conclusion, if the sensor is put closer to the center of the HUG, less impact would be expected on the whole turbulence section and the external condition.

Contours of press of different layout schemes: (a) rear belly, (b) front belly, (c) middle belly, and (d) back.

Contours of velocity of different layout schemes: (a) rear belly, (b) front belly, (c) middle belly, and (d) back.

Contours of turbulence in different layout schemes: (a) rear belly, (b) front belly, (c) middle belly, and (d) back.
Analysis of static stability
To accomplish water quality monitoring, the monitoring platform should achieve two main forms of motion: the non-acceleration linear motion and the non-acceleration turning motion. Excellent stability must be guaranteed to reduce the frequency of adjusting motion due to external interference, so that the navigation and detection precision of the sensors can be enhanced, and the safety and cruising ability of the HUG can be improved. 21 Stability consists of static stability and dynamic stability in dynamics. This article emphasizes the static stability. Static stability means the initial response of the pitching torque N(α) when the attack angle α is disturbed. The buoyancy center could be adjusted along the horizontal axis in water. When α is zero, N(α) is zero. When an additional Δα is positive, N(α) will have three possible changing possibilities as:
ΔN(α) < 0.
ΔN(α) = 0, when
ΔN(α) > 0, when
In this article, the ratio of the pitching moment

where Lα is the dimensionless hydrodynamic center arm. It is a static stability evaluation index. When Lα < 0, the HUG is statically instable; when Lα > 0, the HUG is statically instable. 22 The greater the value, the more stable the HUG is.
Figure 5 shows the force analysis at different schemes from mechanical intuitionally. In order to analyze economy and static stability, hydrodynamic parameters for different layout schemes, such as the lift force coefficient CL, the drag force coefficient CD, and the pitching torque coefficient CN, are obtained using CFD simulation.
With further data processing, the relationships between the attack angle and the lift force coefficient CL, the drag force coefficient CD and the pitching torque coefficient CN in different layout schemes are obtained and shown in Figure 9. The changing trend of CL, CD, and CN with increase in attack angle corresponds with the force analysis. The difference is that CN of schemes “a” and “d” is obviously larger than that of schemes “b” and “c” in Figure 5.
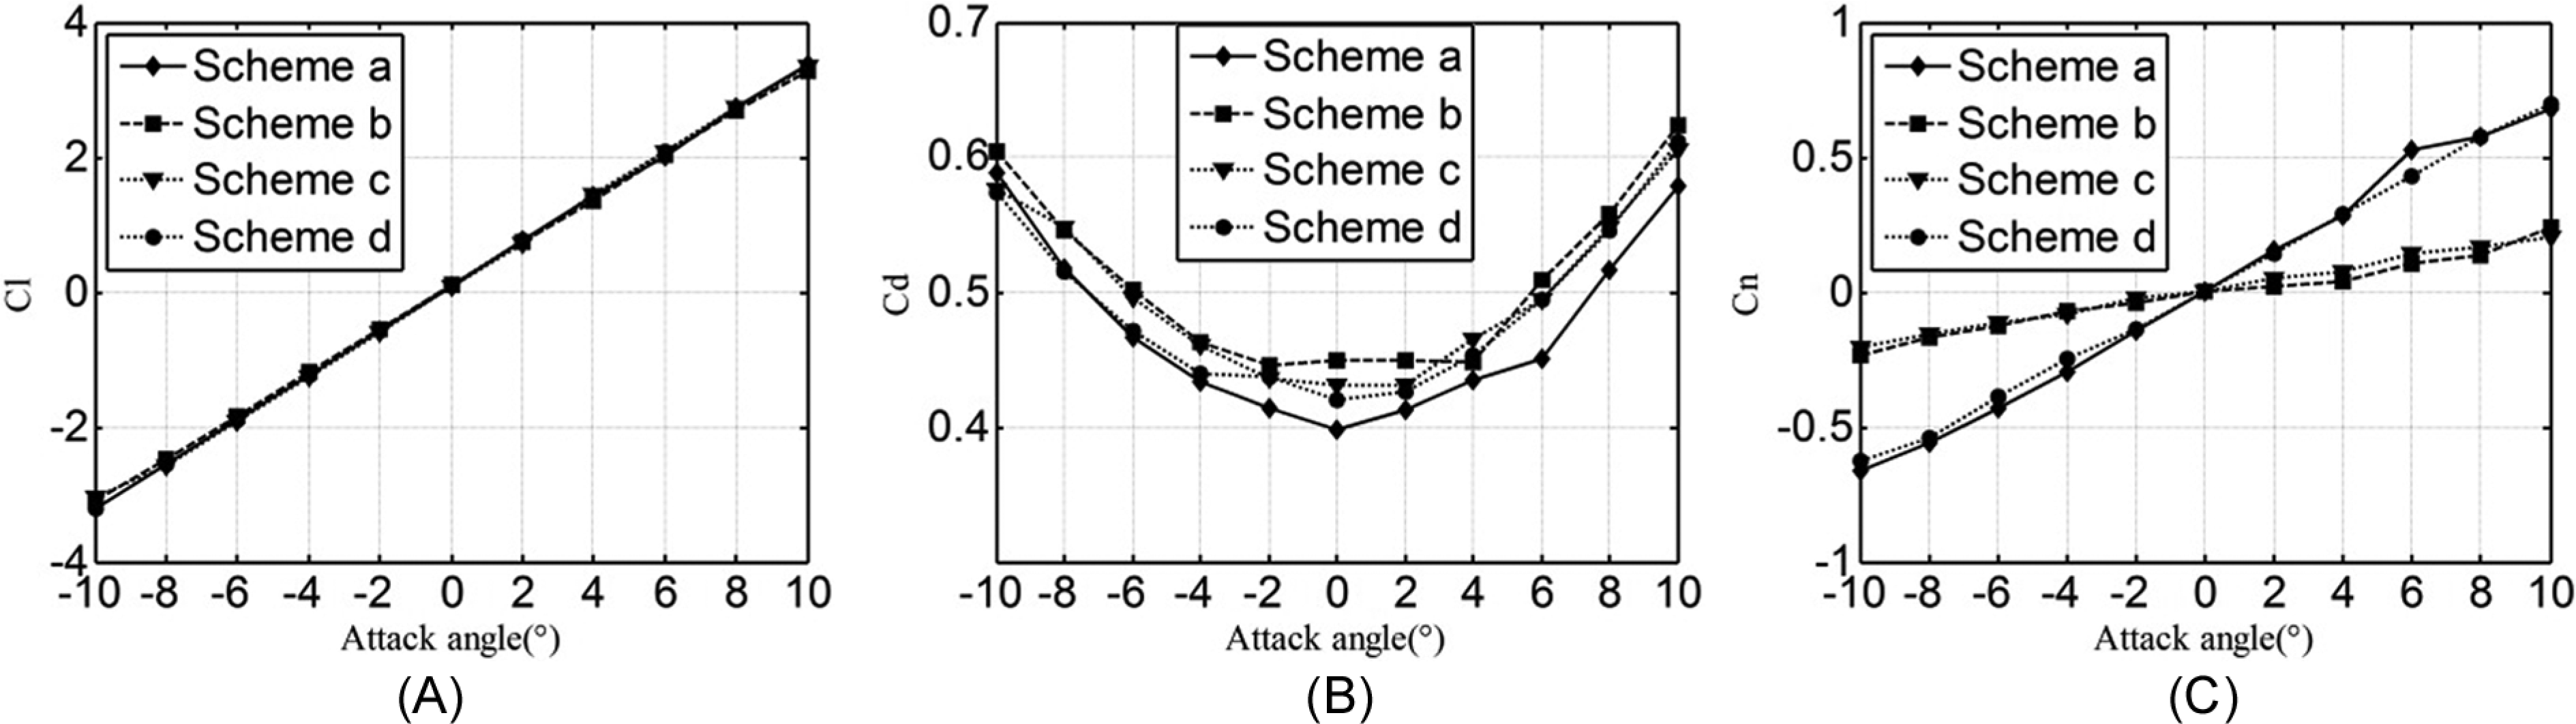
Relationship between hydrodynamic parameters and angle of different schemes: (A) curve of CL–α, (B) curve of CD–α, and (C) curve of CN–α.
C
L–α and CN–α curves are fitted by the least square method, which has the minimum curve error for fitting with the minimum of DEVSQ.
Data analysis of static stability.

“+” represents diving process and “−” represents floating process.
According to above table, four layout schemes are stable. Scheme “a” performs the best in the diving process, followed by schemes “d,”“b,” and “c.” Scheme “d” performs the best in the rising process, followed by schemes “a,”“c,” and “b.” In conclusion, schemes “a” and “d” have the best static stability.
Evaluation of economy
The lift–drag ratio K 23 given by equation (9) is adopted as an evaluating index of economy of the HUG. The K–α curve is obtained by CL and CD as shown in Figure 10


Curve of K–α.
Figure 10 shows that the lift–drag ratio increases as the attack angle increases. Scheme “a” has the biggest lift–drag ratio and the best economy, followed by schemes “d,”“c,” and “b.”
In conclusion, the backpack scheme has better stability in the rising process, while the belly-pack scheme has better stability and economy as a whole. In consideration of monitoring tasks on the water surface where the backpack scheme has a buoyancy loss and the sensor may be above water, belly-pack scheme is adopted. According to contours of the CFD simulation, the HUG can have less press, less velocity disturbance, and whole dynamic performance when the sensor is put away from the leading dome. Scheme “a” has an excellent performance. According to the analysis of stability and economy, the HUG has better hydrodynamics when the sensor is near the end and near the buoyancy center.
Analysis on stability of monitoring platform in near-surface linear motion
The HUG with the water quality monitoring sensor should accomplish linear motion for the monitoring task.21,24 There are surface linear motion, near-surface linear motion, and far-surface linear motion according to different depths. Far-surface linear motion that we have discussed above is more complex for HUG to perform surface and near-surface linear motions, because waves may have a great effect on controllability during near-surface operations. Especially when the HUG contacts with air in linear motion on the surface, the area in air and the area in water have different fluid forces. Besides, the dynamic performance of HUG will be easily affected by natural disturbance such as wind, stream, and wave. In this article, volume of fluid (VOF) algorithm is adopted for numerical simulation in the near-surface motion based on the real motion of the platform. Forces and torques obtained at different speeds and dive–depth ratio are simulated to analyze controllability of platform by CFD. Stability of the HUG with the sensor is also analyzed in the simulation. All the above analyses provide the basis for practical operation of the HUG with a water quality monitoring sensor.
Computational model of near-surface motion
To analyze the mechanical properties of the unmanned monitoring platform near the surface of the water, this article simulates and calculates the platform with and without the water quality sensor in at given navigational speed of 0.5, 1, 1.5, and 2 m/s with a series of different dive–depth ratios (H/D) of 0, 1, 2, and 3. The whole computational domain is divided into two parts: the upper part is air, and the lower part is water. The entrance is also divided into two sides, as shown in Figure 11. The number of the model girds is about 1.2 million. When the number of mesh elements exceeds 1.2 million, parameters including the drag, the lift, the torque, the lift–drag ratio, and the hydrodynamic coefficients would not change after simulations by CFD method. To avoid the restricted maximum turbulent viscosity ratio in the calculation process, the model used in the calculation is VOF, water is set as the primary phase, the solution method is the pressure-based Semi-Implicit Method for Pressure Linked Equations-Consistent (SIMPLEC) method, and second-order Upwind is set up. The boundary conditions are as follows: (1) inflow (left boundary of solution domain): air velocity inlet and water velocity inlet, we choose 0.5, 1.0, 1.5, and 2.0 m/s separately; (2) outflow (right boundary of solution domain): pressure outflow; (3) wall (surface of the vehicle): wall; and (4) fluid domain: symmetry, FLUID.
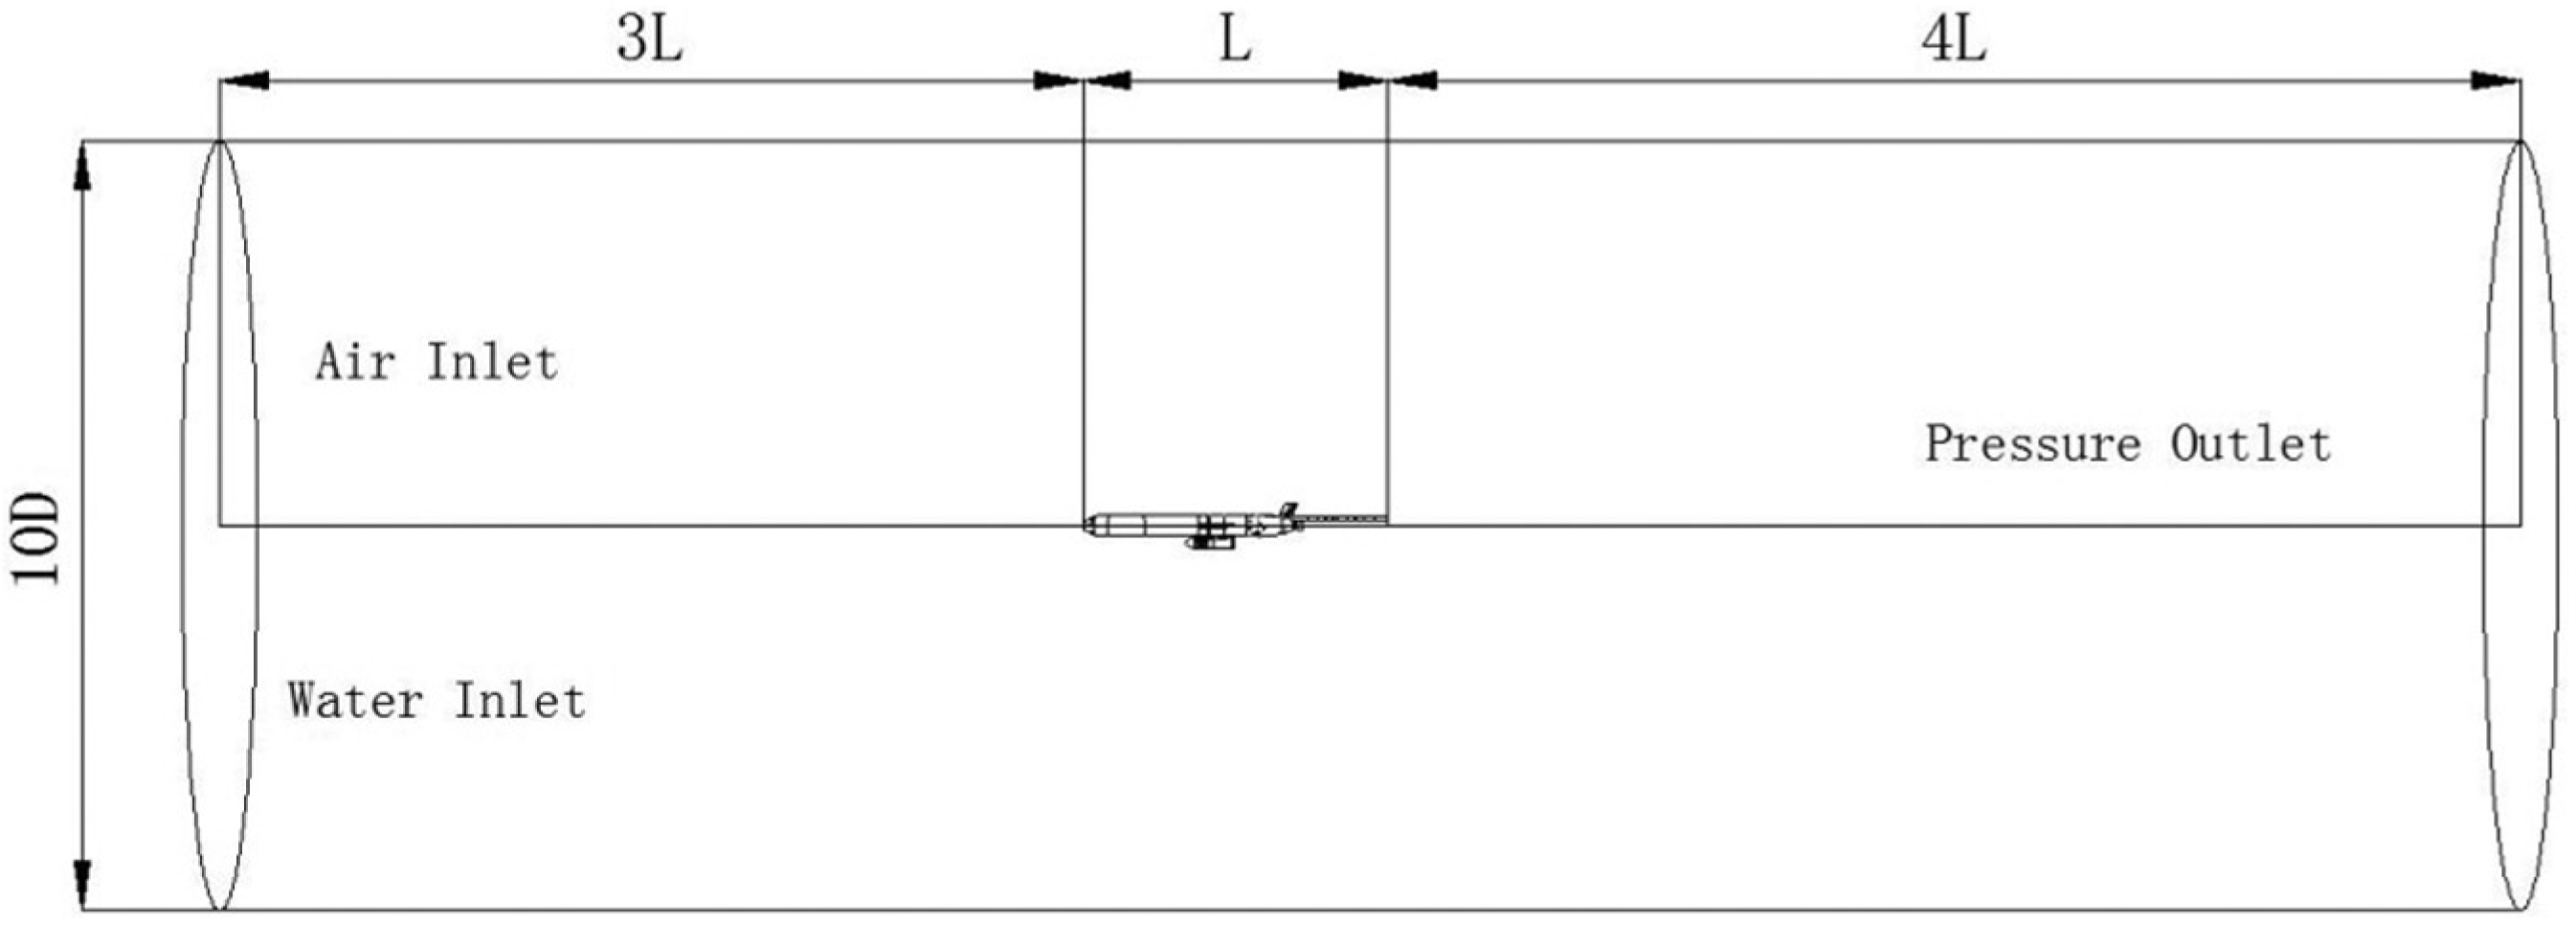
The model of flow field in VOF.
Result analysis of near-surface motion
When the HUG sails close to the water surface, it would interact with the free surface. In this case, the flow field is asymmetric, and the effect of waves could not be ignored. However, as the depth increases, the influence will gradually decrease. Figure 12 shows the changes of the free surface when the platform voyages in different depths (H/D = 0, 1, 2, 3). The dynamic pressure between the main platform and the water surface gradually decreases as the depth increases. There is no obvious difference between the main fluid flow and unbounded turbulent flow near the platform when H/D = 3.

Contours of free surface in different H/D: (a) H/D = 0, (b) H/D = 1, (c) H/D = 2, and (d) H/D = 3.
Figure 13 compares the drag, the lift, and the pitching moment at different speeds and depths when the HUG is equipped with and without water quality monitoring sensor. There are four figures representing the results at different speeds ranging from 0.5 to 2.0 m/s. X-coordinate means the dive–depth ratio and Y-coordinate means the values of force including drag and lift or torque. With the increase in the speed, the drag, the lift, and the torque would increase. Furthermore, taking the first figure for instance, the meanings of six curves are shown in the figure, among which solid curves represent the platform without sensor and dash curves mean opposite situation. It is also indicated in the figure that the drag force of the HUG is bigger with the sensor than without, with which other three figures agree. With the increase in the dive–depth ratio, the drag increases at first and then decreases. The reason is that the air resistance is relatively small when the platform navigates on the water surface. However, as the depth continues to increase, the water resistance increases gradually until the platform is merged in the water, and so does the whole drag. On this occasion, the effect caused by waves reduces gradually. In addition, compared with the case where there is no sensor, the platform is subjected to a greater resistance. The reason is that the platform has a bigger cross-sectional area. For the lift and the pitching moment, the values tend to decrease with the increase in the dive–depth ratio. What’s more, the values are a little smaller than those obtained when no sensor is installed on the HUG. However, they are very close. The existence of wave-making phenomenon will produce a result similar to the bank effect 25 of inshore voyages. The “bank effect” refers to the tendency of the stern of a ship to swing toward the near bank when operating in a river or constricted waterway. Due to the negative torque, the platform has a tendency to rise, which would be reflected on pitch angle. In summary, effect of waves would decrease and tend to a stable equilibrium with the increase in dive–depth ratio. That is, the platform eventually comes to a stable state.

Comparison diagrams of drag, lift, and pitching moment at different speeds and depths: (a) speed, −0.5 m/s, (b) speed, −0.1 m/s, (c) speed, −1.5 m/s, and (d) speed, −2.0 m/s.
Trial in Danjiangkou Reservoir
Trials were carried out in Danjiangkou Reservoir from 16 July 2014 to 31 July 31, 2014. The HUG carried a water quality monitoring sensor and operated in a stable motion. The sensor provides technical supports for emergent water quality monitoring. The monitoring platform in the trials is shown in Figure 14. The experiment does not only focus on data collection and storage function, linear motion on the surface, linear motion, and maneuverability of HUG with sensor but also provide experimental support for mixed-motion multitask water quality monitoring.

The monitoring platform of the trial in Middle Route of the SNWDP.
Comprehensive mixed-motion water quality monitoring task
The HUG equipped with water quality monitoring sensor is shown in Figure 15. The route for water quality monitoring is shown in Figure 16. The route is designed according to the actual water environment to obtain overall water quality data. In the figure, the red line is designed route, green line is actual route, (1) and (2) denote linear motions on the surface, (3) is the 10-m flight motion near the surface, (4) is linear motion on the surface, and (5) is the 10-m flight motion near the surface. The three-dimension track derived from the collected data is shown in Figure 17. Figure 18 shows the related three-dimensional (3D) diagrams of temperature, DO, conductivity, pH, turbidity, chlorophyll, and ammonia nitrogen obtained by the sensor along the trajectory. In this figure, the 3D coordinates (longitude, latitude, and depth) represent the points in the actual environment, while colors represent the values at this point. In this way, the water quality parameters at any point can be obtained easily.
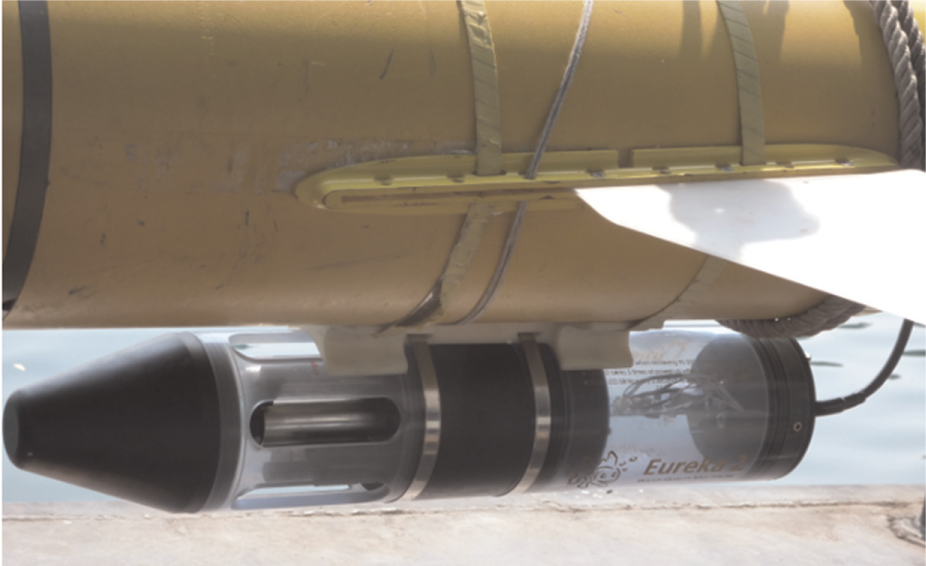
HUG carried with water quality monitoring sensor.
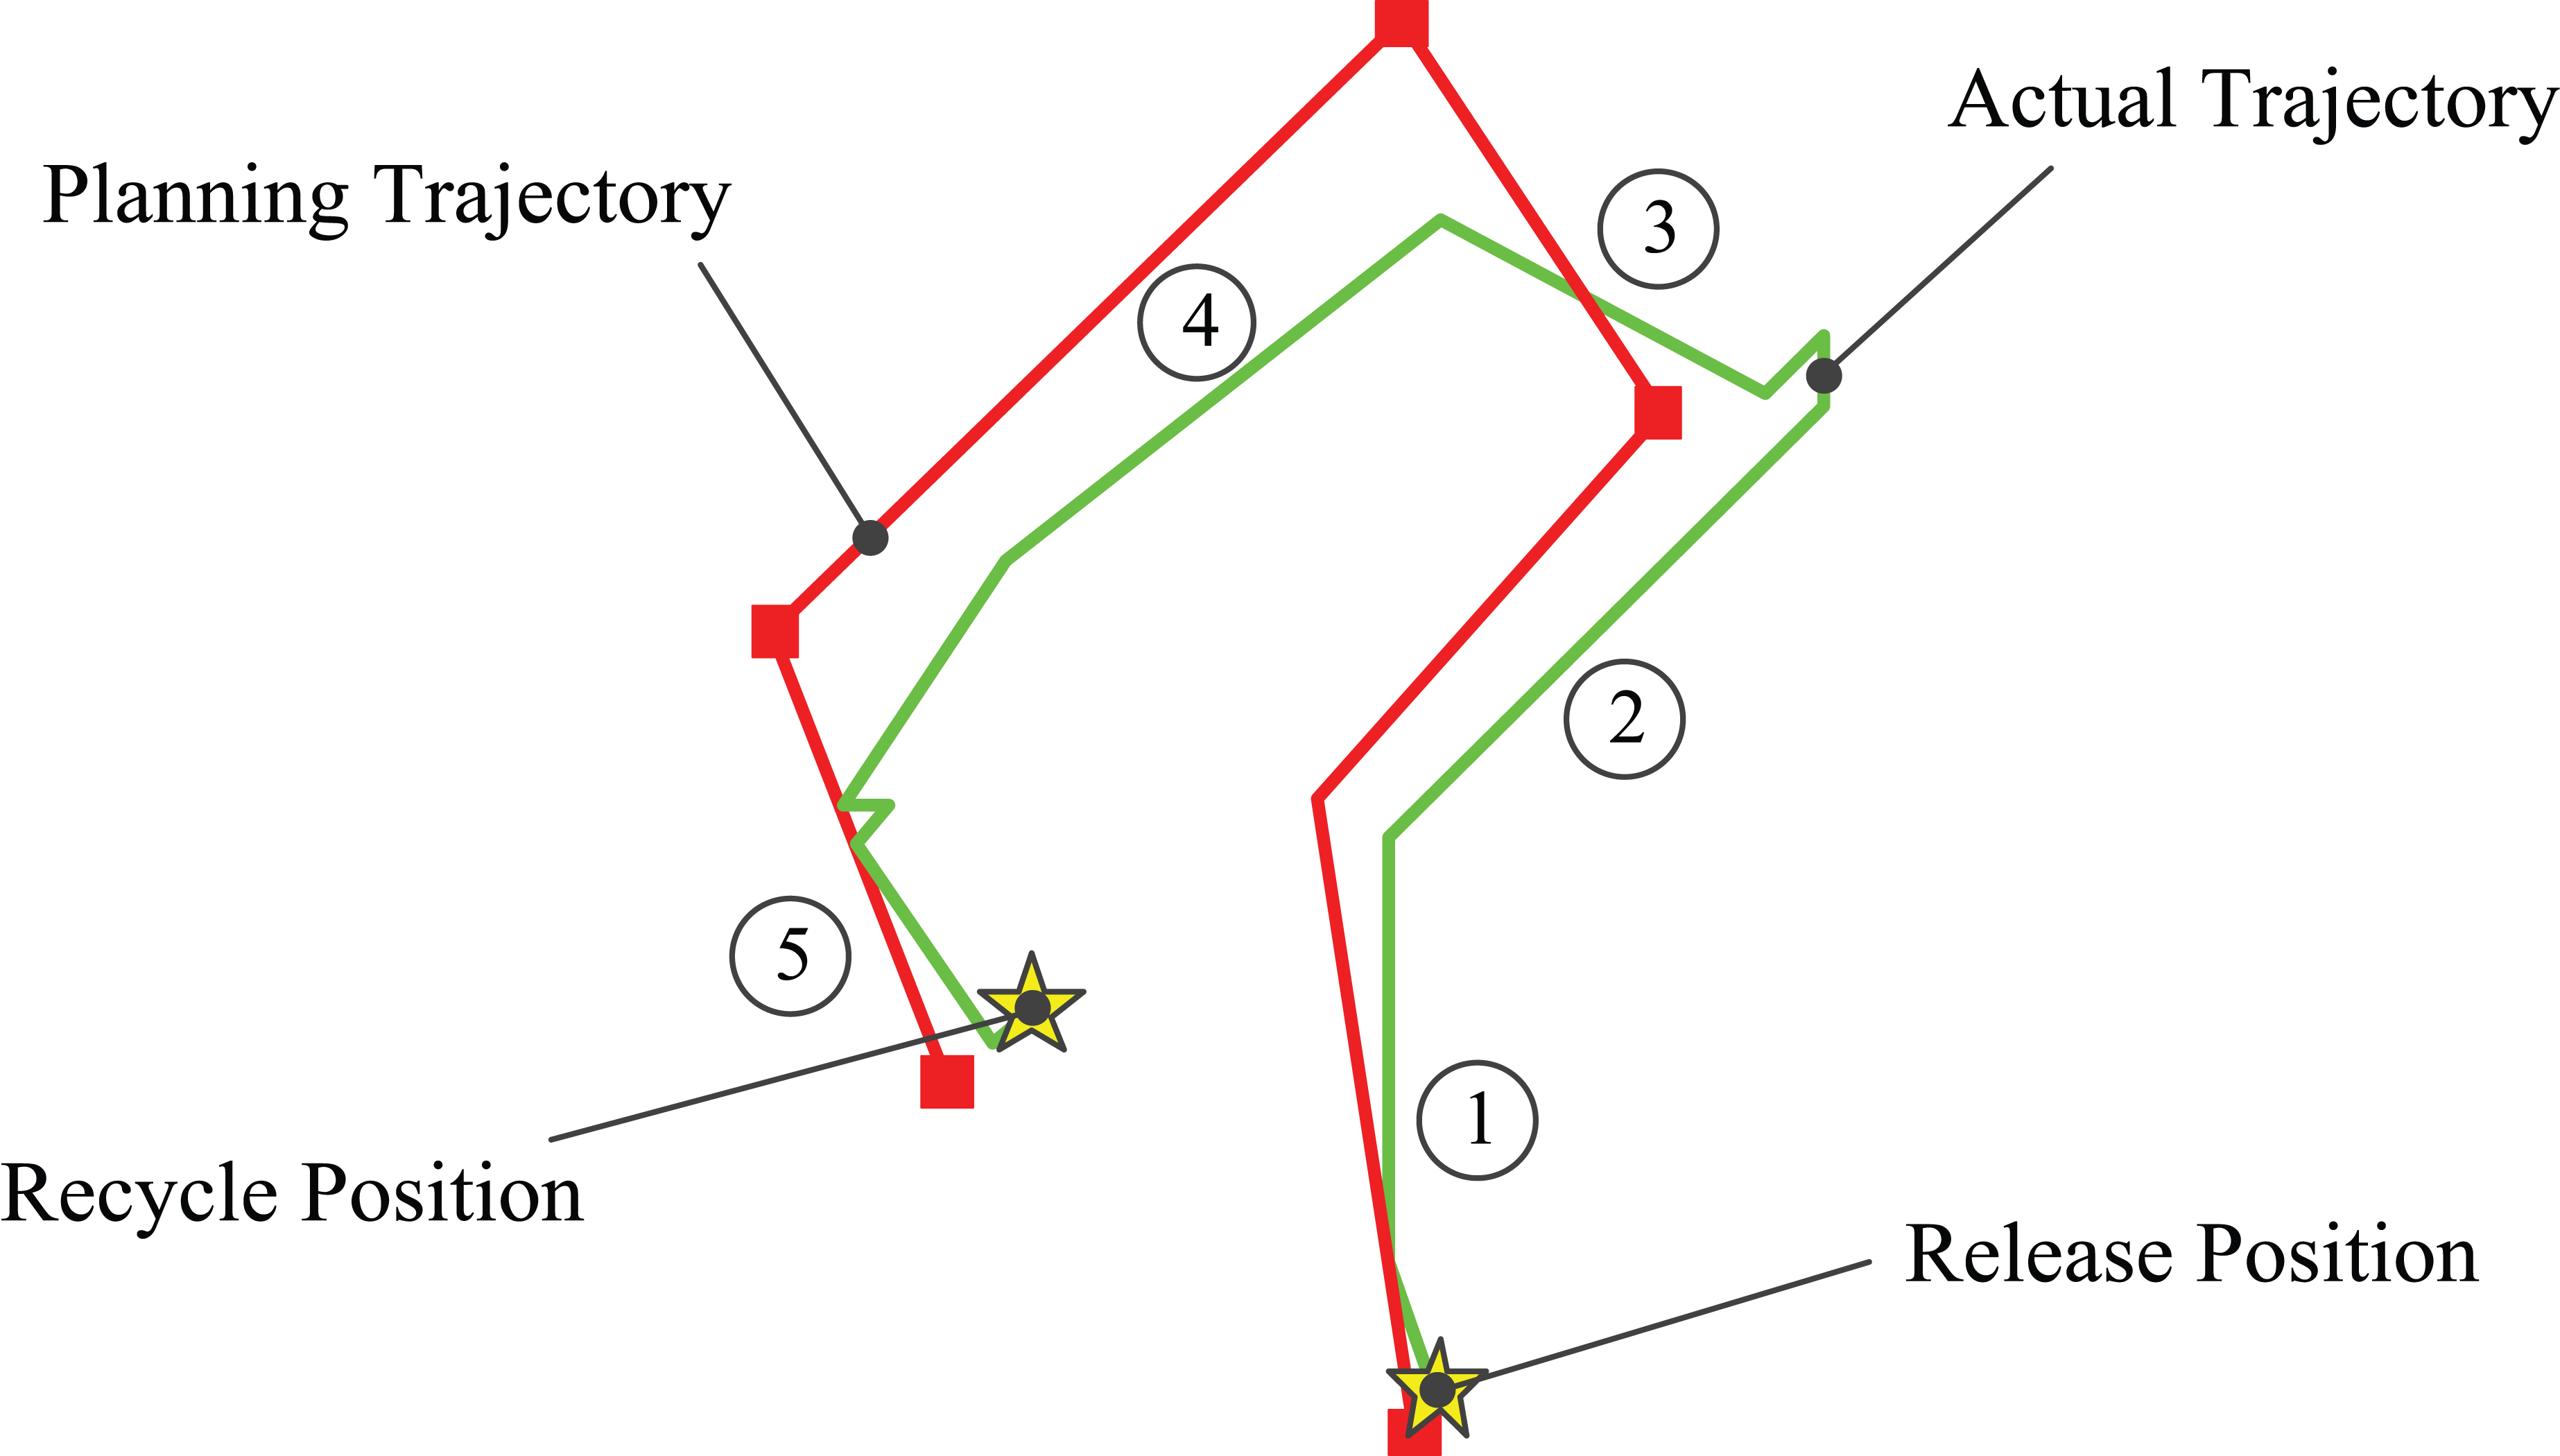
Navigation chart of trials in Middle Route of the SNWDP.

Real three-dimensional track in multitasks.

Three-dimensional (3D) diagrams of temperature, dissolved oxygen, conductivity, pH, turbidity, chlorophyll, and ammonia nitrogen.
Controllability analysis
The controllability of the HUG with sensor course is shown in Figure 19. X-coordinate represents the time, and the crimson curve represents actual depth. As can be observed in the figure, propeller rotate speed (purple curve) is around 1300 r/min and fluctuates within 150 r/min in the surface motion. However, the propeller rotate speed is around 720 r/min and fluctuates within 50 r/min in near-surface motion. This phenomenon shows that the platform is less affected by external disturbance at 10-m near-surface motion, but would be more affected by output of the propeller revolution due to wave forces on the surface. Such result demonstrates the conclusion in section “Analysis on stability of monitoring platform in near-surface linear motion” that the effect of waves disturbs the controllability of HUG in near-surface motion.

The sailing controllability of HUG with water quality sensor.
Comparing the actual sailing course (the thin red curve) with target course (the blue curve), we can find that the change of the rolling angle (the green curve) caused by environmental flow is irregular and controllability of the platform with sensor is restricted when the propeller is powered off. When the platform moves along the target course, the deviation with current course would be computed. Then the platform adjusts the turning rudder angle (the black curve) by adjusting turning torque until the actual course reaches the setting value.
Similarly, as is shown in Figure 20, trials for the HUG without sensor were also taken in order to analyze the controllability of coursing. The variation range of the rolling angle is less than that of the HUG with sensor. That is to say, HUG without sensor has better coursing controllability. From the aspect of depth, the variation of propeller speed on the water surface is more severe than 10 m under the surface. The result verifies the conclusion in section “Analysis on stability of monitoring platform in near-surface linear motion.”

The sailing controllability of HUG without water quality sensor.
It can be obtained from above figures that the HUG with scheme “a” adopted in the trials not only can monitor the water quality but also has better stability and economy. However, the HUG with sensor has a higher requirement for cruise controllability compared with that without sensor.
The pitching controllability of HUG with sensor is shown in Figure 21. In practical applications, the pitching angle changes irregularly when propeller is powered off, and at that time HUG is in free floatation. Actually such phenomenon can be ignored. What’s more, the controllability of the pitching attitude is restricted in the vertical plane, and HUG remains horizontal after propeller turns on and pitching mechanism works.

The pitching controllability of HUG with water quality sensor.
In Figure 21, X-coordinate represents the time, and the crimson curve represents the actual depth. It can be observed that the platform has higher stability in deep water. In the pitching attitude adjusting process, the deviation between the actual pitching angle (the thin red curve) and the target would be computed. The pitching rudder (the blue curve) could be adjusted until the actual pitching angle remains horizontal. Notice that pitching angle always keeps about +4°. That is to say, the platform has a little tendency to raise the head of the platform, but this phenomenon would disappear in the deep water. The reason is that the platform generates certain lift force and pitching torque caused by waves.
Similarly, as shown in Figure 22, trials for the HUG without sensor were performed in order to analyze the controllability of the pitching attitude. The variation in the range of rolling angle is less than that of the HUG with sensor. That is to say, the platform without sensor has better pitching controllability. From the aspect of depth, the variation of propeller speed on the surface is more severe than that in deep water, which verifies the conclusion in section “Analysis on stability of monitoring platform in near-surface linear motion” further. In addition, with the increase in depth, the effect of waves would die away and the tendency of raising head would also disappear.

The pitching controllability of HUG without water quality sensor.
In conclusion, comparing with HUG without sensor, hydrodynamics of the HUG carrying sensor would change with the change of drag force, lift force, and pitching torque. The result is in accordance with CFD simulation. In consideration of the effect of waves in the near-surface motion, the lift force and the pitching torque are larger than those in the far-surface motion, and phenomenon of raising head is obvious as well. With the increase in dive–depth ratio and the decrease in effect caused by waves, the lift force and the pitching torque gradually decrease, and the phenomenon of raising head also weakens. The performance of sailing control and pitch attitude adjustment is good, and the target course can be achieved by stable navigation attitudes. Besides, through the experiment water quality monitoring task can be accomplished by the layout scheme “a.” Monitoring data can be uploaded to the online monitoring platform database of the Middle Route of the SNWDP, which provides a new technical support for water quality monitoring.
Conclusion
This article discusses the theoretical analysis and trials of HUG carrying water quality monitoring sensor in Danjiangkou Reservoir, which is an important headwaters of the Middle Route of the SNWDP. In non-acceleration linear motion, belly-pack schemes are superior to the backpack schemes in stability and economy. The HUG has better hydrodynamics when the sensor is placed near the buoyancy center. In the near-surface linear motion, the instability of HUG carrying sensor increases; from another point of view, stability will increase with the decrease in effect caused by the waves and increase in dive–depth ratio. As a whole the HUG carrying sensor demonstrates a good stability and controllability in the full-scale water quality monitoring. Stability and reliability of the layout scheme “a” are validated by data recorded in the HUG and the sensor.
Footnotes
Acknowledgements
The authors acknowledge the contributions of many former and current members in the R&D team. This research has been done as close collaboration between the research groups headed by Y.W. and C.L. They directed the work and were responsible for proofreading the article. Z.W. contributed to article proofreading as well. C.L. was responsible for writing of the article, performing experiments, and analyzing the data.
Academic Editor: Ji-Hong Li
Declaration of Conflicting Interests
The author(s) declared no potential conflicts of interest with respect to the research, authorship, and/or publication of this article.
Funding
The author(s) disclosed receipt of the following financial support for the research, authorship, and/or publication of this article: This research is supported by the National Natural Science Foundation of China (No. 51475319, No. 51205277) and National Hi-tech Research and Development Program of China (No. 2012AA091001).