
Abstract
This article presents a novel method for visualizing the control systems behavior. The proposed scheme uses the tools of fractional calculus and computes the signals propagating within the system structure as a time/frequency-space wave. Linear and nonlinear closed-loop control systems are analyzed, for both the time and frequency responses, under the action of a reference step input signal. Several nonlinearities, namely, Coulomb friction and backlash, are also tested. The numerical experiments demonstrate the feasibility of the proposed methodology as a visualization tool and motivate its extension for other systems and classes of nonlinearities.
Introduction
Linear control theory is a well-established matter, and a plethora of methods for the analysis and synthesis of linear systems has been developed.1–4 However, linear systems are far from being the most adequate models of real-world phenomena since most exhibit nonlinear behavior. Due to this fact, during the last decade, researchers have paid more attention to nonlinear methods, but the available mathematical tools are complex and far from leading to straightforward results.5–11
In this article, we propose a methodology for observing the performance of control systems. The scheme is a pure mathematical and numerical formulation, and the results are to be interpreted as a new visualization concept inspired in the fractional calculus (FC). In this line of thought, the goal of the study is not to obtain a physical meaning but to open a new alternative concept to the classical integer modus operandi. The method computes the signal that propagates within the structure of a control system, leading to the representation of the traveling signal in both the time and frequency domains.
Having these ideas in mind, this article is organized as follows. In section “Mathematical tools,” we present the main mathematical tools for processing data. In section “Numerical simulation and computer visualization,” we simulate the system dynamics, and we propose a methodology for visualizing signal-wave propagation. Finally, in section “Conclusion,” we outline the main conclusions.
Mathematical tools
In this section, we present the main mathematical tools to be adopted during the data processing. Hence, in sub-section “Fractional-order derivatives and integrals,” we introduce briefly the concept of fractional-order “differintegral.” In sub-sections “Fourier transform” and “Fractionalization of elemental blocks,” we recall the Fourier transform (FT) operator and we address the fractionalization of an elemental linear block, respectively.
Fractional-order derivatives and integrals
FC generalizes the concepts of derivative and integral to non-integer orders. During the last decades, FC was found to play a fundamental role in modeling many relevant physical phenomena and emerged as an important tool in the area of dynamical systems with complex behavior.12–20
In a loose sense, fractional derivatives and integrals “interpolate” between integer-order operators. This property is particularly useful in control engineering since we can adapt standard algorithms to a smoother version based on FC. Besides this aspect, FC operators capture memory effects, which make them an useful tool in the modeling of phenomena with long-range correlations and memory.
Several definitions of fractional derivative and integral have been proposed.21–23 We recall here the Grünwald–Letnikov (GL) fractional “differintegral” operator of order
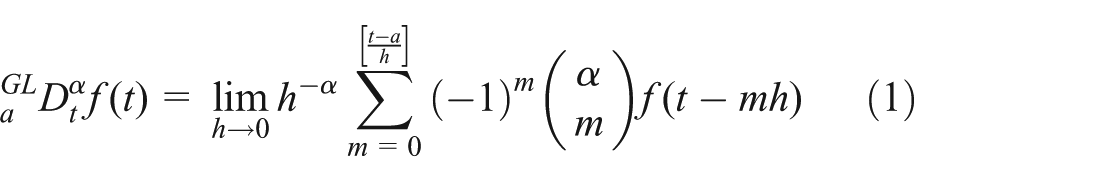
where [·] denotes the integer part,
Using the Laplace transform and neglecting initial conditions, we have the expression

where
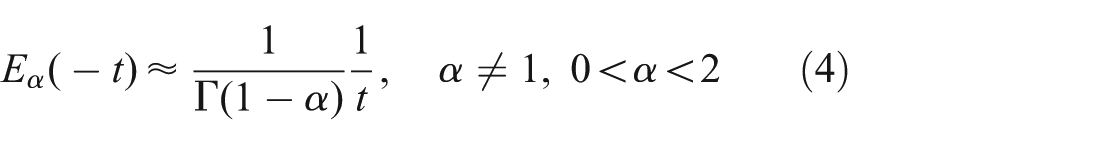
The Mittag-Leffler (ML) function,

This function establishes a connection between purely exponential and power law behaviors that characterize integer and fractional-order phenomena, respectively.
18
In particular, if
The Laplace transform (5) allows an extension of transform pairs from the exponential function and integer powers of

Based on these concepts of time-domain and frequency-domain tools, such as root locus,25,26 Bode and Nyquist diagrams, as well as the concepts of stability and state-space, have been applied to fractional-order control systems for analysis and control synthesis.24,27
Equation (1) can be easily approximated numerically by28,29

where
The binomial coefficients

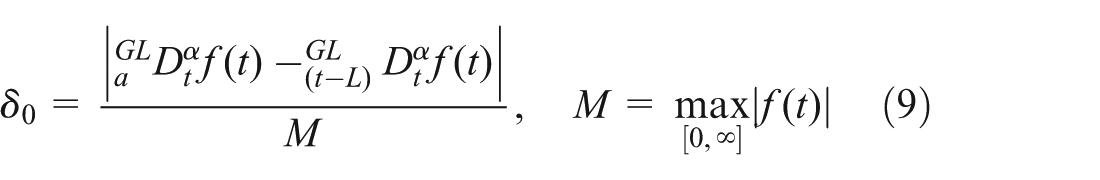
Parameter
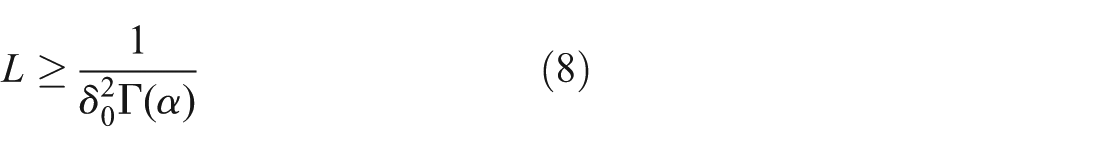
where
Fourier transform
The FT is a powerful and robust signal processing tool for the analysis of systems dynamics. The FT converts a time-domain signal or function,

where
The inverse FT is given by

Applying the “differintegral” operator to both sides of equation (11), we obtain, within certain conditions33,34

where
The FT has the advantage of being robust, allowing a direct interpretation of the processed data and being usable in a wide range of signals.
Fractionalization of elemental blocks
A control system is often represented graphically as a block diagram describing the system dynamic model. The block diagram includes no information about the physical construction of the system and is not unique. The main source of energy, as well as the energy flow, is not explicitly shown. Nevertheless, an individual block establishes a unilateral relationship between an input and an output signal, being assumed that there is no interaction between blocks.
Figure 1 represents the fractionalization of a linear elemental block, where
The intermediate signal


Fractionalization of a linear elemental block.
In the time domain, we have

In the particular case of an integrator/differentiator elemental block,

Numerical simulation and computer visualization
For demonstrating the proposed concepts, we analyze in the sequel the behavior of two representative control systems. In sub-section “Fractionalization of a linear system,” we consider a first-order linear plant with transport delay. In sub-section “Fractionalization of a nonlinear system,” we address a nonlinear system comprising an inertia, Coulomb friction, transport delay, and backlash. The closed-loop time and frequency responses to a unit-step input are analyzed.
Fractionalization of a linear system
We start with the control system of Figure 2, where the plant,


Linear control system with transport delay.
The controller is a fractional-order proportional–integral–derivative (PID), tuned by means of Ziegler–Nichols-type rules. 35 All units are expressed in the International System.
The three elemental blocks are fractionalized as described in sub-section “Fractionalization of elemental blocks,” with
Figures 3 and 4 depict the new representation through the path

Time-domain representation of the signal propagating along the forward path of the linear control system in response to a unit-step input: (a) contour map and (b) 3D surface plot.
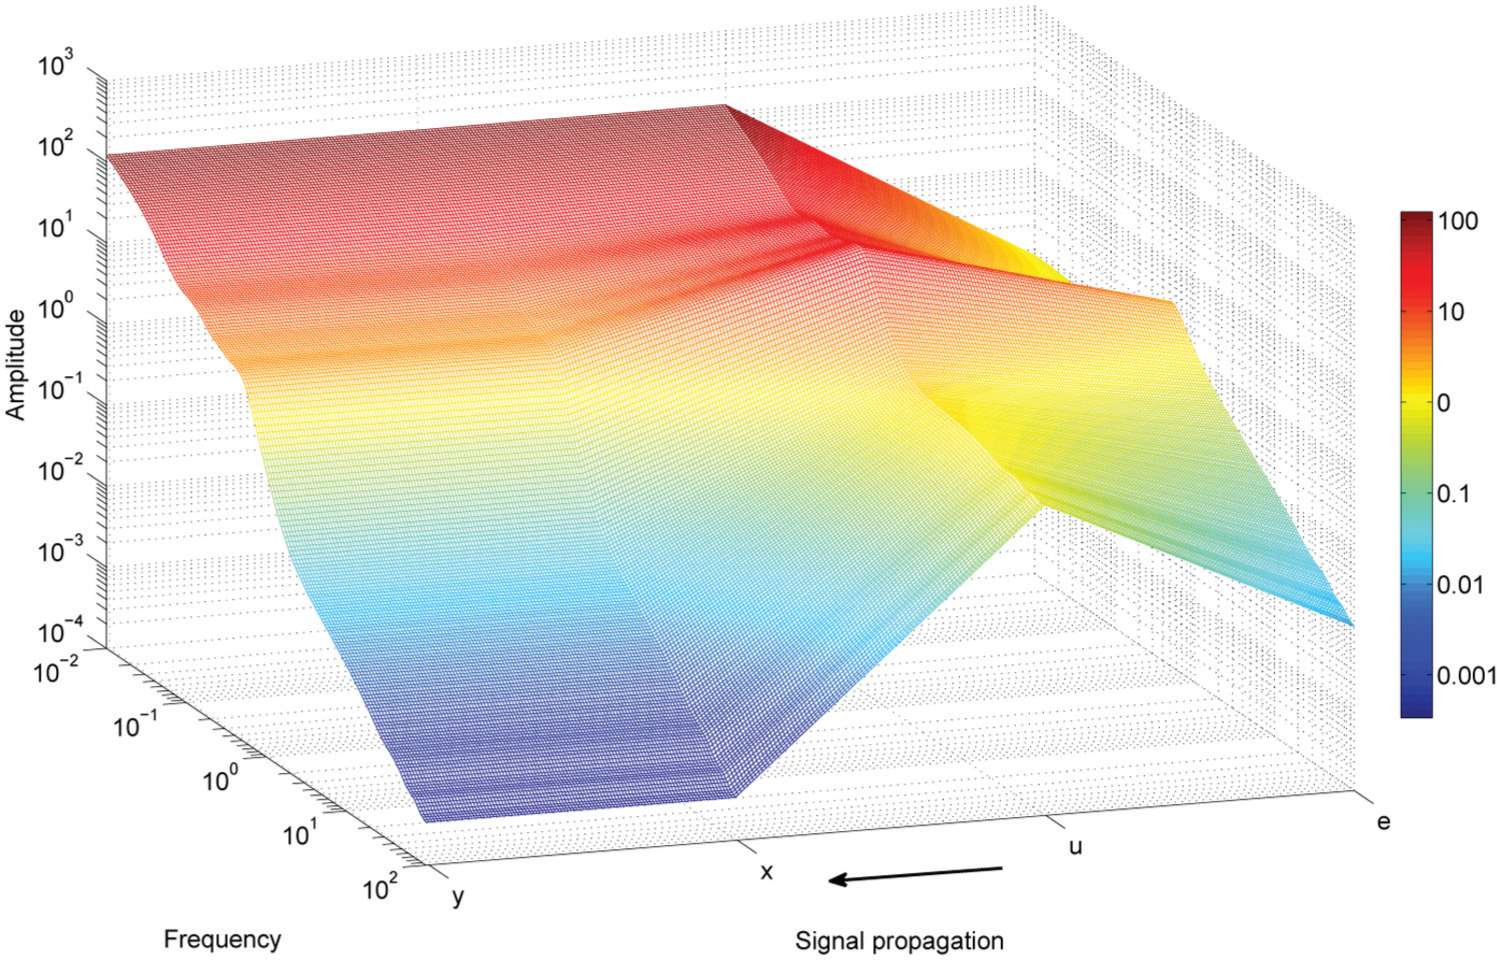
Frequency-domain representation of the signal propagating along the forward path of the linear control system in response to a unit-step input by means of a 3D surface plot.
Fractionalization of a nonlinear system
We analyze now the nonlinear control system of Figure 5. This system comprises an integer-order PID controller, a double integrator, and a transport delay,
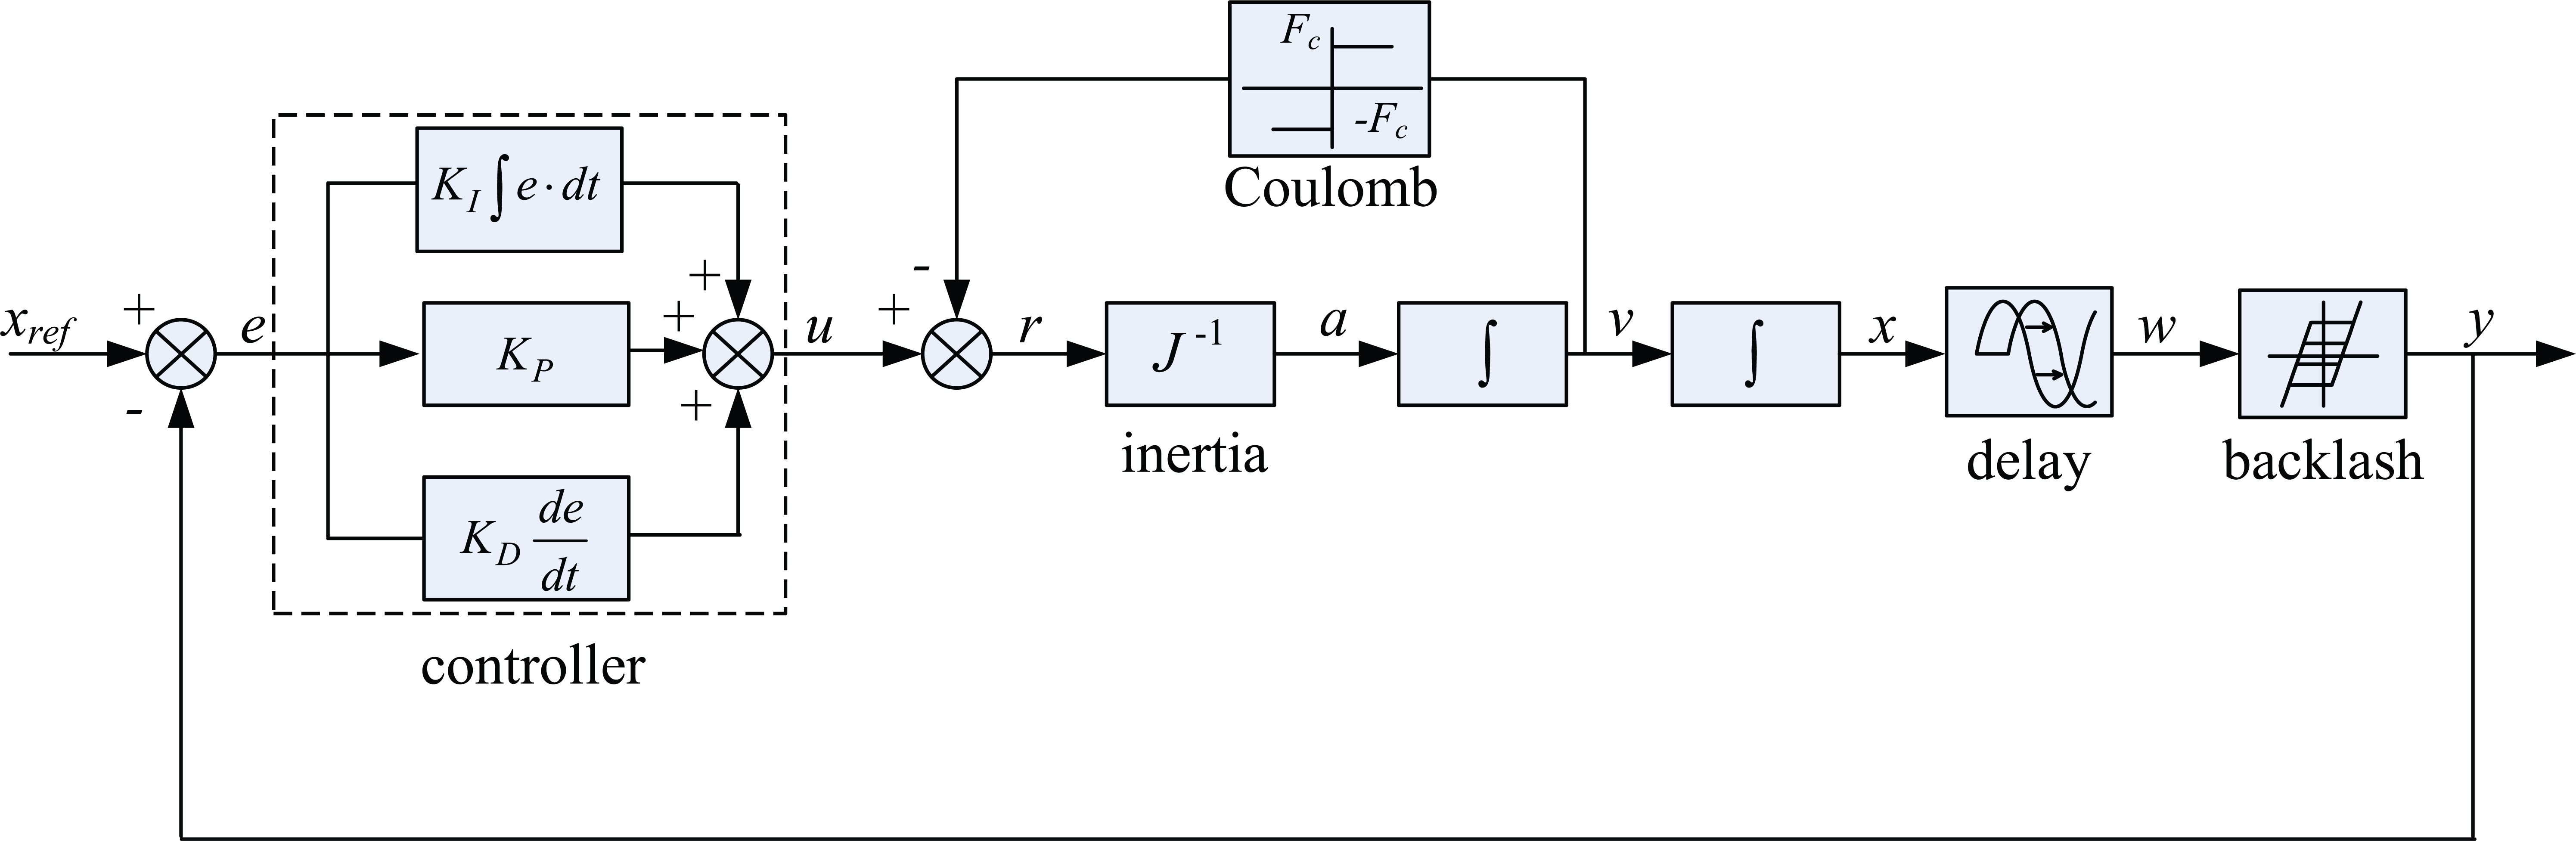
Block diagram of a feedback control system involving delay and nonlinearities.
The controller was tuned to yield an oscillatory stable response, thus sacrificing performance just to have a richer signal content for visualization. The system parameters are summarized in Table 1. All units are given in the International System.
Parameters of the nonlinear control system.

PID: proportional–integral–derivative.
As mentioned previously, the linear elemental blocks are fractionalized with
Figures 6 and 7 show the signal propagation along the forward path of the block diagram, from the actuating error,

where
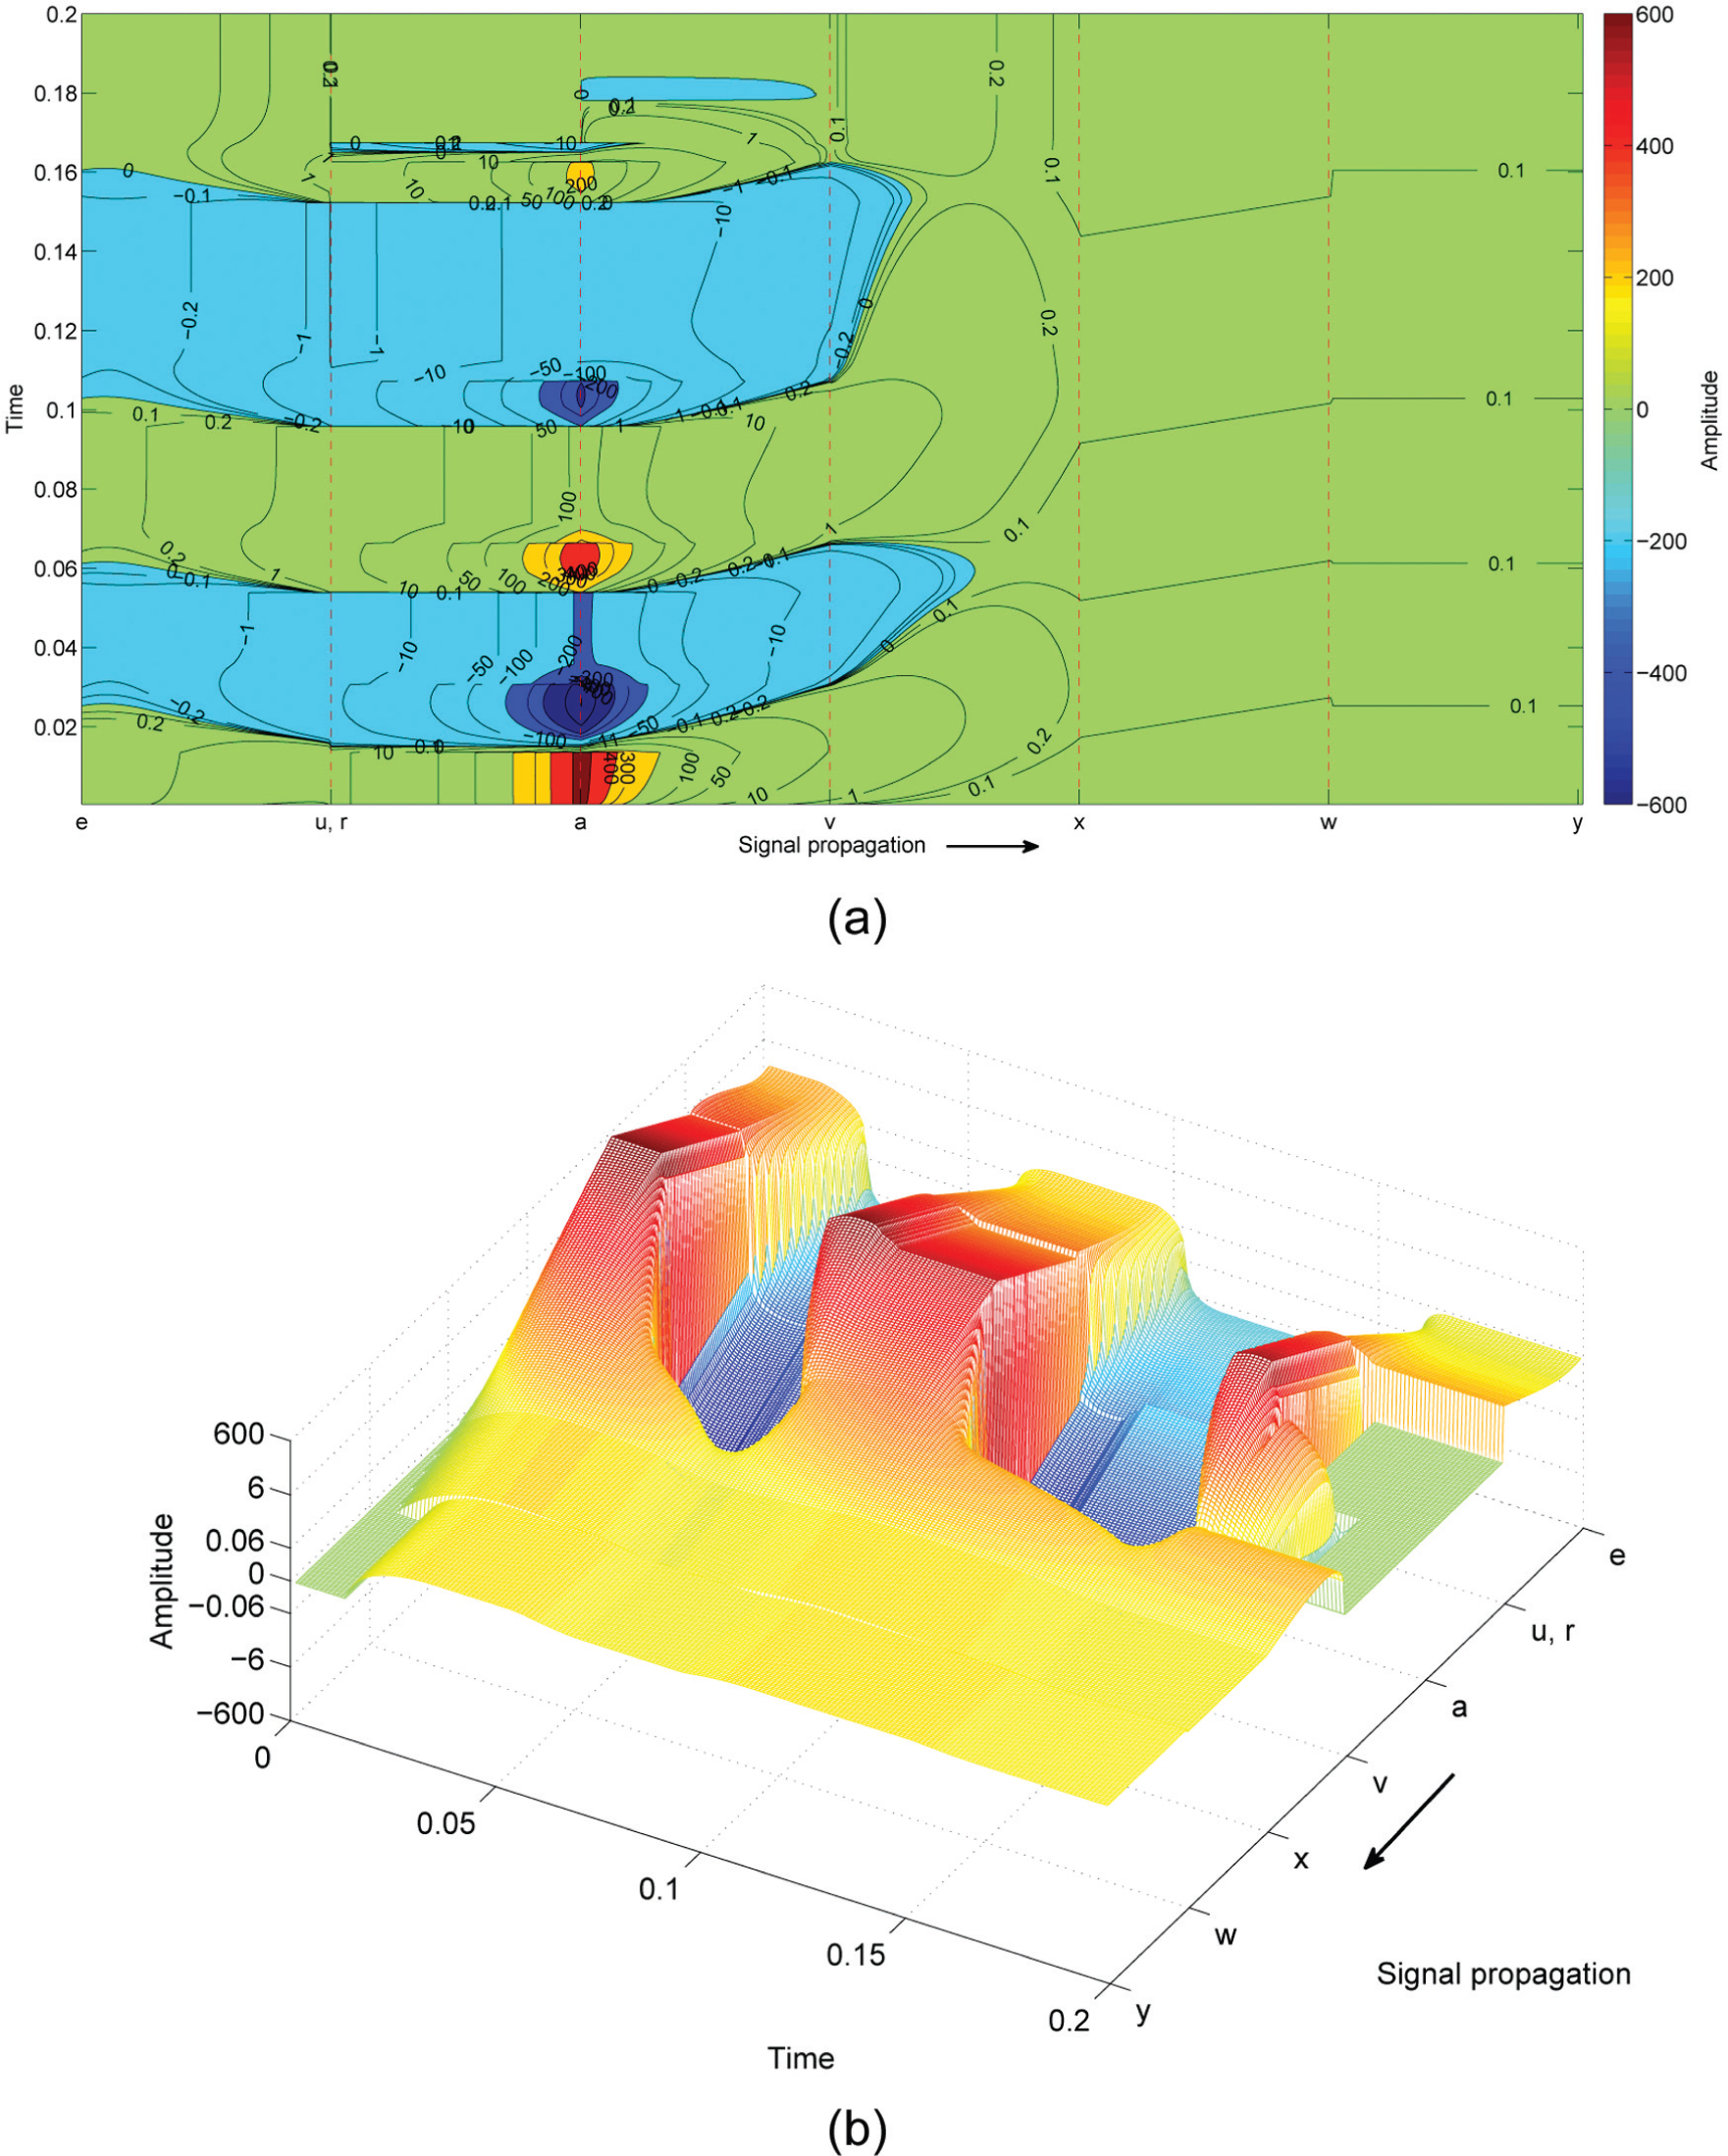
Time-domain representation of the signal propagating along the forward path of the nonlinear control system in response to a unit-step input: (a) contour map and (b) 3D surface plot with the z-axis scale implemented by means of the µ-law.

Frequency-domain representation of the signal propagating along the forward path of the nonlinear control system in response to a unit-step input by means of a 3D surface plot.
We identify six stages on the signal traveling path. In the portion,
Conclusion
This article formulated a novel visualization technique inspired in the FC paradigm that is particularly useful in the presence of nonlinear dynamics. The proposed methodology determines the signal propagating as a time/frequency-space wave within the structure of a controlled system. Linear and nonlinear closed-loop control systems were analyzed based on the time and frequency responses under the action of a reference step input signal. The method is an abstract scheme, and the results are to be interpreted as a new visualization concept that extends the capabilities of the classical tools. Therefore, obtaining a physical meaning is not the goal of this study but to open a new research procedure to the classical integer modus operandi. Further research may address more complex control systems, involving distinct nonlinearities, or the embedding of the proposed fractionalization scheme with different signal analysis tools or computer visualization techniques.
Footnotes
Academic Editor: Xiao-Jun Yang
Declaration of conflicting interests
The author(s) declared no potential conflicts of interest with respect to the research, authorship, and/or publication of this article.
Funding
The author(s) received no financial support for the research, authorship, and/or publication of this article.