
Abstract
Speed is a fundamental measure of traffic performance for highway systems. There were lots of results for the speed characteristics of motorized vehicles. In this article, we studied the speed distribution for mixed bicycle traffic which was ignored in the past. Field speed data were collected from Hangzhou, China, under different survey sites, traffic conditions, and percentages of electric bicycle. The statistics results of field data show that the total mean speed of electric bicycles is 17.09 km/h, 3.63 km/h faster and 27.0% higher than that of regular bicycles. Normal, log-normal, gamma, and Weibull distribution models were used for testing speed data. The results of goodness-of-fit hypothesis tests imply that the log-normal and Weibull model can fit the field data very well. Then, the relationships between mean speed and electric bicycle proportions were proposed using linear regression models, and the mean speed for purely electric bicycles or regular bicycles can be obtained. The findings of this article will provide effective help for the safety and traffic management of mixed bicycle traffic.
Introduction
Because of characteristics including low cost, convenience, mobility, long trip distance, and environmental friendliness of electric bicycles (E-bikes), they have been one of the most important travel modes in some developing countries such as China, Vietnam, Indonesia, and Malaysia. 1 Due to the inadequate and low-efficiency public transportation facilities in some Chinese cities, E-bikes have been a very popular transportation choice for low-income people in China, especially in many southern Chinese cities (due to not very cold weather). E-bike ownership in China reached approximately 200 million in 2013. 2
The rapid increase in the E-bikes has led to a mixture of bikes in operation in many cities: E-bikes and regular bicycles (R-bikes). Previous studies have proposed that the speed differences between E-bikes and R-bikes will engender some efficiency and safety issues.3–6 Speed is one of the most significant traffic flow parameters for capacity analysis and level of service. The speed characteristics of mixed bicycle traffic flow are more complicated than those of purely R-bikes traffic flow. The speed-related traffic crashes caused by E-bikes are more severe than those caused by R-bikes. Therefore, the speed of mixed bicycle traffic is important to understand and will provide in-depth knowledge for traffic flow theory and traffic safety more generally.
Mathematical models or distributions used to describe speed characteristics of mixed bicycle traffic flow are very useful, especially since they can be utilized for simulation, safety analysis, and determining bicycle speed limits. Therefore, the purpose of this article is to analyze the characteristics of field speed data for mixed bicycle traffic conditions and to develop a speed distribution model considering the effect of E-bike proportions. The mixed bicycle traffic consists of two different types of bicycles (E-bikes and R-bikes).
The rest of the article is organized into five sections. Section “Literature review” reviews related literatures for bicycle speed characteristics and distributions. Section “Data collection” presents the collected field data of bicycle speeds and related analyses. Section “Speed distribution model” presents distribution models and fitting results of the proposed models. Section “Effect of E-bike proportions on speed” develops speed models incorporating E-bike proportion factors. Section “Conclusion” concludes the article with a summary of our findings.
Literature review
Speed, as one of the three parameters (flow, speed, density) for traffic flow, is a fundamental measure of traffic performance of highway systems. Lots of research has been conducted to examine the speed characteristics of motorized vehicles, effect on speed, speed dispersion, safety-based speed characteristics, variable speed limits, and speed–density relationship models.7–10
Similarly, there is a lot of research that has examined distribution models for motorized vehicle speed data, such as normal distribution, skewed distribution, and composite distribution. In regard to normal distribution, Leong 11 and McLean 12 found that, for lightly trafficked two-lane roads where most vehicles are traveling freely, car speeds measured in time are approximately normally distributed with a coefficient of variation ranging from about 0.11–0.18. Sahoo et al. 13 found that the vehicular speeds conform to the normal distribution with a mean of 42–45 km/h and a standard deviation of 9–13 km/h on different intercity roads in India. Kumar and Rao 14 proposed that the spot speed data conform to the normal distribution. They considered the 85th percentile speed as the average free speed, and the average free speeds of cars, buses, and trucks were found to be approximately 65, 56, and 52 km/h, respectively. Hossain and Iqbal 15 also found that the speed of commonly available vehicles in Dhaka, India, follow a normal distribution. A linear regression analysis was carried out to explore the relationship of drivers’ free speed with the pavement and shoulder widths. For skewed distribution, Haight and Mosher 16 considered that the speed data could be well represented by either a gamma or a log-normal distribution. These distributions offer the advantage that the same functional form is retained when the time speed distribution is transformed into a space-speed distribution and avoid the theoretical difficulty of the negative speeds given by the infinite tails of the normal distribution. Gerlough and Huber 17 proposed the use of the log-normal distribution. This resembles the normal distribution, but is skewed with a larger tail to the right. For composite distribution, Ko and Guensler 18 stated that speed distribution could be characterized as two different components, congested and non-congested speeds, depending on location-specific congestion definitions. The change between unimodal (expected) speed distribution and bimodal (unexpected) speed distribution will indicate the pattern of traffic variations of specified interstate freeway systems. Jun 19 evaluated the traffic congestion patterns during the Thanksgiving holiday period in 2006 using a Gaussian mixture distribution estimated by the Expectation–Maximization (EM) algorithm for modeling speed data.
Previous research focuses on motorized vehicle speed distributions. Recently, however, there has been some research on bicycles or mixed bicycle traffic speed distributions. Katti and Raghavachari 20 reported that the spot speeds of cars, heavy commercial vehicles, light commercial vehicles, scooters, and cycle rickshaws (pedal tricycles) follow a normal distribution, whereas for bicycles, they follow a log-normal distribution. Dey et al. 21 proposed speed distribution curve models under mixed traffic conditions which included fast moving vehicles such as car/jeep, truck/bus, two-wheeler, and three-wheeler and slow moving vehicles such as bicycle and tractor. Lin et al. 22 surveyed the operating speeds of both E-bikes and R-bikes on the non-motorized lanes in Kunming, China, and presented the comparison results of speeds and its distributions between E-bikes and R-bikes. Statistical analysis indicated that the mean speed of E-bikes was 21.86 km/h, which is 7.05 km/h faster, or 47.6% higher, than that of R-bikes. The normal distribution and logarithmic normal distribution for E-bikes and R-bikes were tested. Wang et al. 23 analyzed the impact of various factors on the speed of non-motorized vehicles and established a normal speed distribution for mixed bicycle traffic flow.
In previous research, many researchers focus on motorized vehicle speed distributions, and the speed distributions of E-bikes and R-bikes were analyzed separately. To the best of our knowledge, the speed distributions of mixed bicycle traffic flow have rarely been reported, until now. This study examined the statistical significance of differences in the distribution of speeds between E-bikes and R-bikes under different conditions. This study also examined the relationship between the speed parameters of mixed bicycle traffic and E-bike proportions.
Data collection
Survey sites and time
Field bicycle speed data mixed with E-bikes and R-bikes are of significance for modeling of speed distributions. Four survey sites in the Chinese city of Hangzhou, where bicycle exclusive paths are separated from motorized vehicle lanes, were selected for data collection. There are several basic requirements for the selection of survey sites and times. First, the bicycle path sections were located in the downtown area of Hangzhou, where more E-bikes and R-bikes and different traffic conditions can be observed. Therefore, the amount of heterogeneous bicycle traffic should be sufficiently large to provide enough data samples. Second, the survey sites are located at least 100 m away from an intersection so as to minimize the effects of traffic signals. Third, the selected survey path should be straight and of low gradient. Fourth, the survey days were weekdays, and the weather was sunny. Fifth, the time of data collection covered both peak hours and off-peak hours. Therefore, the speed data under these different traffic conditions could be collected.
Video data collection
Video investigation technology is popular for bicycle traffic data survey. In this study, a camera was set up on the roadside of the bicycle path to record the operation of bicycle traffic.24,25 In order to ensure that the riders would be unaware they were being observed, the camera was covertly and carefully placed. When a bicycle crosses the marked two fixed positions, the video surveillance application could record the time and the speed can be calculated easily. The other parameters such as bicycle types, gender, and riders’ age were recorded and coded manually. For the results reported in this article, bicycle type consists of two categories, E-bikes and R-bikes. Gender is easily recorded by the investigator. In regard to age, the riders were divided into three groups: (1) under 30 years, (2) between 30 and 50 years, and (3) over 50 years.
Survey results
Altogether, 11,829 speed samples, including 61.8% E-bike data, have been collected from four survey sites. Each site generated nearly 3000 samples for analysis. Table 1 presents the survey sites name, bicycle path width, sample size, bicycle type proportion, riders’ gender proportion, and riders’ age proportion, where RB denotes regular bicycles and EB denotes electric bicycles; M denotes male riders and F female riders; and Y denotes young (<30 years), M middle-aged (30–50 years), and E elderly (>50 years) riders. It can be seen that the EB was the largest proportion (average up to 61.8%) and that male and young riders were the major riders for non-motorized vehicles (average up to 64.4% and 67.6%). This result is likely due to users of E-bikes and R-bikes being mainly high school students and low-income persons who use bicycles as the travel mode for commuting.
Basic statistical description of four survey sites.

RB: regular bicycles; EB: electric bicycles; M: male; F: female; Y: young; M: middle-aged; E: elderly.
Basic statistics relating to speed samples from the four field survey sites are shown in Table 2, where Min, Max, Median, Mean, and SD refer to minimum speed value, maximum speed value, median speed value, average speed value, and standard deviation, respectively. Skewness and kurtosis are two important parameters in probability theory and statistics. Skewness is a measure of the asymmetry of the probability distribution of a real-valued random variable about its mean. The skewness value can be positive or negative. Kurtosis is any measure of the “peakedness” of the probability distribution of a real-valued random variable. In a similar way to the concept of skewness, kurtosis is a descriptor of the shape of a probability distribution. Positive kurtosis indicates a peaked distribution and negative kurtosis indicates a flat distribution. Skewness and kurtosis can be calculated by


where γ and β are skewness and kurtosis of bicycle speed samples, respectively. vi is the speed of bicycle i and n is the number of speed sample.
Results of field speed data (km/h).
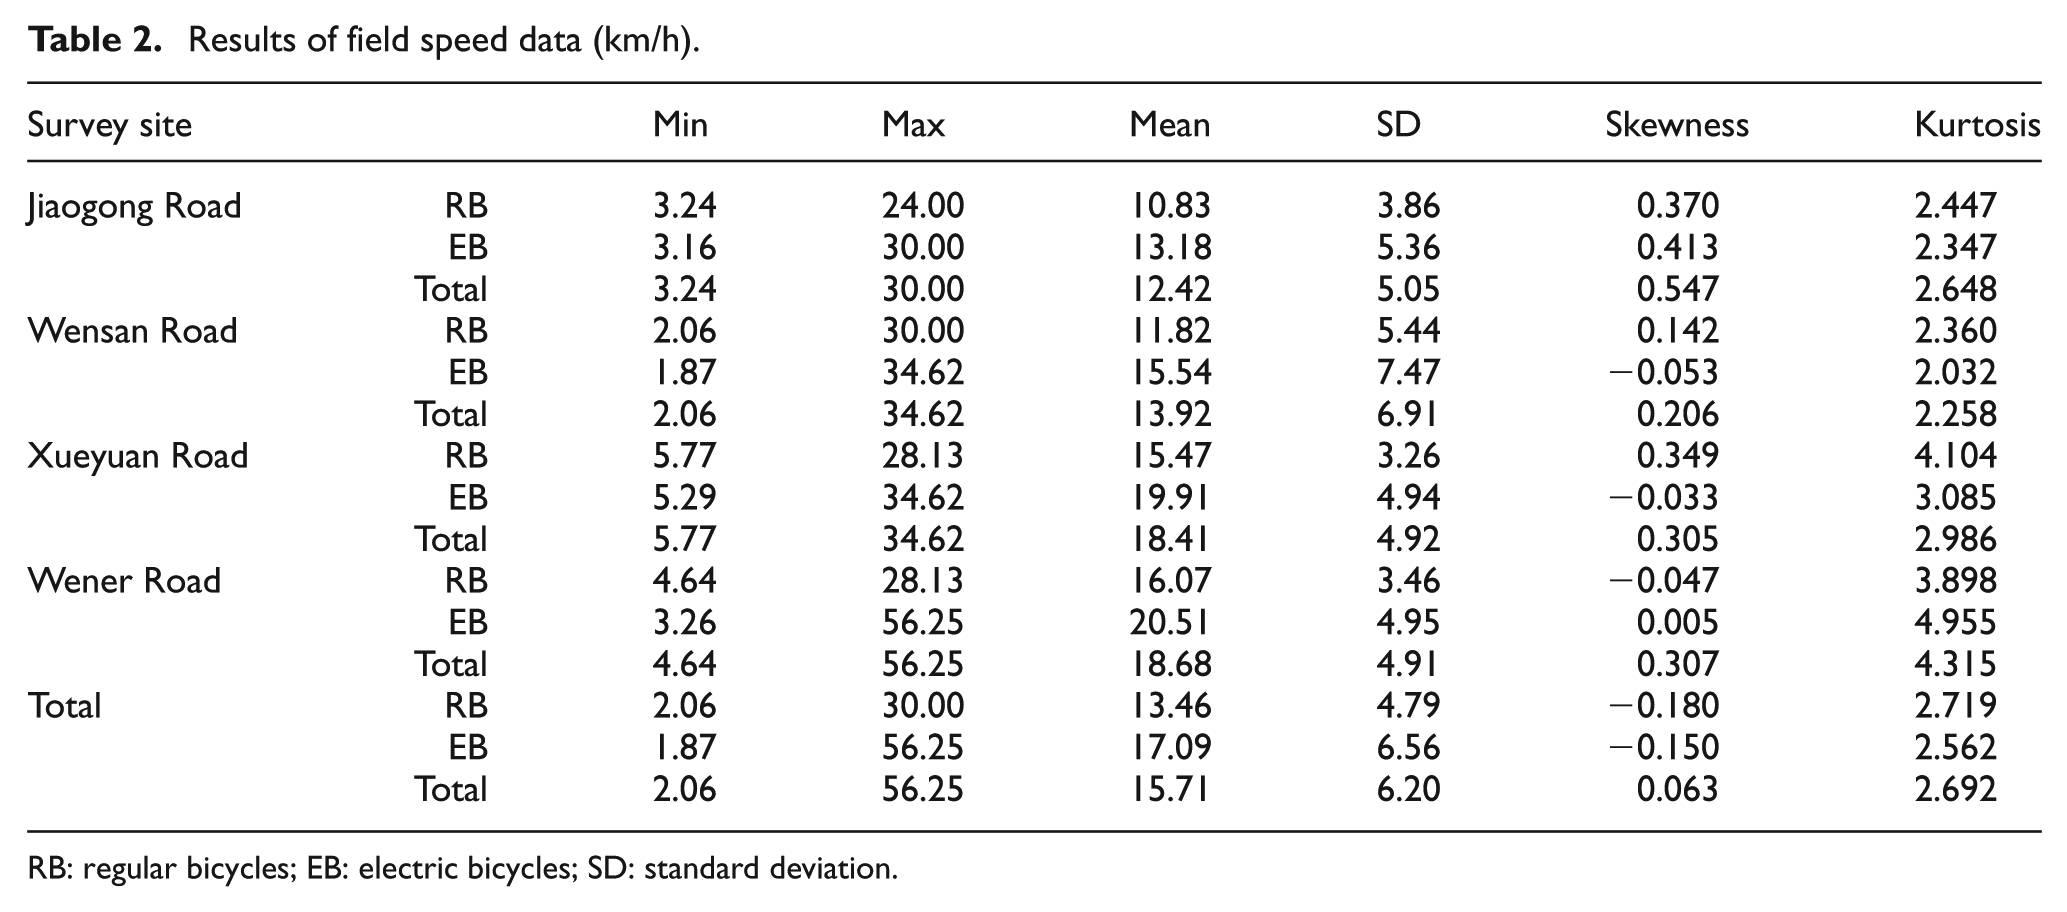
RB: regular bicycles; EB: electric bicycles; SD: standard deviation.
Table 2 shows that the means of R-bike speed at the different survey sites range from 10.83 to 16.07 km/h, and the means of E-bike speed at the different survey sites range from 13.18 to 20.51 km/h. The total means of R-bike and E-bike are 13.46 and 17.09 km/h, respectively. The mean speed of E-bikes is 3.63 km/h faster and 27.0% higher than that of R-bikes. The maximum speed of E-bike is 56.25 km/h, the same as a motorized vehicle’s speed limit. Meanwhile, the values of skewness and kurtosis show that the speed data do not obey normal distribution.
Speed distribution model
Speed distribution is very important for traffic flow. Figure 1 shows the field speed data for R-bikes, E-bikes, and total samples from two sites. It can be seen that the distributions of R-bikes and E-bikes have different shapes and lead to the complicated distributions of total samples composed of R-bikes and E-bikes. However, a single normal distribution would not fit the data very well because of the high values of skewness and kurtosis for mixed bicycle speed data.

Field speed data distributions of R-bikes, E-bikes, and total, respectively: (a) Jiaogong Road and (b) Xueyuan Road.
In order to examine the characteristics of bicycle speed distribution under mixed bicycle traffic conditions, four distribution models (normal, log-normal, gamma, and Weibull) were proposed for modeling bicycle speed samples. The probability density functions of four distributions are shown as follows
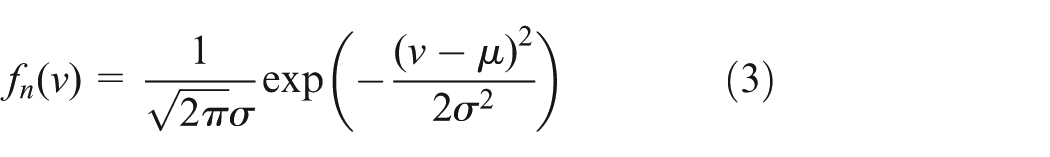


where fn(v), fl(v), fg(v), and fw(v) are probability density functions of normal, log-normal, gamma, and Weibull distributions, respectively. µ, σ, θ, k, and λ are the model parameters, respectively.
Using the field data from four survey sites, the four distribution parameters could be easily estimated using MATLAB 7.0. Maximum Likelihood (ML) estimation was used for parameter estimates and confidence intervals. The field data density function and the estimated density functions are shown in Figure 2, respectively. As can be roughly seen from the figure, the log-normal and Weibull distributions have better fitting results than the other two distributions.
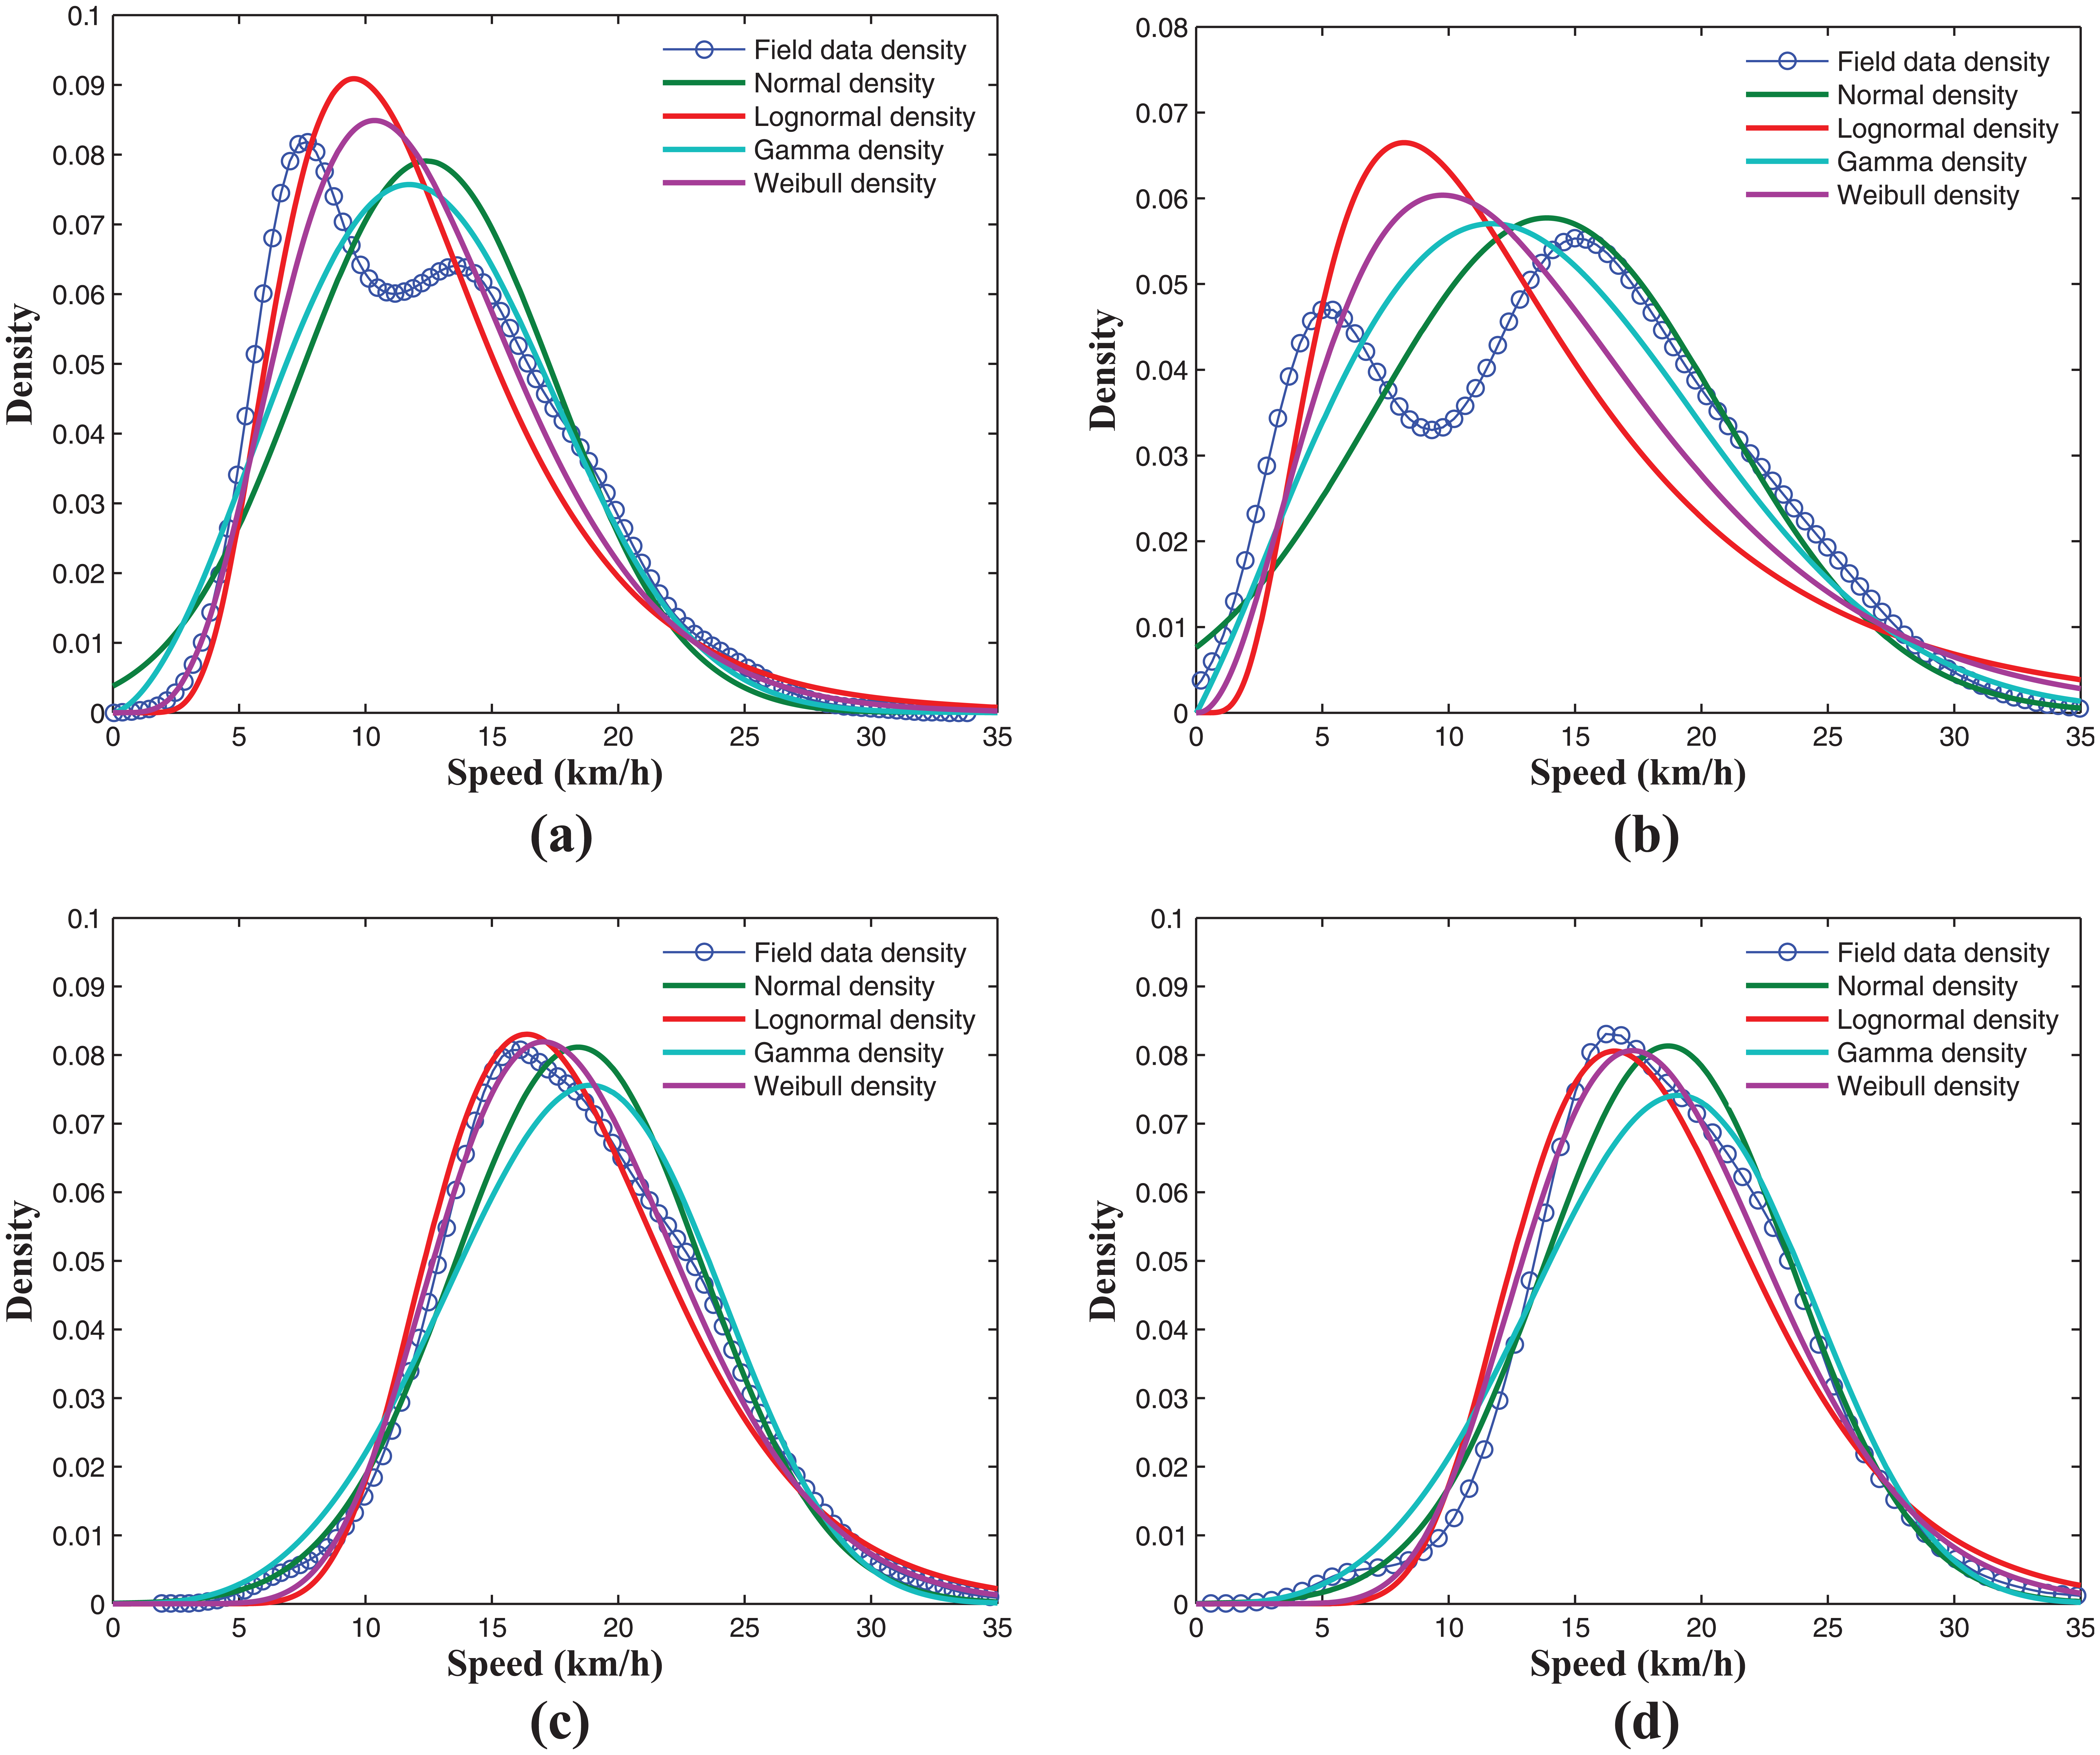
Speed distribution results of each survey site: (a) Jiaogong Road, (b) Wensan Road, (c) Xueyuan Road, and (d) Wener Road.
In order to test the fitting results quantitatively, a single sample Kolmogorov–Smirnov (K-S) goodness-of-fit hypothesis test was used.26,27 H indicates the result of the hypothesis test, where H = 0 means that do not reject the null hypothesis at significance level alpha = 0.05, and H = 1 means reject the null hypothesis at significance level alpha = 0.05. The K-S test statistics KSSTAT and critical value of the test (CV) were also calculated and are shown in Table 3. If KSSTAT is larger than CV, it means accepting the null hypothesis; the field data obey the proposed distribution model. The larger the difference between KSSTAT and CV, the better the results of goodness-of-fit.
Summary statistics of K-S goodness-of-fit hypothesis test.

K-S: Kolmogorov–Smirnov; CV: critical value of the test.
From Table 3, it can be seen that the field data from four survey sites can all accord with the log-normal and Weibull distributions and pass the K-S test. However, only the field data from Xueyuan road and Wener road can accord with the normal and gamma distributions. This may be due to the field data from Jiaogong road and Wensan road having included more congested speed data and due to the traffic flow being more complicated and mixed. Therefore, normal and gamma distributions would not have the ability to fit the data very well. The results confirm that log-normal and Weibull distributions can be used for modeling the distributions of mixed bicycle speed data.
Effect of E-bike proportions on speed
Because of the higher speed of E-bikes, it can be easily seen that with the increase in E-bike proportions, the average speed of mixed bicycle traffic will increase. In order to analyze the effect of E-bike proportions on bicycle traffic speed, this section proposed a linear regression model for modeling the effect of E-bike proportions. The regression model is as follows

where vm is estimated speed means of mixed bicycle traffic flow using log-normal distribution, pe is the proportions of E-bikes in mixed bicycle traffic flow, and a and b are parameters of regression function. The R2 coefficient of determination is a statistical measure reflecting how well the regression line approximates the field data. The coefficient of determination can be defined as

where
In order to analyze the effect of E-bikes, there were four steps for modeling the regression model. First, the field data from four sites can be classified to several intervals. Each interval has some speed samples. Second, a log-normal distribution model was used to estimate the speed mean of each interval, and the E-bike proportions can also be calculated. Third, the relationship between speed means and E-bike proportions for each interval would be plotted. Finally, the regression model (equation (7)) was used for estimating the model parameters.
Figure 3 shows the regression results from four survey sites. It can be seen that there are strong linear relationships between E-bike proportions and mean speed. The values of R2 are all above 0.5, which means good fitting results. Using the regression function, the speed mean under pure R-bikes or E-bikes can be easily obtained by

where

Linear regression results between E-bike proportions and speed means for each survey site:. (a) Jiaogong Road, (b) Wensan Road, (c) Xueyuan Road, and (d) Wener Road.
In order to verify the effect of the regression model, the speed means of purely R-bikes and E-bikes calculated using equation (9) would be compared with those from field data. We employed two commonly used performance indices to evaluate the proposed regression model. The first was the mean absolute percentage error (MAPE), and the second was the root mean square error (RMSE).
Table 4 shows the estimated results and performance indices of the proposed regression model. These results indicate that the MAPE value is 2.3% and the RMSE value is 0.45. This shows that the regression model can accurately estimate the speed mean for all four datasets. Therefore, this method can be applied for calculating the speed mean for different E-bike proportions under mixed bicycle traffic conditions.
Results of estimated speed mean (km/h).

RB: regular bicycles; EB: electric bicycles; MAPE: mean absolute percentage error; RMSE: root mean square error.
Conclusion
Speed distribution modeling for mixed bicycle traffic has largely been ignored in previous research. Based on the field survey of four roads from the downtown area of Hangzhou, China, the bicycle speed samples using different bicycle types, genders, and rider ages were collected. Several interesting results were obtained using a modeling approach to the data. First, the total speed mean of E-bikes was 17.09 km/h, 3.63 km/h faster and 27.0% higher than that of R-bikes. The maximum speed of E-bikes is up to 56.25 km/h, approaching the speed of motorized vehicles. Second, speed samples of R-bikes, E-bikes, and total bicycles have different distributions. The total field speed samples follow the log-normal and Weibull distributions very well. Third, a linear regression model between speed means and E-bike proportions was proposed, and the parameters were estimated using field data. Fourth, the speed means for purely R-bike or E-bike traffic were estimated and verified using field data. The findings of the article can be used for bicycle safety analysis and bicycle traffic management. Future research will focus on the effect of the bicycle riders’ characteristics (such as gender or age) on bicycle traffic speed.
Footnotes
Acknowledgements
Many thanks to Prof. Wang, Dr Jin, and Mr Zhou in Zhejiang University for providing parts of the field bicycle data. We thank Dr Judy Fleiter from the Centre for Accident Research and Road Safety, Queensland, for assistance with proof-reading.
Academic Editor: Geert Wets
Declaration of conflicting interests
The author(s) declared no potential conflicts of interest with respect to the research, authorship, and/or publication of this article.
Funding
The author(s) disclosed receipt of the following financial support for the research, authorship, and/or publication of this article: This work was supported by the National Science Foundation of China (No. 51278220, 51278454, 51108208), the China Postdoctoral Science Foundation (20141M551178), and the Key Science and Technology Innovation Team of Zhejiang Province (2013TD09).